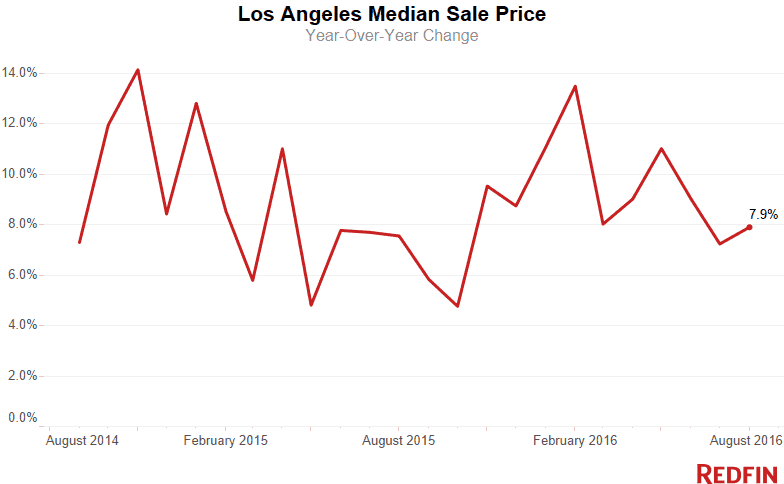
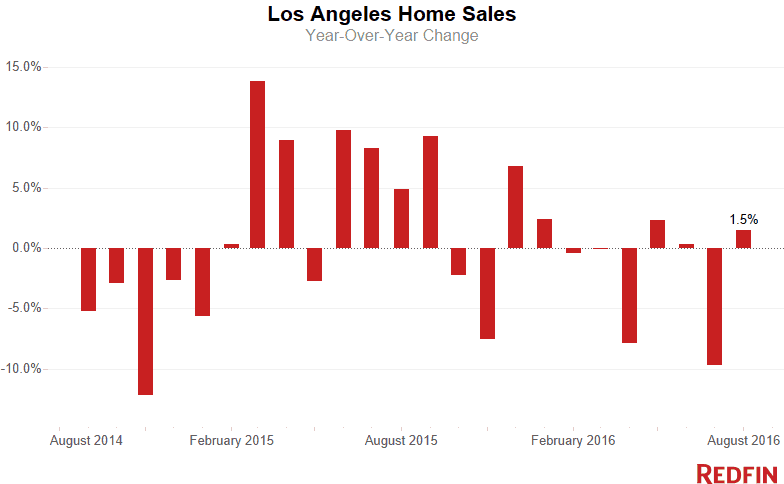
Home prices in the city of Los Angeles rose 7.9 percent in August from a year earlier to $615,000, continuing a run of annual price increases that’s lasted more than four years. Home sales inched up 1.5 percent since last year, following July’s sharp annual decline.
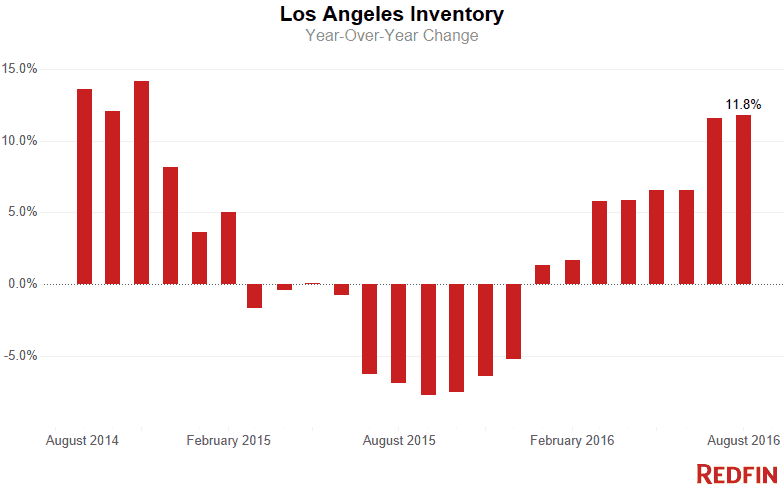
The number of homes for sale continued to grow. Housing inventory was up 11.8 percent, which resulted in part from a healthy number of new listings added to the market in August. A total of 3,740 homes were newly listed last month, which is the largest number of fresh inventory added to L.A. since July 2013.
Although prices continue to climb and competition is always a factor in L.A., the summer real estate season showed some signs of cooling, even if by just a few degrees. The typical home sold in 32 days, nine days slower than during the same time last year. In August 2013, homes sold within 17 days of being listed, the fastest August market Redfin has on record.
“More inventory has provided some relief for L.A. homebuyers,” said Anthony Altieri, a Redfin real estate agent in Los Angeles. “We’re not out of the woods by any means, however, and some neighborhoods are still highly competitive. But one lesson to learn here is that shopping later in the season can really benefit you if you’re not in a rush to move in before school starts in the fall. They say location is everything with real estate, but timing has a lot to do with it too.”
Area Trends and Hot Neighborhoods
It is certainly not news that the Eastside housing market is hot. Of the neighborhoods we track, Highland Park, Echo Park, Silver Lake and Mount Washington show consistent price growth and high competition. But there is yet another Eastside ‘hood to watch.
The median sale price in Glassell Park jumped 17 percent compared to last year and is now over $750,000 — the highest median sale price for the neighborhood since at least 2010 when we began tracking data there.
It’s not just the massive sale price that’s extraordinary. Sellers in the neighborhood apparently didn’t see the Eastsider wave coming. In August, the typical home seller asked about $700,000 for their house. Buyers wanted them so badly, they ended up paying significantly more — the median sale price for the ‘hood was $752,500. Fifty-three percent of the homes for sale in Glassell Park sold for more than the asking price.
While homes sat on the market a little longer across all of L.A. in August, many of the fastest neighborhoods were also where the most affordable homes could be found. In Crenshaw, Fox Hills and Pacoima — where the median sale price is less than $500,000 — the typical home sold in less than 20 days.
Here’s what’s happening in your neighborhood:
| Place | Median Sale Price | Year-Over-Year | Homes Sold | Year-Over-Year | Inventory | Year-Over-Year | New Listings | Median Days on Market | Avg Sale-to-List |
|---|---|---|---|---|---|---|---|---|---|
| Beverly Glen | $1,545,000 | 3.1% | 14 | -39.1% | 49 | 28.9% | 40 | 32 | 99.1% |
| Beverly Hills Post Office | $2,050,000 | 16.3% | 48 | -25.0% | 127 | 14.4% | 99 | 42 | 97.8% |
| Brentwood | $1,700,000 | 34.4% | 148 | 3.5% | 153 | -5.6% | 206 | 25 | 99.9% |
| Central LA | $871,000 | 3.7% | 1,034 | -7.1% | 1,132 | 9.3% | 1,494 | 33 | 99.3% |
| Century City | $1,010,000 | 15.4% | 75 | -31.2% | 78 | -17.0% | 116 | 20 | 100.0% |
| Chatsworth | $560,000 | 0.2% | 117 | 4.5% | 87 | 42.6% | 130 | 38 | 99.1% |
| Cheviot Hills | $1,853,000 | 12.3% | 31 | 6.9% | 16 | 77.8% | 33 | 42 | 99.3% |
| Crenshaw | $472,000 | 0.4% | 38 | -25.5% | 23 | -36.1% | 52 | 19 | 102.5% |
| Eagle Rock | $764,125 | 9.2% | 78 | -32.2% | 69 | 7.8% | 122 | 21 | 102.4% |
| East LA | $650,000 | 11.1% | 669 | -6.6% | 541 | 6.5% | 967 | 21 | 102.4% |
| Encino | $950,500 | 25.7% | 213 | -12.7% | 224 | 19.8% | 295 | 40 | 98.2% |
| Fox Hills | $480,000 | 14.3% | 25 | -28.6% | 10 | -23.1% | 37 | 18 | 102.0% |
| Glassell Park | $752,500 | 16.9% | 32 | -37.2% | 38 | 8.6% | 58 | 36 | 103.2% |
| Greater Echo Park Elysian | $795,000 | 8.9% | 70 | 22.8% | 49 | -30.0% | 85 | 27 | 100.9% |
| Hancock Park | $1,430,000 | -23.1% | 21 | 16.7% | 37 | 117.7% | 38 | 19 | 99.8% |
| Highland Park | $649,000 | 5.5% | 95 | -30.7% | 79 | 8.2% | 150 | 18 | 103.8% |
| Hollywood | $726,250 | 1.3% | 88 | -19.3% | 87 | 38.1% | 103 | 35 | 100.1% |
| Hollywood Hills West | $880,000 | -16.0% | 131 | -26.0% | 184 | 10.8% | 215 | 30 | 99.9% |
| Holmby Hills | $870,000 | -10.8% | 5 | 25.0% | 8 | 0.0% | 9 | 37 | 96.6% |
| Lake Balboa | $535,000 | 10.1% | 109 | -6.8% | 76 | 24.6% | 137 | 34 | 100.7% |
| Malibu | $2,300,000 | 22.5% | 33 | 50.0% | 246 | 8.4% | 40 | 64 | 95.2% |
| Marina del Rey | $877,500 | 9.7% | 101 | 13.5% | 63 | 75.0% | 114 | 23 | 100.8% |
| Mid-City | $899,000 | 5.9% | 158 | 1.9% | 141 | 4.4% | 202 | 38 | 99.6% |
| Mount Washington | $747,500 | 7.5% | 30 | -26.8% | 30 | 0.0% | 48 | 33 | 101.6% |
| North Hollywood | $510,000 | 10.3% | 143 | -12.8% | 126 | 14.6% | 193 | 36 | 100.6% |
| Northwest San Pedro | $518,108 | 7.9% | 132 | -1.5% | 98 | -3.9% | 162 | 39 | 99.4% |
| Pacoima | $385,000 | 6.2% | 79 | -5.9% | 52 | 52.9% | 112 | 16 | 99.7% |
| Panorama City | $380,000 | 19.7% | 79 | 6.8% | 55 | 14.6% | 91 | 23 | 100.8% |
| Pasadena | $705,000 | -0.3% | 163 | -4.1% | 418 | 12.7% | 172 | 38 | 101.2% |
| Santa Monica | $1,380,000 | 0.9% | 56 | -22.2% | 135 | -11.2% | 68 | 19 | 99.8% |
| Sherman Oaks | $811,000 | 16.7% | 281 | -7.9% | 268 | 36.0% | 369 | 41 | 99.3% |
| Silver Lake | $984,750 | 14.8% | 82 | 41.4% | 49 | 8.9% | 119 | 17 | 105.6% |
| South LA | $417,500 | 12.8% | 1,066 | -2.0% | 941 | -10.1% | 1,478 | 31 | 100.1% |
| South Valley | $580,000 | 7.5% | 1,944 | 0.2% | 1,667 | 23.3% | 2,603 | 35 | 99.6% |
| Studio City | $1,067,500 | 9.5% | 168 | -4.0% | 170 | 11.1% | 226 | 30 | 99.8% |
| Sun Valley | $475,000 | 13.1% | 85 | 0.0% | 64 | 23.1% | 102 | 22 | 100.9% |
| Sylmar | $440,000 | 8.6% | 177 | -3.3% | 125 | 19.1% | 237 | 28 | 99.9% |
| Tarzana | $633,500 | 26.7% | 135 | 1.5% | 152 | 10.9% | 220 | 41 | 98.7% |
| Universal City | $795,000 | NA | 1 | NA | NA | NA | NA | 27 | 100.0% |
| Valley Village | $850,000 | 12.7% | 81 | 37.3% | 50 | 47.1% | 90 | 30 | 101.2% |
| Van Nuys | $458,000 | 1.4% | 97 | 7.8% | 63 | -12.5% | 129 | 32 | 99.8% |
| Venice | $1,510,000 | -0.4% | 133 | 20.9% | 158 | 12.9% | 187 | 29 | 98.4% |
| Watts | $300,000 | 11.7% | 65 | 12.1% | 57 | -16.2% | 89 | 33 | 98.7% |
| West Adams | $625,500 | 25.8% | 54 | 12.5% | 25 | -28.6% | 61 | 20 | 102.5% |
| West Long Beach | $370,000 | 10.6% | 35 | -14.6% | 44 | 25.7% | 59 | 36 | 98.8% |
| West Los Angeles | $1,203,000 | 9.4% | 1,783 | -6.8% | 1,671 | 5.8% | 2,376 | 23 | 100.0% |
| Westwood | $1,044,500 | 25.5% | 140 | 1.4% | 106 | -13.8% | 153 | 34 | 98.9% |
| Woodland Hills | $685,000 | 3.0% | 283 | 5.2% | 280 | 60.0% | 394 | 36 | 98.7% |
| Los Angeles, CA | $615,000 | 7.9% | 2,613 | 1.5% | 7,258 | 11.8% | 3,740 | 32 | 100.0% |
See Redfin’s data center to find out what’s happening in other cities.
NOTE: Not all neighborhoods are listed, but totals for L.A. encompass entire city. Data is based on listing information and might not reflect all real estate activity in the market. Neighborhood-specific data is measured over the three months ended August 31. Inventory measures listings active as of August 31.
For more information, contact Redfin journalist services
Phone: 206-588-6863
Email: press@redfin.com
To be added to Redfin’s press release distribution list, subscribe here.
 United States
 Canada