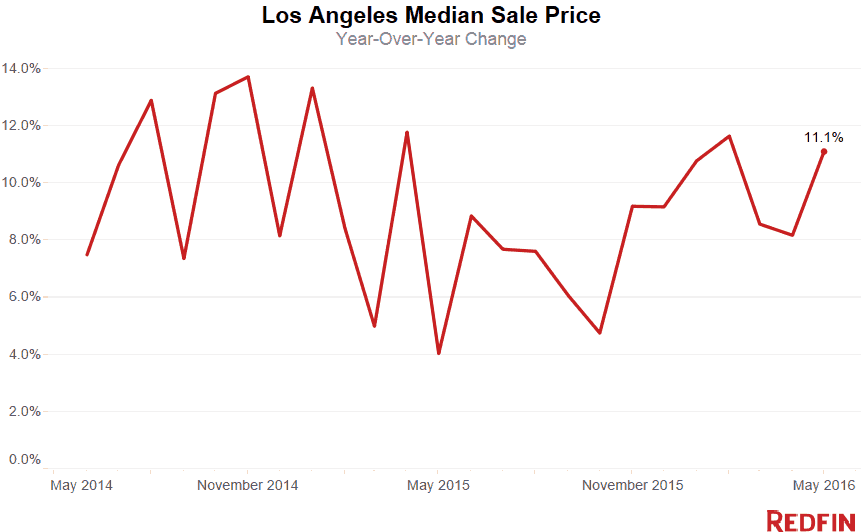
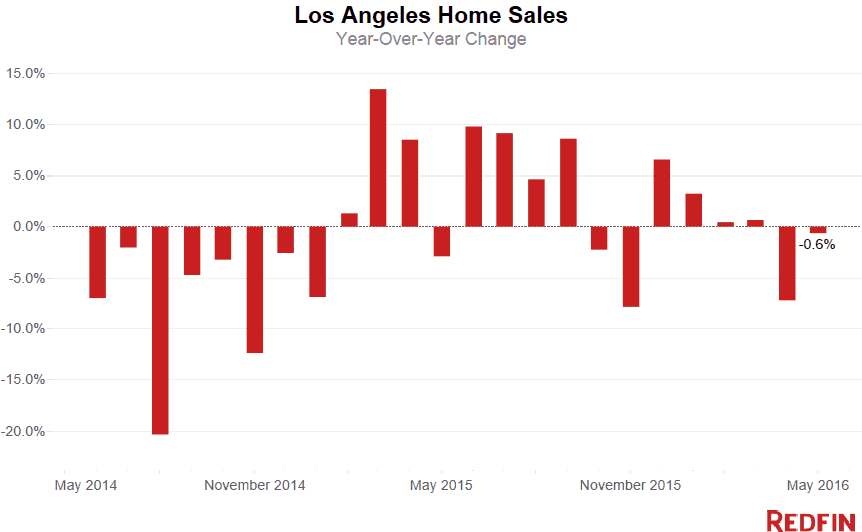
Home prices in the city of Los Angeles rose 11.1 percent in May from a year earlier to $600,000, the 10th month of double-digit price growth. After declining in April, sales were essentially flat in May, dipping 0.6 percent.
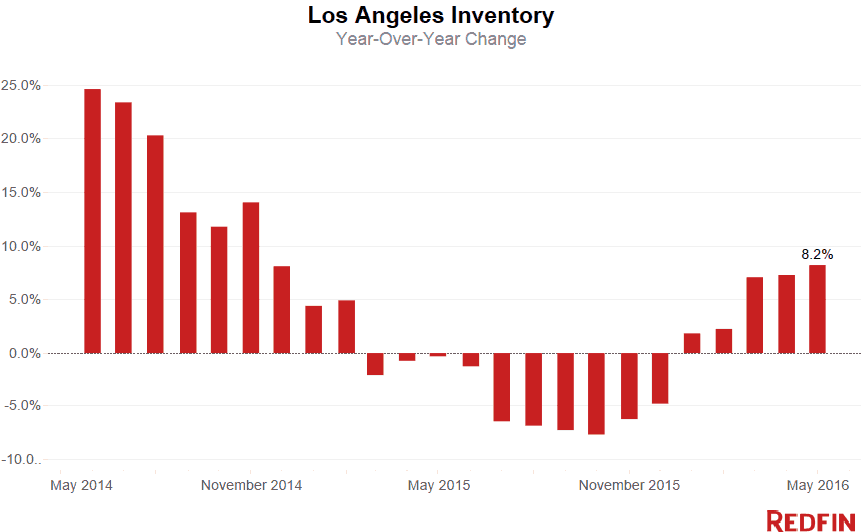
With a 14.6 percent surge in for-sale signs planted in May, the stockpile of homes on the market increased more than 8 percent from a year earlier. Despite five straight months of growing inventory, the city was left with only a 2.6-month supply of homes for sale, far below the six months that is considered a balanced market, and a sign that buyer demand is outpacing supply.
“Buyers are starting to draw their line in the sand,” said Alec Traub, a Redfin agent in L.A. “They still want to participate in the market, but are approaching things more cautiously than in the past. No one wants to buy at the top of the market and buyers aren’t as willing to chase the market as far up as it can go,” Traub said. “Rather than offering 10 to 15 percent over asking, buyers are saying, ‘Here’s what I’m willing to pay. If I get it, great. If not, I’ll move on.’”
Competition remains high for homes priced less than $1.5 million. More than 41 percent of homes sold in May fetched higher prices than sellers were asking. However, the market was about a week slower than the same time last year, with the typical home finding a buyer in 31 days.
Area Trends and Hot Neighborhoods
Of the four major L.A. markets (The Eastside, The Westside, South L.A. and the Valley), the thriving Eastside was the only area with positive year-over-year sales growth, bolstered by strong sales in Eagle Rock (27.4%), Highland Park (16.1%) and Glassell Park (12.2 %). The median sale price for the area increased 11.8 percent. Eagle Rock and Glassell Park were among the fastest-moving neighborhoods in L.A., with the typical home getting snapped up in just over two weeks.
With its central location and relative affordability, Crenshaw was also hot last month. The median sale price jumped 35.6 percent from last May to $648,000. Competition was fierce. More than 57 percent of all homes sold for more than sellers were asking. Homes sold for an average of 4 percent more than their asking price and homes found buyers in two weeks.
Sales fell furthest in The Westside (-7.1%), marking the ninth-straight month of declining or flat home sales. Prices increased 12.6 percent compared to last year.
Sales declined notably in Venice (-18.4%) and Santa Monica (-8.0%), likely due to a lack of homes available to buyers. Both neighborhoods saw double-digit declines in the number of homes for sale.
Here’s what’s happening in your neighborhood:
| Place | Median Sale Price | Year-Over-Year | Homes Sold | Year-Over-Year | Inventory | Year-Over-Year | New Listings | Median Days on Market | Avg Sale-to-List |
|---|---|---|---|---|---|---|---|---|---|
| Beverly Glen | $1,382,500 | -37.2% | 16 | 23.1% | 39 | 25.8% | 43 | 29 | 97.4% |
| Beverly Hills Post Office | $1,695,000 | -7.9% | 46 | -6.1% | 117 | 13.6% | 111 | 43 | 98.4% |
| Brentwood | $1,760,000 | 7.6% | 129 | 6.6% | 121 | -2.4% | 162 | 30 | 100.8% |
| Central LA | $869,000 | 6.0% | 931 | -4.3% | 974 | 6.9% | 1,396 | 30 | 99.0% |
| Century City | $1,067,500 | 26.8% | 84 | 7.7% | 78 | -8.2% | 111 | 19 | 100.1% |
| Chatsworth | $484,500 | 0.4% | 94 | 0.0% | 96 | 65.5% | 157 | 35 | 99.8% |
| Cheviot Hills | $2,260,000 | 50.7% | 23 | 21.1% | 16 | -11.1% | 31 | 21 | 97.7% |
| Crenshaw | $647,500 | 35.6% | 40 | -9.1% | 15 | -40.0% | 46 | 14 | 104.4% |
| Downtown | $635,000 | 2.6% | 89 | -36.0% | 139 | 75.9% | 175 | 45 | 98.8% |
| Eagle Rock | $791,000 | 17.0% | 79 | 27.4% | 36 | -20.0% | 90 | 15 | 103.6% |
| East LA | $648,500 | 11.8% | 608 | 2.4% | 422 | -1.2% | 801 | 20 | 102.0% |
| Encino | $840,000 | 3.9% | 185 | -11.9% | 171 | -6.6% | 272 | 35 | 99.3% |
| Fox Hills | $454,000 | 2.6% | 26 | -23.5% | 7 | -50.0% | 35 | 12 | 101.8% |
| Glassell Park | $722,500 | 13.8% | 46 | 12.2% | 28 | 33.3% | 55 | 16 | 102.4% |
| Greater Echo Park Elysian | $837,500 | 9.4% | 44 | -12.0% | 50 | -9.1% | 70 | 31 | 100.7% |
| Hancock Park | $2,767,500 | 81.5% | 26 | 136.4% | 27 | 35.0% | 32 | 30 | 98.0% |
| Highland Park | $640,000 | 10.0% | 94 | 16.1% | 44 | -33.3% | 105 | 24 | 101.7% |
| Hollywood | $678,000 | -7.1% | 76 | -3.8% | 94 | 25.3% | 117 | 32 | 98.9% |
| Hollywood Hills West | $1,001,500 | -8.9% | 135 | 17.4% | 144 | -4.0% | 192 | 37 | 98.7% |
| Holmby Hills | $882,500 | 24.4% | 4 | -55.6% | 7 | 16.7% | 8 | 51 | 96.2% |
| Koreatown / Wilshire Center | $585,000 | 0.9% | 117 | 9.3% | 131 | 13.9% | 180 | 32 | 98.8% |
| Lake Balboa | $515,000 | 17.3% | 87 | -17.9% | 62 | 17.0% | 138 | 30 | 100.3% |
| Malibu | $3,225,000 | 65.5% | 30 | 7.1% | 245 | 8.9% | 60 | 63 | 93.9% |
| Marina del Rey | $840,000 | -1.8% | 93 | 27.4% | 63 | 16.7% | 126 | 22 | 100.5% |
| Mid-City | $870,000 | 10.1% | 151 | -7.9% | 137 | 0.0% | 229 | 29 | 100.4% |
| Mid-Wilshire | $861,500 | -0.4% | 414 | -3.5% | 425 | 9.2% | 624 | 31 | 99.4% |
| Mount Washington | $762,500 | 7.5% | 30 | -6.2% | 24 | 50.0% | 39 | 19 | 105.1% |
| North Hollywood | $485,000 | 7.2% | 167 | 11.3% | 113 | 22.8% | 196 | 31 | 100.1% |
| North Valley | $470,500 | 8.7% | 1,270 | -1.0% | 913 | 27.5% | 1,840 | 32 | 99.9% |
| Northridge | $615,000 | 19.2% | 127 | -9.9% | 116 | 36.5% | 197 | 37 | 99.0% |
| Northwest San Pedro | $499,000 | 11.6% | 85 | 0.0% | 63 | -14.9% | 115 | 45 | 99.6% |
| Pacific Palisades | $2,282,000 | -12.2% | 101 | -10.6% | 112 | 0.0% | 153 | 30 | 98.3% |
| Pacoima | $385,500 | 16.8% | 88 | 11.4% | 41 | 5.1% | 109 | 20 | 99.5% |
| Panorama City | $377,000 | 10.9% | 68 | -13.9% | 54 | 50.0% | 103 | 39 | 99.6% |
| Pasadena | $745,000 | 18.6% | 121 | -23.4% | 347 | 6.4% | 194 | 20 | 100.8% |
| Santa Monica | $1,415,000 | 7.3% | 69 | -8.0% | 134 | -17.3% | 79 | 17 | 101.0% |
| Sherman Oaks | $800,000 | 8.8% | 250 | 1.2% | 240 | 23.1% | 372 | 34 | 99.8% |
| Silver Lake | $998,000 | 8.5% | 71 | -14.5% | 43 | 30.3% | 92 | 22 | 103.5% |
| South Central LA | $361,000 | 9.1% | 218 | -4.8% | 217 | -11.8% | 361 | 30 | 99.4% |
| South LA | $400,000 | 10.3% | 892 | -2.2% | 843 | -9.1% | 1,395 | 31 | 100.3% |
| South Valley | $565,000 | 7.6% | 1,754 | -4.4% | 1,458 | 16.9% | 2,508 | 34 | 99.7% |
| Studio City | $1,027,500 | 8.2% | 134 | -10.7% | 161 | 22.9% | 224 | 43 | 99.7% |
| Sun Valley | $430,000 | 12.2% | 79 | 16.2% | 57 | 42.5% | 120 | 33 | 99.2% |
| Sylmar | $420,000 | 6.6% | 169 | 1.2% | 99 | 35.6% | 228 | 29 | 100.1% |
| Tarzana | $545,250 | 10.2% | 126 | -13.7% | 121 | 10.0% | 194 | 28 | 99.7% |
| Valley Village | $743,950 | -1.1% | 73 | 30.4% | 47 | 42.4% | 109 | 25 | 100.3% |
| Van Nuys | $475,900 | 22.0% | 97 | 5.4% | 69 | -5.5% | 136 | 42 | 99.5% |
| Venice | $1,640,000 | 16.7% | 115 | -18.4% | 120 | -16.7% | 172 | 35 | 98.4% |
| Watts | $281,625 | 17.3% | 64 | 28.0% | 55 | -15.4% | 107 | 41 | 99.2% |
| West Adams | $584,500 | 23.1% | 40 | 2.6% | 30 | -11.8% | 68 | 27 | 101.9% |
| West Long Beach | $372,500 | 8.0% | 38 | -19.1% | 32 | -11.1% | 58 | 29 | 98.6% |
| West Los Angeles | $1,230,000 | 12.6% | 1,563 | -7.1% | 1,488 | 4.1% | 2,326 | 21 | 100.3% |
| Westwood | $940,000 | 21.7% | 126 | 2.4% | 118 | 3.5% | 182 | 20 | 99.6% |
| Woodland Hills | $700,000 | 7.2% | 239 | -8.4% | 260 | 65.6% | 388 | 34 | 99.0% |
| Los Angeles, CA | $600,000 | 11.1% | 2,436 | -0.6% | 6,240 | 8.2% | 3,634 | 31 | 100.0% |
See Redfin’s data center to find out what’s happening in other cities.
NOTE: Not all neighborhoods are listed, but totals for L.A. encompass entire city. Data is based on listing information and might not reflect all real estate activity in the market. Neighborhood-specific data is measured over the three months ended May 31. Inventory measures listings active as of May 31.
For more information, contact Redfin journalist services
Phone: 206-588-6863
Email: press@redfin.com
Want to receive reports like this every month? Click here to be added to our distribution list.
 United States
 Canada