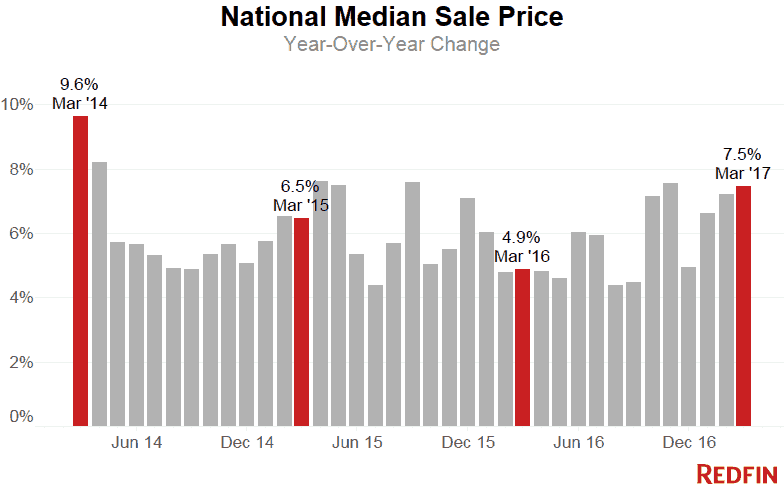
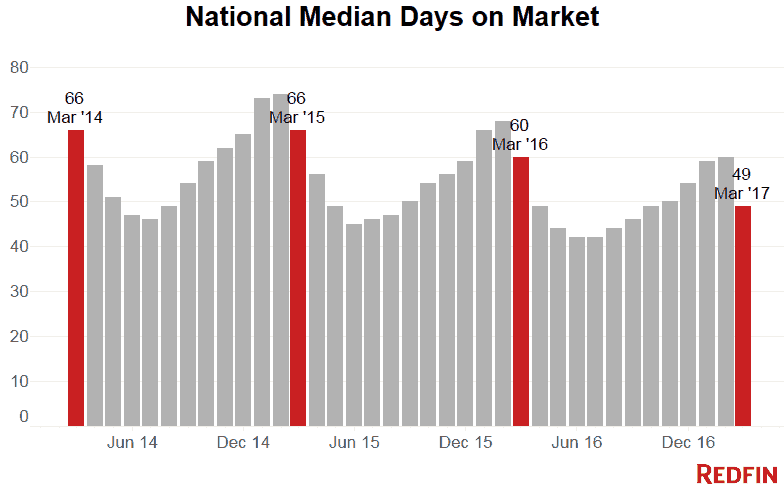
Home prices continued their five-year run of increases in March, up 7.5 percent from last year to a national median sale price of $273,000. Sales growth was also strong, up 8.9 percent, even as the number of homes for sale fell for the 18th consecutive month, down 13 percent Y-O-Y. The typical home went under contract in 49 days, making it the fastest March for home selling on record since Redfin began tracking this data in 2010.
| Market Summary | March 2017 | Month-Over-Month | Year-Over-Year |
|---|---|---|---|
| Median sale price | $273,000 | 4.6% | 7.5% |
| Homes sold | 243,800 | 42.7% | 8.9% |
| New listings | 346,700 | 33.0% | -0.7% |
| All Homes for sale | 707,200 | 3.1% | -13.0% |
| Median days on market | 49 | -11 | -11 |
| Months of supply | 2.9 | -1.1 | -0.7 |
| Sold above list | 21.7% | 2.4% | 1.1% |
| Average Sale-to-list | 93.7% | 0.5% | -0.4% |
Nearly one in five (19.1%) homes that sold in March went under contract within two weeks, and 21.7 percent of homes sold for more than their list price.
“In addition to the laws of supply and demand, today’s open and immediate access to home listing information is really driving the velocity of home sales,” said Redfin Los Angeles real estate agent Alec Traub. “In the past, buyers had to wait for their agent to tell them which homes were for sale. Now, when I meet a client for the first time, they already have a home in mind and I can jump in to guide them on what it will take to win it.”
The overall speed and competition in March was driven primarily by hot markets out West such as Denver, Seattle and California’s Bay Area. Denver tied with Seattle as the fastest market in March, with the typical home going under contract within just eight days in these two cities. This isn’t new for Seattle, where homes were selling at the same pace a year ago, but in Denver homes went under contract 21 days faster this March than they did last year.
Most buyers in the Bay Area paid more than the asking price in March. In San Jose, 69.6 percent of homes sold above list; 66.7 percent sold above list in San Francisco, as did 65.9 percent in Oakland. Despite the competition, home sales increased across all three metros in the region.
As spring 2017 shapes up to be the fastest and most competitive housing market in recent years, we asked Redfin agents what buyers can do to make sure they don’t miss out on the right home once they’re ready to make an offer. Here’s what they had to say:
“As a seller’s agent, the first thing I do when I receive an offer is ask who the lender is. The best offers come from buyers who are pre-approved by a local lender with a strong reputation for speed and reliability. If I’ve worked with the lender before and know they can fund the loan and close on time, I am sure to highlight that for my client.” — Tiffany Aquino, Redfin Agent in Woodbridge, VA
“I’ve seen too many buyers miss out on their first choice because they were unrealistic about what the home would actually sell for in a strong market. If you’ve been pre-approved up to $450,000, you should be shopping for homes listed at or below $400,000 so you have room to escalate in a bidding war” — Kathy Miller, Redfin agent in Seattle, WA
“Most people have heard about the power of including a compelling cover letter along with their offer. These are important and they work, but it’s also important for your agent to make a connection with the listing agent. My clients often win with less-than-perfect offers because I’ve taken the time to earn the listing agent’s trust.” — Lindsay Katz, Redfin agent in Los Angeles, CA
“Offer a free 60-day rent-back up front. Many sellers are attempting to time the sale of their home while also trying to find a replacement home in a competitive market. The easier you make the sellers’ life, the more attractive your offer becomes.” — Adrienne Kieschnick, Redfin agent in Dallas, TX
Read additional creative bidding war strategy ideas from Redfin agents.
Other March Highlights
Competition
- Denver, CO, and Seattle, WA, were the fastest markets, where the typical home was under contract in just eight days. Oakland, CA and San Jose, CA were the next fastest markets with 13 and 14 median days on market respectively.
- The most competitive market in March was San Jose, CA, where 69.6% of homes sold above the asking price, followed by 66.7% in San Francisco, CA, 65.9% in Oakland, CA, 56.6% in Seattle, WA and 44.4% in Tacoma, WA.
Prices
- Grand Rapids, MI had the nation’s highest price growth, rising 16.3% since last year to $162,750. Orlando, FL had the second highest at 15.5% year-over-year price growth, followed by Santa Rosa, CA (15.0%), Seattle, WA (14.5%) and Tampa, FL (14.3%).
- Only four metros actually saw prices decline in March: Birmingham, AL (-3.2%), Baton Rouge, LA (-2.8%), Durham, NC (-1.7%) and San Antonio, TX (-1.5%).
Sales
- 32 out of 90 metros saw sales increase by double digits from last year. Poughkeepsie, NY led the nation in year-over-year sales growth, up 41%, followed by Baltimore, MD, up 40.6%. Camden, NJ rounded out the top three with sales up 31.6% from a year ago.
- Home sales in Buffalo, NY and Provo, UT declined by 23.0% and 14.8%, respectively.
Inventory
- Rochester, NY had the largest inventory decline, falling 39.0% since last March. Buffalo, NY (-34.5%), Rochester, NH (-33.2%), and Portsmouth, NH (-31.4%) also had far fewer homes available on the market than a year ago.
- Fort Myers, FL had the highest increase in the number of homes for sale, up 32.4% year over year, followed by Knoxville, TN (22.3%) and Austin, TX (10.3%).
Below are market-by-market breakdowns for prices, inventory, new listings and sales for markets with populations of 1.5 million or more. For downloadable data on all of the markets Redfin tracks, visit the Redfin Data Center.
Median Sale Price
| Redfin Metro | Median Sale Price | Month-Over-Month | Year-Over-Year |
|---|---|---|---|
| Atlanta, GA | $210,600 | 5.3% | 8.5% |
| Austin, TX | $295,000 | 2.8% | 6.5% |
| Baltimore, MD | $240,000 | 4.8% | 4.3% |
| Boston, MA | $369,000 | 7.0% | 7.4% |
| Charlotte, NC | $225,000 | 10.3% | 13.1% |
| Chicago, IL | $226,000 | 8.7% | 11.8% |
| Cincinnati, OH | $160,000 | 13.4% | 9.2% |
| Cleveland, OH | $127,000 | 5.8% | 12.9% |
| Columbus, OH | $174,900 | 7.8% | 5.1% |
| Dallas-Fort Worth, TX | $250,000 | 1.8% | 11.1% |
| Denver, CO | $370,000 | 4.7% | 8.8% |
| Detroit, MI | $158,000 | 9.0% | 13.7% |
| Edison, NJ | $270,000 | 0.0% | 1.8% |
| Fort Lauderdale, FL | $230,000 | 9.5% | 13.9% |
| Hampton Roads, VA | $212,800 | 1.4% | 3.4% |
| Houston, TX | $225,000 | 1.5% | 6.1% |
| Indianapolis, IN | $159,500 | 3.2% | 4.4% |
| Kansas City, MO | $179,900 | 2.8% | 2.9% |
| Las Vegas, NV | $225,000 | 1.9% | 12.5% |
| Long Island, NY | $385,500 | -3.6% | 4.2% |
| Los Angeles, CA | $551,600 | 2.1% | 6.3% |
| Miami, FL | $270,000 | 1.9% | 12.5% |
| Milwaukee, WI | $190,000 | 17.3% | 9.1% |
| Minneapolis-St. Paul, MN | $238,000 | 8.2% | 8.7% |
| Nashville, TN | $265,000 | 6.0% | 12.8% |
| Oakland, CA | $650,000 | 8.3% | 11.6% |
| Orange County, CA | $648,500 | 4.6% | 7.2% |
| Orlando, FL | $220,000 | 5.8% | 15.5% |
| Philadelphia, PA | $220,000 | 4.8% | 4.8% |
| Phoenix, AZ | $234,500 | 1.1% | 6.6% |
| Pittsburgh, PA | $140,500 | 8.9% | 4.1% |
| Portland, OR | $357,400 | 4.9% | 10.0% |
| Riverside-San Bernardino, CA | $332,000 | 2.8% | 7.1% |
| Sacramento, CA | $345,000 | 2.0% | 4.5% |
| San Antonio, TX | $195,000 | -1.4% | -1.5% |
| San Diego, CA | $520,000 | 3.0% | 7.2% |
| San Francisco, CA | $1,185,000 | 0.0% | 8.2% |
| San Jose, CA | $957,000 | 9.4% | 11.3% |
| Seattle, WA | $484,900 | 6.2% | 14.5% |
| St. Louis, MO | $163,000 | 9.5% | 3.8% |
| Tampa, FL | $200,000 | 3.1% | 14.3% |
| Washington, DC | $375,000 | 4.3% | 7.2% |
| National | $273,000 | 4.6% | 7.5% |
Homes Sold
| Redfin Metro | Homes Sold | Month-Over-Month | Year-Over-Year |
|---|---|---|---|
| Atlanta, GA | 10,273 | 51.1% | 16.2% |
| Austin, TX | 2,535 | 29.9% | -5.4% |
| Baltimore, MD | 4,146 | 64.3% | 40.6% |
| Boston, MA | 4,420 | 44.9% | 2.1% |
| Charlotte, NC | 2,970 | 54.6% | 10.9% |
| Chicago, IL | 10,420 | 57.7% | 23.6% |
| Cincinnati, OH | 2,066 | 50.9% | 15.7% |
| Cleveland, OH | 2,125 | 38.3% | -2.9% |
| Columbus, OH | 2,374 | 29.2% | 9.1% |
| Dallas-Fort Worth, TX | 7,724 | 32.2% | -3.5% |
| Denver, CO | 4,798 | 44.6% | 10.5% |
| Detroit, MI | 5,002 | 32.5% | 9.2% |
| Edison, NJ | 2,661 | 32.7% | 23.7% |
| Fort Lauderdale, FL | 3,397 | 47.8% | 2.7% |
| Hampton Roads, VA | 2,029 | 49.9% | 6.3% |
| Houston, TX | 7,075 | 35.7% | 5.8% |
| Indianapolis, IN | 2,689 | 57.1% | 13.8% |
| Kansas City, MO | 2,794 | 54.8% | 5.7% |
| Las Vegas, NV | 3,893 | 39.4% | 11.6% |
| Long Island, NY | 1,968 | -9.6% | -13.2% |
| Los Angeles, CA | 6,610 | 47.4% | 7.2% |
| Miami, FL | 2,741 | 30.5% | -4.1% |
| Milwaukee, WI | 1,429 | 37.9% | 4.8% |
| Minneapolis-St. Paul, MN | 4,894 | 57.4% | 26.4% |
| Nashville, TN | 3,015 | 38.6% | 5.1% |
| Oakland, CA | 2,216 | 54.5% | 1.0% |
| Orange County, CA | 2,811 | 48.0% | 7.9% |
| Orlando, FL | 4,246 | 30.4% | 18.3% |
| Philadelphia, PA | 4,410 | 56.8% | 27.4% |
| Phoenix, AZ | 9,222 | 42.9% | 13.2% |
| Pittsburgh, PA | 2,051 | 59.9% | 24.0% |
| Portland, OR | 3,260 | 42.6% | -6.8% |
| Riverside-San Bernardino, CA | 5,371 | 43.2% | 9.1% |
| Sacramento, CA | 2,459 | 34.1% | -7.1% |
| San Antonio, TX | 2,197 | 23.6% | -10.4% |
| San Diego, CA | 3,213 | 41.9% | 2.4% |
| San Francisco, CA | 1,115 | 62.3% | 5.4% |
| San Jose, CA | 1,266 | 54.4% | 4.7% |
| Seattle, WA | 3,804 | 36.4% | -1.1% |
| St. Louis, MO | 3,475 | 54.2% | 27.2% |
| Tampa, FL | 6,425 | 58.5% | 18.5% |
| Washington, DC | 7,888 | 47.5% | 22.6% |
| National | 243,800 | 42.7% | 8.9% |
New Listings
| Redfin Metro | New Listings | Month-Over-Month | Year-Over-Year |
|---|---|---|---|
| Atlanta, GA | 13,470 | 40.0% | 2.2% |
| Austin, TX | 4,220 | 43.4% | 12.4% |
| Baltimore, MD | 5,639 | 52.9% | -0.8% |
| Boston, MA | 7,989 | 72.4% | -11.9% |
| Charlotte, NC | 3,979 | 28.9% | 2.1% |
| Chicago, IL | 16,624 | 26.4% | -4.7% |
| Cincinnati, OH | 2,832 | 29.1% | -8.6% |
| Cleveland, OH | 3,345 | 36.2% | -2.5% |
| Columbus, OH | 3,078 | 34.9% | 1.4% |
| Dallas-Fort Worth, TX | 11,089 | 32.5% | 7.0% |
| Denver, CO | 6,183 | 45.0% | 13.1% |
| Detroit, MI | 6,596 | 30.8% | -2.0% |
| Edison, NJ | 4,671 | 24.6% | -5.9% |
| Fort Lauderdale, FL | 4,656 | 15.0% | -3.9% |
| Hampton Roads, VA | 3,053 | 41.9% | 6.6% |
| Houston, TX | 11,197 | 30.0% | 8.8% |
| Indianapolis, IN | 3,480 | 42.3% | 1.8% |
| Kansas City, MO | 3,991 | 36.4% | 1.1% |
| Las Vegas, NV | 4,618 | 25.6% | -0.4% |
| Long Island, NY | 3,799 | 28.4% | -6.7% |
| Los Angeles, CA | 8,847 | 35.2% | 1.0% |
| Miami, FL | 5,045 | 21.1% | 5.1% |
| Milwaukee, WI | 2,339 | 42.4% | -2.7% |
| Minneapolis-St. Paul, MN | 7,467 | 51.5% | 2.1% |
| Nashville, TN | 4,037 | 30.2% | 1.5% |
| Oakland, CA | 2,986 | 38.6% | -1.7% |
| Orange County, CA | 3,890 | 37.7% | 1.1% |
| Orlando, FL | 4,961 | 17.4% | 3.7% |
| Philadelphia, PA | 6,581 | 27.9% | -9.3% |
| Phoenix, AZ | 10,865 | 19.6% | 6.1% |
| Pittsburgh, PA | 2,619 | 38.6% | 2.4% |
| Portland, OR | 4,212 | 43.9% | -2.2% |
| Riverside-San Bernardino, CA | 6,674 | 23.0% | 1.1% |
| Sacramento, CA | 3,505 | 51.0% | -3.9% |
| San Antonio, TX | 3,373 | 34.8% | -5.0% |
| San Diego, CA | 4,169 | 31.0% | -2.7% |
| San Francisco, CA | 1,587 | 42.2% | -0.1% |
| San Jose, CA | 1,774 | 44.7% | -10.2% |
| Seattle, WA | 4,941 | 50.4% | -5.2% |
| St. Louis, MO | 5,274 | 35.1% | 5.6% |
| Tampa, FL | 6,999 | 19.8% | 5.4% |
| Washington, DC | 12,322 | 50.0% | -2.1% |
| National | 346,700 | 33.0% | -0.7% |
All Homes for Sale
| Redfin Metro | All Homes for Sale | Month-Over-Month | Year-Over-Year |
|---|---|---|---|
| Atlanta, GA | 31,864 | 17.4% | -2.6% |
| Austin, TX | 6,232 | 10.8% | 10.3% |
| Baltimore, MD | 9,327 | 3.4% | -21.4% |
| Boston, MA | 9,216 | 6.5% | -29.2% |
| Charlotte, NC | 9,670 | 9.8% | -7.5% |
| Chicago, IL | 40,774 | 7.2% | -13.3% |
| Cincinnati, OH | 7,729 | 7.0% | -18.2% |
| Cleveland, OH | 8,294 | 2.5% | -19.4% |
| Columbus, OH | 6,051 | 5.5% | -13.3% |
| Dallas-Fort Worth, TX | 15,258 | 1.4% | -8.8% |
| Denver, CO | 5,103 | 16.2% | -7.2% |
| Detroit, MI | 9,782 | -5.7% | -27.0% |
| Edison, NJ | 12,215 | -0.3% | -16.6% |
| Fort Lauderdale, FL | 13,723 | -2.2% | -14.2% |
| Hampton Roads, VA | 7,472 | 3.9% | -11.0% |
| Houston, TX | 23,328 | 3.3% | -1.1% |
| Indianapolis, IN | 6,266 | 2.1% | -21.8% |
| Las Vegas, NV | 11,077 | 1.0% | -23.3% |
| Long Island, NY | 10,363 | 4.5% | -22.0% |
| Los Angeles, CA | 14,597 | 0.0% | -3.9% |
| Miami, FL | 18,054 | -1.6% | -3.4% |
| Milwaukee, WI | 5,874 | 11.4% | -14.7% |
| Minneapolis-St. Paul, MN | 10,000 | 12.8% | -15.3% |
| Nashville, TN | 8,598 | 5.8% | 7.0% |
| Oakland, CA | 2,282 | 7.9% | -12.7% |
| Orange County, CA | 6,789 | 7.1% | -4.8% |
| Orlando, FL | 9,343 | -5.5% | -25.8% |
| Philadelphia, PA | 14,294 | 6.5% | -19.4% |
| Phoenix, AZ | 22,119 | -0.5% | -13.8% |
| Pittsburgh, PA | 9,153 | 5.0% | -13.6% |
| Portland, OR | 4,300 | 1.7% | -7.7% |
| Riverside-San Bernardino, CA | 14,892 | -3.4% | -8.2% |
| Sacramento, CA | 3,677 | 4.0% | -23.3% |
| San Antonio, TX | 6,969 | 1.3% | -13.3% |
| San Diego, CA | 4,788 | 0.2% | -26.7% |
| San Francisco, CA | 1,871 | 10.6% | -4.2% |
| San Jose, CA | 1,470 | 12.7% | -25.9% |
| Seattle, WA | 3,024 | 8.5% | -31.2% |
| St. Louis, MO | 11,532 | 1.6% | -7.6% |
| Tampa, FL | 12,642 | -5.6% | -25.8% |
| Washington, DC | 15,002 | 9.9% | -19.9% |
| National | 707,200 | 3.1% | -13.0% |
 United States
 Canada