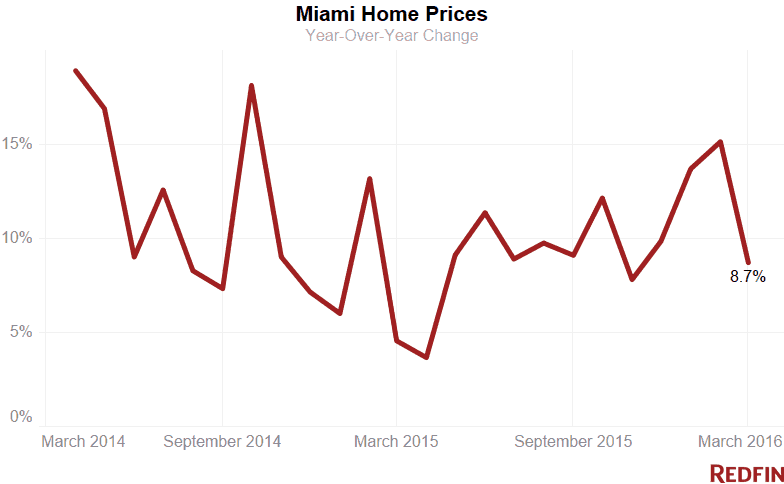
Miami home prices rose 8.7 percent in March from a year ago to a median $250,000, retreating from their double-digit growth earlier this year. While single-family houses continued to fetch a premium, condominium prices plunged.
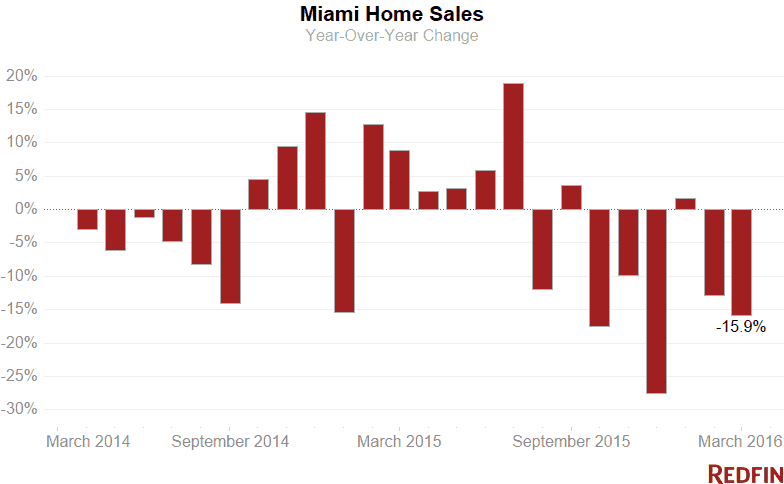
Sales of both condo and single-family homes slowed, sending total transactions down nearly 16 percent.
Buyers had 3 percent fewer properties to choose from in March compared to last year, resulting in a 6.3-month supply of homes for sale, down from February’s 7.8-month supply. Six months typically signals a balanced market between buyers and sellers.
The number of new homes hitting the market rose less than 1 percent, a far cry from February’s 14 percent year-over-year increase.
Single Family Still In Demand
Single-family home prices rose 15.6 percent in March to $299,900, the highest they’ve been in more than six years.
Sales dropped 5.7 percent in March, the sixth consecutive month of year-over-year declines.
The total number of single-family homes for sale dropped by 11 percent in March, resulting in just a 4.4-month supply of homes for sale, the lowest since July 2015.
“Growing prices in the single-family home market hit first-time homebuyers especially hard, as most do not have the down payment to compete in multiple-offer situations,” Redfin real estate agent Aaron Drucker said. “However, if you already own a home in Miami and have equity, you’re in a much better position to take advantage of the hot single-family home market by selling and then using the proceeds to trade up.”
Condo Glut Weighs on Prices
Miami condo prices fell to a median $169,000 in March, down 19.5 percent from a year ago, as sales plummeted 26 percent.
More condos sat on the market, leading to a 10-month supply. Fewer new units came up for sale, a sign that beachfront and luxury builders might be holding units off the market until demand picks up.
“With the strengthened U.S. dollar, international buyers are reluctant to keep purchasing luxury condos at 50 percent down, so some developers are holding off on new projects,” Drucker said.
“That said, other developers were able to sell the majority of their units at the beginning of the cycle, giving them access to credit if necessary,” he said. “That means they’re not desperate yet and can continue to demand 50 percent deposits.”
Hot Neighborhoods
Prices in Little Haiti rose 33.3 percent to a median $180,000. In Hialeah, they were up 26.7 percent, to $190,000. Northeast Coconut Grove saw a 25.3 percent increase, to $620,000.
South Point had some of the most expensive transactions in March, reaching a median sale price of $990,000. South Point also had 44.8 percent more homes on the market in March than a year ago.
Home sales in Brickell, a community heavy with luxury condos, plunged 31.3 percent in March. A typical home in Brickell sold for $365,000, 6.4 percent less than a year ago.
The number of homes for sale in the Upper Eastside more than doubled, driven by properties newly listed for sale.
Homes in Wynwood-Edgewater spent 38 fewer days on the market than they did a year ago. The median home sold for $325,000.
Here’s what’s happening in your neighborhood:
| Place | Median Sale Price | Year-Over-Year | Homes Sold | Year-Over-Year | Inventory | Year-Over-Year | New Listings | Median Days on Market | Avg Sale-to-List |
|---|---|---|---|---|---|---|---|---|---|
| Andover | $185,912 | 56.0% | 2 | 0.0% | 3 | 50.0% | 2 | 44 | 85.0% |
| Aventura | $347,500 | 12.5% | 64 | -32.6% | 398 | 17.8% | 220 | 95 | 94.2% |
| Bal Harbour | $545,000 | -41.4% | 15 | -11.8% | 176 | 20.5% | 33 | 124 | 91.2% |
| Bay Harbor Islands | $275,000 | -15.7% | 9 | -43.8% | 140 | 44.3% | 28 | 116 | 95.7% |
| Bay Point | $770,000 | -58.4% | 7 | 75.0% | 30 | 76.5% | 17 | 119 | 94.3% |
| Bayshore | $1,155,000 | 56.1% | 18 | -41.9% | 144 | 54.8% | 73 | 156 | 92.6% |
| Biscayne Park | $390,000 | -24.8% | 5 | -16.7% | 28 | 47.4% | 12 | 54 | 95.3% |
| Biscayne Point | $810,000 | 107.7% | 15 | -31.8% | 46 | 15.0% | 24 | 115 | 94.4% |
| Brentwood | $180,000 | 49.4% | 3 | 0.0% | 2 | -66.7% | 3 | 35 | 94.9% |
| Brickell | $365,000 | -6.4% | 169 | -31.3% | 1,373 | 21.9% | 687 | 161 | 95.5% |
| Coral Gables | $529,750 | -10.0% | 82 | 13.9% | 568 | 7.0% | 165 | 101 | 94.6% |
| Coral Way | $350,000 | 11.1% | 145 | -13.2% | 370 | -9.1% | 302 | 67 | 95.9% |
| Cutler Bay | $226,000 | 20.9% | 81 | -22.9% | 225 | -40.8% | 103 | 59 | 98.1% |
| Doral | $254,000 | -12.4% | 70 | -17.6% | 807 | 18.0% | 194 | 99 | 96.3% |
| Downtown | $380,000 | -8.4% | 109 | -18.7% | 784 | 18.4% | 374 | 167 | 93.8% |
| Eastern Shores | $150,500 | -5.5% | 19 | -26.9% | 112 | 6.7% | 70 | 123 | 93.3% |
| El Portal | $537,500 | 66.7% | 2 | 0.0% | 23 | 27.8% | 9 | 78 | 95.8% |
| Fisher Island | $6,175,000 | 87.1% | 2 | -33.3% | 71 | 44.9% | 8 | 252 | 84.5% |
| Flamingo-Lummus | $225,000 | 15.4% | 113 | 8.6% | 445 | 5.0% | 271 | 118 | 94.6% |
| Hialeah | $190,000 | 26.7% | 108 | -17.6% | 125 | -25.6% | 188 | 42 | 98.3% |
| Highland Village | $92,877.5 | 33.6% | 2 | -33.3% | 2 | 100.0% | 2 | 9.5 | 105.0% |
| Homestead | $171,500 | 31.9% | 211 | 6.0% | 688 | -30.9% | 302 | 45 | 97.5% |
| Kendall | $235,000 | 0.0% | 93 | -8.8% | 348 | -24.8% | 136 | 49 | 95.3% |
| Key Biscayne | $1,225,000 | -23.4% | 20 | -42.9% | 290 | 27.8% | 64 | 83 | 92.2% |
| Keystone Point | $1,155,000 | 62.2% | 12 | -14.3% | 45 | 45.2% | 28 | 122 | 93.0% |
| La Gorce | $1,700,000 | -17.1% | 15 | -11.8% | 97 | 47.0% | 50 | 221 | 89.0% |
| Lakewood Estates | $196,000 | 88.5% | 4 | 300.0% | NA | NA | 1 | 70 | 98.5% |
| Little Haiti | $180,000 | 33.3% | 43 | -17.3% | 117 | 24.5% | 108 | 44 | 91.1% |
| Little Havana | $147,499.5 | -7.8% | 40 | -16.7% | 95 | -10.4% | 94 | 32.5 | 96.0% |
| Miami Lakes | $312,500 | 7.0% | 38 | -7.3% | 73 | -28.4% | 94 | 59 | 96.6% |
| Miami Shores | $372,250 | 1.4% | 4 | -42.9% | 17 | 21.4% | 13 | 60 | 97.8% |
| Miami Springs | $333,000 | 5.7% | 10 | -16.7% | 48 | 14.3% | 12 | 140 | 90.1% |
| New Belle Meade | $320,000 | -39.3% | 17 | -10.5% | 51 | 50.0% | 42 | 72 | 93.7% |
| Normandy Isle | $200,000 | -20.0% | 22 | -37.1% | 78 | 4.0% | 65 | 73 | 95.5% |
| North Bay Village | $230,000 | -23.1% | 19 | 26.7% | 210 | 17.3% | 45 | 123 | 93.8% |
| North Shore | $280,500 | -11.6% | 65 | -32.3% | 322 | 24.3% | 200 | 91 | 96.7% |
| Northeast Coconut Grove | $620,000 | 25.2% | 80 | -10.1% | 221 | 18.2% | 180 | 71.5 | 94.6% |
| Overtown | $176,000 | 125.5% | 5 | -58.3% | 15 | -42.3% | 14 | 116 | 92.6% |
| Palm Island | $5,580,000 | 13.9% | 1 | -50.0% | 23 | 64.3% | 8 | 56 | 86.5% |
| Palmetto Bay | $515,000 | 14.6% | 27 | -35.7% | 147 | 2.8% | 37 | 79 | 96.6% |
| Pinecrest | $1,050,000 | 39.6% | 17 | -34.6% | 194 | 15.5% | 48 | 66 | 97.0% |
| South Miami | $1,260,000 | 89.1% | 11 | -15.4% | 36 | 56.5% | 30 | 101 | 97.1% |
| South Point | $990,000 | 11.9% | 68 | 1.5% | 317 | 44.8% | 175 | 113 | 93.6% |
| Southwest Coconut Grove | $870,000 | 8.8% | 28 | -9.7% | 118 | 5.4% | 75 | 79 | 93.8% |
| Sunny Isles Beach | $382,500 | 6.2% | 58 | -34.8% | 1,208 | 40.6% | 211 | 113 | 93.7% |
| Sweetwater | $152,000 | -4.1% | 5 | -37.5% | 12 | 20.0% | 12 | 161 | 89.0% |
| The Roads | $411,250 | -2.1% | 18 | 38.5% | 44 | -24.1% | 46 | 45 | 94.6% |
| Upper Eastside | $370,000 | 8.8% | 48 | -23.8% | 231 | 104.4% | 169 | 72 | 94.5% |
| Venetian Islands | $592,000 | -31.2% | 15 | -53.1% | 98 | 27.3% | 36 | 65 | 92.8% |
| West Avenue | $315,000 | -14.9% | 71 | -12.3% | 300 | 13.2% | 172 | 109.5 | 94.1% |
| West Flagler | $254,000 | 16.1% | 61 | 5.2% | 103 | -19.5% | 116 | 48 | 96.1% |
| West Miami | $377,500 | NA | 4 | NA | 17 | NA | 8 | 130 | 95.3% |
| Wynwood-Edgewater | $325,000 | -9.7% | 86 | -26.5% | 598 | 48.0% | 339 | 92.5 | 94.6% |
| Miami, FL | $250,000 | 8.7% | 1,254 | -15.9% | 7,933 | -3.0% | 2,362 | 62 | 97.0% |
NOTE: Not all neighborhoods are listed, but totals for Miami encompass the entire city. Data is based on listing information and might not reflect all real estate activity in the market. Neighborhood-specific data is measured over a three-month span that ended March 31. City-specific data is measured over a one-month span that also ended March 31.
For more information, contact Redfin journalist services:
Phone: 206-588-6863
Email: press@redfin.com
See Redfin’s data center to find out what’s happening in other cities.
To be added to Redfin’s press release distribution list, please click here.
 United States
 Canada