The median home sale price increased 7.3 percent from a year ago to $298,000 in June. This is the highest national median sale price recorded since we began keeping track in 2010. Despite record-high buyer demand during the busy spring market, sales only increased 1.9 percent compared to last year, constrained by a low supply of homes on the market.
Market Summary
June 2017
Month-Over-Month
Year-Over-Year
Median sale price
$297,600
3.5%
7.3%
Homes sold
308,800
7.2%
1.9%
New listings
352,500
-2.7%
0.0%
All Homes for sale
786,000
1.6%
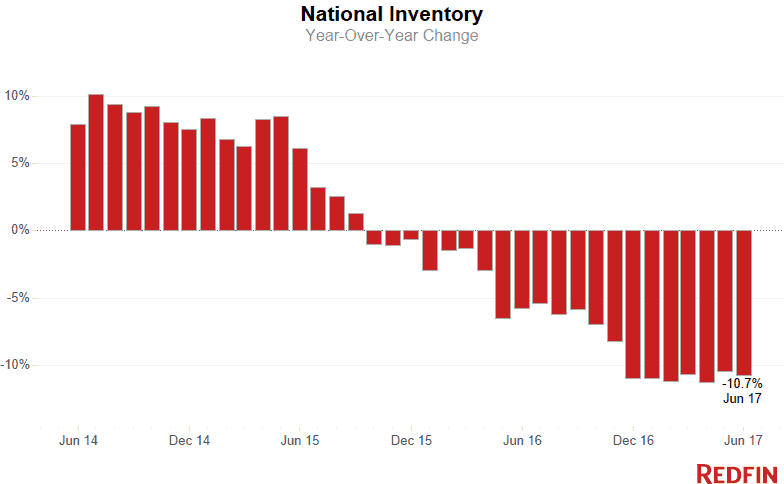
-10.7%
Median days on market
36
-1
-6
Months of supply
2.5
-0.2
-0.4
Sold above list
26.6%
0.6%
2.4%
Average Sale-to-list
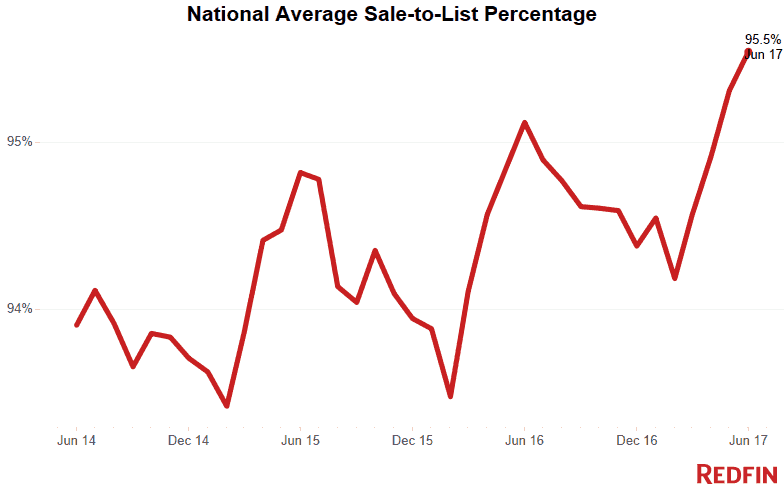
95.5%
0.2%
0.4%
The number of homes for sale fell 10.7 percent, marking seven straight months of double-digit, year-over-year declines. Compared with a year earlier, there was no change in the number of homes newly listed for sale in June. June had a 2.5-month supply of homes–the lowest Redfin has recorded since we began tracking the market in 2010–well below the six months that represents a market balanced between buyers and sellers. San Jose and Seattle each had less than a one-month supply of homes. Every record in market speed and competition that was set in May was broken again in June. The typical home that sold in June went under contract in 36 days, one day faster than in May, setting a new record-fast pace for home sales. Denver, Portland and Seattle were the fastest-moving markets, with the typical home in each market finding a buyer in just seven days.
More than a quarter (26.6%) of homes sold above their list price, the highest percentage Redfin has recorded. The average sale-to-list price ratio hit a record high of 95.5 percent in June.
“This market is unlike any we’ve ever seen before,” said Redfin chief economist Nela Richardson. “Month after month, new records are set for the pace at which homes are going under contract. Demand continues to swell while supply troughs. For buyers competing in this market, it’s survival of the fittest. The strongest offers that are most likely to close quickly and smoothly rise to the top of the pile.”
The most competitive market in June was San Jose, CA where 73.7% of homes sold above list price, followed by 70.6% in San Francisco, CA, 69.8% in Oakland, CA, 62.3% in Seattle, WA, and 52.6% in Tacoma, WA.
Prices
Fort Lauderdale, FL had the nation’s highest growth in home prices, rising 15.6% since last year to $260,000, followed by Nashville, TN (14%), Seattle, WA (13.5%), Tacoma, WA (12.2%), and Deltona, FL (12.1%).
Two metros saw price declines in June: Greensboro, NC (-1.2%), and Tulsa, OK (-0.3%).
Sales
Ten out of 89 metros saw sales surge by double digits from last year. Poughkeepsie, NY led the nation in year-over-year sales growth, up 42.6%, followed by Camden, NJ, up 23.1%. Lakeland, FL rounded out the top three with sales up 16.3% from a year ago.
Buffalo, NY saw the largest decline in sales since last year, falling 26.9%. Home sales in Rochester, NY and Fort Lauderdale, FL declined by 21.2% and 15.5%, respectively.
Inventory
San Jose, CA had the largest decrease in overall inventory, falling 42.2% since last June. Rochester, NY (-29.7%), San Francisco, CA (-26.6%), and Tampa, FL (-26.5%) also saw far fewer homes available on the market than a year ago.
Three metros in Utah saw the highest increases in the number of homes for sale. Ogden, UT had the highest increase in inventory, up 40.5% year over year, followed by Provo, UT (36.7%) and Salt Lake City, UT (30.1%).
Below are market-by-market breakdowns for prices, inventory, new listings and sales for markets with populations of 1.5 million or more. For downloadable data on all of the markets Redfin tracks, visit theRedfin Data Center.
Alina is on the communications and PR team at Redfin. She helps consumers and the media understand what's going on in the housing market, the real estate industry and inside Redfin.
 United States
 Canada