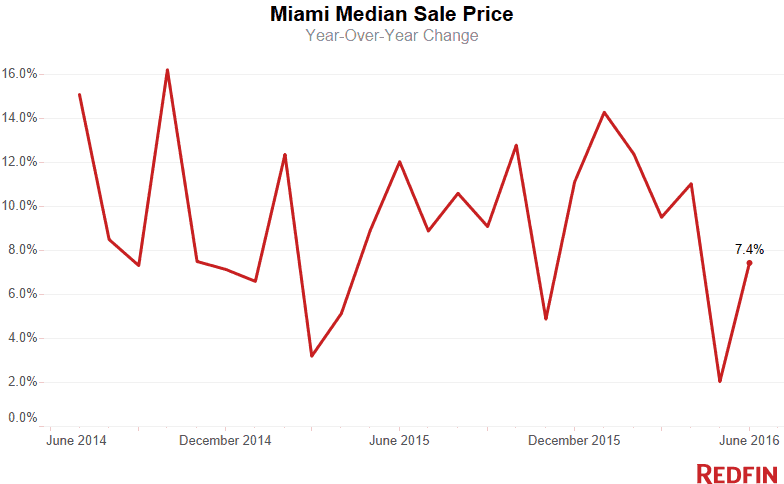
Last month Miami homes hit their highest prices since at least February 2010, when Redfin began tracking the numbers; the median sale price was $260,000, up 7.4 percent in June. Median sale prices in Miami have seen year-over-year increases every month since July 2011.
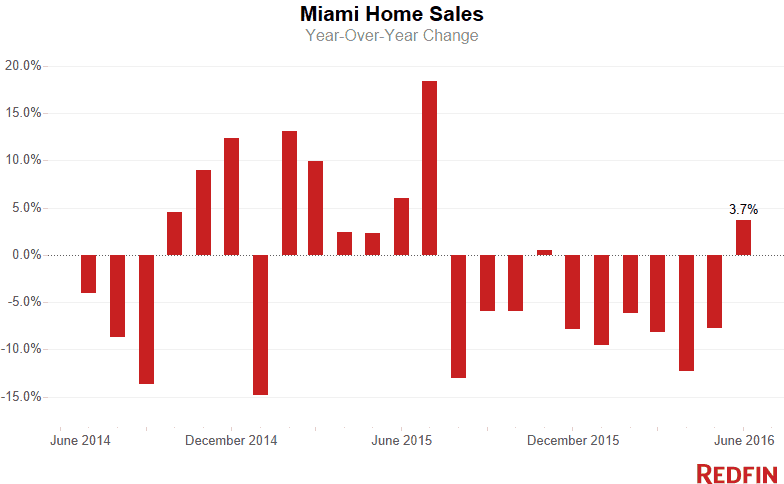
Miami home sales rose 3.7 percent, posting the first year-over-year increase since November.
The number of new homes hitting the market increased by just 0.2 percent, and the total number of homes for sale dropped 1.5 percent. Homes found buyers 16 days faster than last year, spending a median 51 days on the market in June.
Condos
The median sale price for Miami condos was $176,500 in June, down 1.9 percent year over year. This was the fourth-straight month of year-over-year price declines in the condo market. Condo sales, on the other hand, rose 3.3 percent, posting the first year-over-year increase in seven months.
What is accounting for the sudden upswing in condo sales after a long period of consistent declines? According to Redfin agent Aaron Drucker, all-time low mortgage rates are a major factor for many Miami buyers.
“One of my recent buyers hadn’t planned to purchase a new home quite yet, but since interest rates are still so low, just 3.5 percent, he decided speed up his homebuying timeline and lock in the low rates now while they’re so favorable,” Drucker said.
There have been other recent financial incentives for Miami buyers, too. According to Drucker, some lenders are dramatically lowering their down payment requirements if their underwriting department pre-approves the building. As opposed to the typical 25 percent requirement, some lenders will now accept just 10 percent down for buyers who intend to use the condo as their primary residence, and 15 percent for buyers purchasing it as a second home.
“Long-term, consistent price growth has made lenders more confident in the overall market, so they are comfortable utilizing these non-traditional mortgage products for some properties as a way to generate more sales and spur activity,” said Drucker.
The number of new condos for sale increased by 4.2 percent, contributing to an overall inventory increase of 6.9 percent. Condos spent a median 71 days on the market, 11 days faster than a year ago. There was a 7.7-month supply of condos for sale in June, favoring buyers.
Single-Family Homes
Single-family home prices continued to increase, up 12.3 percent in June to a median $320,000. Prices in this sector have shown year-over-year increases every month since December 2014, and that was the only price decline since October 2011. Single-family home sales rose 8 percent, posting the largest year-over-year jump since last June.
There were 2.8 percent fewer new single-family residences on the market in June, and 8 percent fewer single-family residences in total. The total number of single-family homes for sale has shown consistent year-over-year declines since March 2015, and Redfin agents note that buyer demand has outweighed supply.
Single-family homes sold 19 days faster than a year ago, staying on the market for a median 44 days in total. There is only a 3.3-month supply of single-family homes for sale, which is far less than the six months that signals a balanced market between buyers and sellers.
Neighborhood Trends
Pinecrest fetched some of the highest prices in June, with a median sale price of $985,000. Little Havana was among Miami’s more affordable neighborhoods with a median sale price of just $166,300 in June.
Sale prices in Homestead increased 42.9 percent in June from a year prior, reaching a median $200,000. In North Shore, the typical home sold for $249,000, 27.3 percent less than a year ago.
The price-per-square-foot for a home in South Point was $709.97 in June. Even though home prices in Homestead increased dramatically from a year ago, buyers got a lot of bang for their buck: the price-per-square-foot in that neighborhood still sits at a reasonable $110.56.
| Place | Median Sale Price | Year-Over-Year | Homes Sold | Year-Over-Year | Inventory | Year-Over-Year | New Listings | Median Days on Market | Avg Sale-to-List |
|---|---|---|---|---|---|---|---|---|---|
| Andover | $219,500 | 66.3% | 4 | 300.0% | NA | NA | 6 | 36 | 94.7% |
| Aventura | $316,950 | 2.9% | 302 | -11.9% | 1,348 | 19.6% | 709 | 139 | 93.3% |
| Bal Harbour | $662,500 | -12.8% | 10 | 0.0% | 190 | 43.9% | 24 | 92 | 89.3% |
| Bay Harbor Islands | $325,000 | 1.6% | 13 | -13.3% | 151 | 59.0% | 28 | 113 | 93.5% |
| Bay Point | $1,980,650 | -26.9% | 2 | 0.0% | 15 | 25.0% | 7 | 444 | 85.0% |
| Bayshore | $1,200,000 | 37.9% | 24 | -42.9% | 128 | 42.2% | 49 | 246 | 91.6% |
| Beach Plaza | $107,800 | NA | 1 | NA | NA | NA | NA | 16 | 138.2% |
| Biscayne Park | $389,000 | -12.3% | 1 | -83.3% | 30 | 30.4% | 9 | 5 | 100.0% |
| Biscayne Point | $441,500 | 2.7% | 26 | -3.7% | 65 | 0.0% | 35 | 95 | 93.9% |
| Brentwood | $202,000 | 44.3% | 5 | 0.0% | 2 | -75.0% | 9 | 8 | 101.8% |
| Brickell | $375,000 | -12.4% | 213 | -30.2% | 1,416 | 6.6% | 658 | 137 | 94.2% |
| Coral Gables | $710,000 | 14.5% | 101 | -1.9% | 589 | 10.9% | 119 | 70 | 95.9% |
| Coral Way | $375,000 | 17.2% | 202 | -10.6% | 407 | -11.1% | 329 | 76 | 96.0% |
| Cutler Bay | $225,000 | -1.1% | 101 | 1.0% | 224 | -31.1% | 110 | 44 | 97.2% |
| Doral | $305,000 | 13.0% | 79 | -9.2% | 857 | 25.5% | 175 | 69 | 96.8% |
| Downtown | $391,000 | 4.3% | 126 | -16.6% | 792 | 13.3% | 358 | 147 | 94.4% |
| Eastern Shores | $177,000 | 16.4% | 31 | -16.2% | 117 | 41.0% | 67 | 90 | 94.9% |
| El Portal | $435,000 | 18.1% | 4 | -33.3% | 22 | 120.0% | 6 | 31 | 97.8% |
| Flamingo-Lummus | $247,500 | 15.1% | 106 | -28.9% | 460 | 8.5% | 241 | 108 | 95.1% |
| Hialeah | $180,000 | 16.9% | 325 | -7.4% | 243 | -36.2% | 368 | 30 | 98.0% |
| Highland Village | $73,000 | 82.5% | 2 | 100.0% | NA | NA | 1 | 55 | 97.9% |
| Homestead | $200,000 | 42.9% | 241 | 5.2% | 603 | -29.0% | 269 | 37 | 97.3% |
| Kendall | $306,000 | 16.1% | 131 | 4.0% | 340 | -17.9% | 143 | 38 | 96.5% |
| Key Biscayne | $773,750 | -38.7% | 24 | -31.4% | 299 | 45.1% | 42 | 91 | 94.7% |
| Keystone Point | $980,000 | 34.3% | 13 | -27.8% | 56 | 43.6% | 27 | 99 | 91.1% |
| La Gorce | $1,950,000 | 35.6% | 9 | -59.1% | 91 | 71.7% | 29 | 186 | 89.9% |
| Lakewood Estates | $210,000 | NA | 1 | NA | NA | NA | 1 | 7 | 105.1% |
| Little Haiti | $215,000 | 26.5% | 45 | -27.4% | 126 | 41.6% | 88 | 48 | 94.3% |
| Little Havana | $166,300 | 5.2% | 49 | 11.4% | 91 | -16.5% | 66 | 54 | 95.1% |
| Miami Lakes | $335,100 | 18.1% | 91 | -17.3% | 113 | -1.7% | 120 | 51 | 97.1% |
| Miami Shores | $400,000 | 11.1% | 93 | -19.1% | 146 | 5.0% | 117 | 70 | 95.9% |
| Miami Springs | $370,000 | 10.4% | 11 | 22.2% | 50 | -2.0% | 15 | 89 | 95.3% |
| New Belle Meade | $574,500 | -68.4% | 2 | 0.0% | 2 | -33.3% | 2 | 85 | 98.4% |
| Normandy Isle | $207,000 | -33.2% | 25 | -28.6% | 73 | 19.7% | 33 | 74 | 94.6% |
| North Bay Village | $230,000 | -2.1% | 17 | -43.3% | 238 | 51.6% | 45 | 116 | 94.6% |
| North Shore | $249,000 | -27.3% | 77 | -31.2% | 312 | 23.8% | 150 | 112 | 94.7% |
| Northeast Coconut Grove | $642,500 | -1.2% | 158 | -2.5% | 379 | 30.7% | 260 | 74 | 94.3% |
| Overtown | $152,000 | 24.1% | 8 | -20.0% | 16 | -27.3% | 15 | 55 | 97.2% |
| Palm Island | $5,360,000 | -4.3% | 4 | 100.0% | 21 | 61.5% | 3 | 449 | 85.5% |
| Palmetto Bay | $496,000 | 0.7% | 39 | -2.5% | 182 | 26.4% | 55 | 46 | 95.5% |
| Pinecrest | $985,000 | 2.6% | 41 | 46.4% | 224 | 32.5% | 37 | 75 | 94.6% |
| South Miami | $420,000 | -2.0% | 71 | 18.3% | 74 | -12.9% | 68 | 48 | 95.0% |
| South Point | $768,750 | -6.8% | 72 | 4.3% | 311 | 52.4% | 138 | 150 | 92.8% |
| Southwest Coconut Grove | $635,000 | -12.9% | 61 | 10.9% | 133 | 16.7% | 85 | 97 | 93.2% |
| Sunny Isles Beach | $462,500 | 26.5% | 46 | -50.0% | 1,218 | 49.8% | 149 | 174 | 93.6% |
| Sweetwater | $167,500 | -39.1% | 10 | 100.0% | 15 | -28.6% | 9 | 14 | 96.3% |
| The Roads | $465,000 | 12.0% | 35 | 59.1% | 45 | -25.0% | 53 | 53 | 93.5% |
| Upper Eastside | $443,500 | 15.3% | 72 | -2.7% | 241 | 102.5% | 123 | 67 | 95.5% |
| Venetian Islands | $828,750 | -10.0% | 28 | 27.3% | 88 | 33.3% | 40 | 161 | 89.5% |
| West Avenue | $268,500 | -11.2% | 66 | -36.5% | 293 | 17.7% | 139 | 110 | 93.4% |
| West Flagler | $256,000 | 16.4% | 78 | -10.3% | 86 | -31.2% | 89 | 53 | 94.6% |
| West Miami | $305,927 | 1.3% | 4 | 0.0% | 16 | 6.7% | 5 | 11 | 119.5% |
| Wynwood-Edgewater | $370,000 | 1.4% | 105 | -14.6% | 613 | 48.4% | 261 | 103 | 95.5% |
| Miami, FL | $260,000 | 7.4% | 1,638 | 3.7% | 7,865 | -1.5% | 2,203 | 51 | 96.7% |
NOTE: Not all neighborhoods are listed, but totals for Miami encompass the entire city. Data is based on listing information and might not reflect all real estate activity in the market. Neighborhood-specific data is measured over a three-month span that ended June 30. City-specific data is measured over a one-month span that also ended June 30.
For more information, contact Redfin journalist services:
Phone: 206-588-6863
Email: press@redfin.com
See Redfin’s data center to find out what’s happening in other cities.
To be added to Redfin’s press release distribution list, please click here.
 United States
 Canada