Sales of new homes in all four major US regions dropped in the last two months of 2018. The year-over-year trend was especially drastic in the Northeast, where new-home sales fell by 16.1 percent in December.
Here’s a look at the annual drop in single-family new-home sales (seasonally adjusted) across the country in the final two months of last year:
| Region | Nov. 2018 | Dec. 2018 |
| Midwest | -2% | -13.4% |
| Northeast | -12.3% | -16.1% |
| South | -2.9% | -10.3% |
| West | -8.6% | -13.4% |
| National | -4.6% | -11.6% |
Of all four regions, sales of new homes has been in negative territory the longest in the Northeast. That region hasn’t experienced growth since January 2017, according to Redfin data.
“All around the country homebuyers were backing off at the end of last year due to high prices and high mortgage interest rates, and 2018 tax reform made it even more expensive to buy high-priced homes in high-tax states like Massachusetts, Connecticut and New York. New homes tend to be pricier than existing homes, which is one reason sales of new homes dropped off so much in the Northeast,” said Redfin chief economist Daryl Fairweather.
Sales of new homes could pick up in the coming months. Builder confidence is up two points to 58 this month, thanks in part to the recent decline in mortgage rates and continued job growth. Another factor that could contribute to an increase in new-home sales is a decline in the cost of building materials. The price of materials came down 1.8 percent in December.
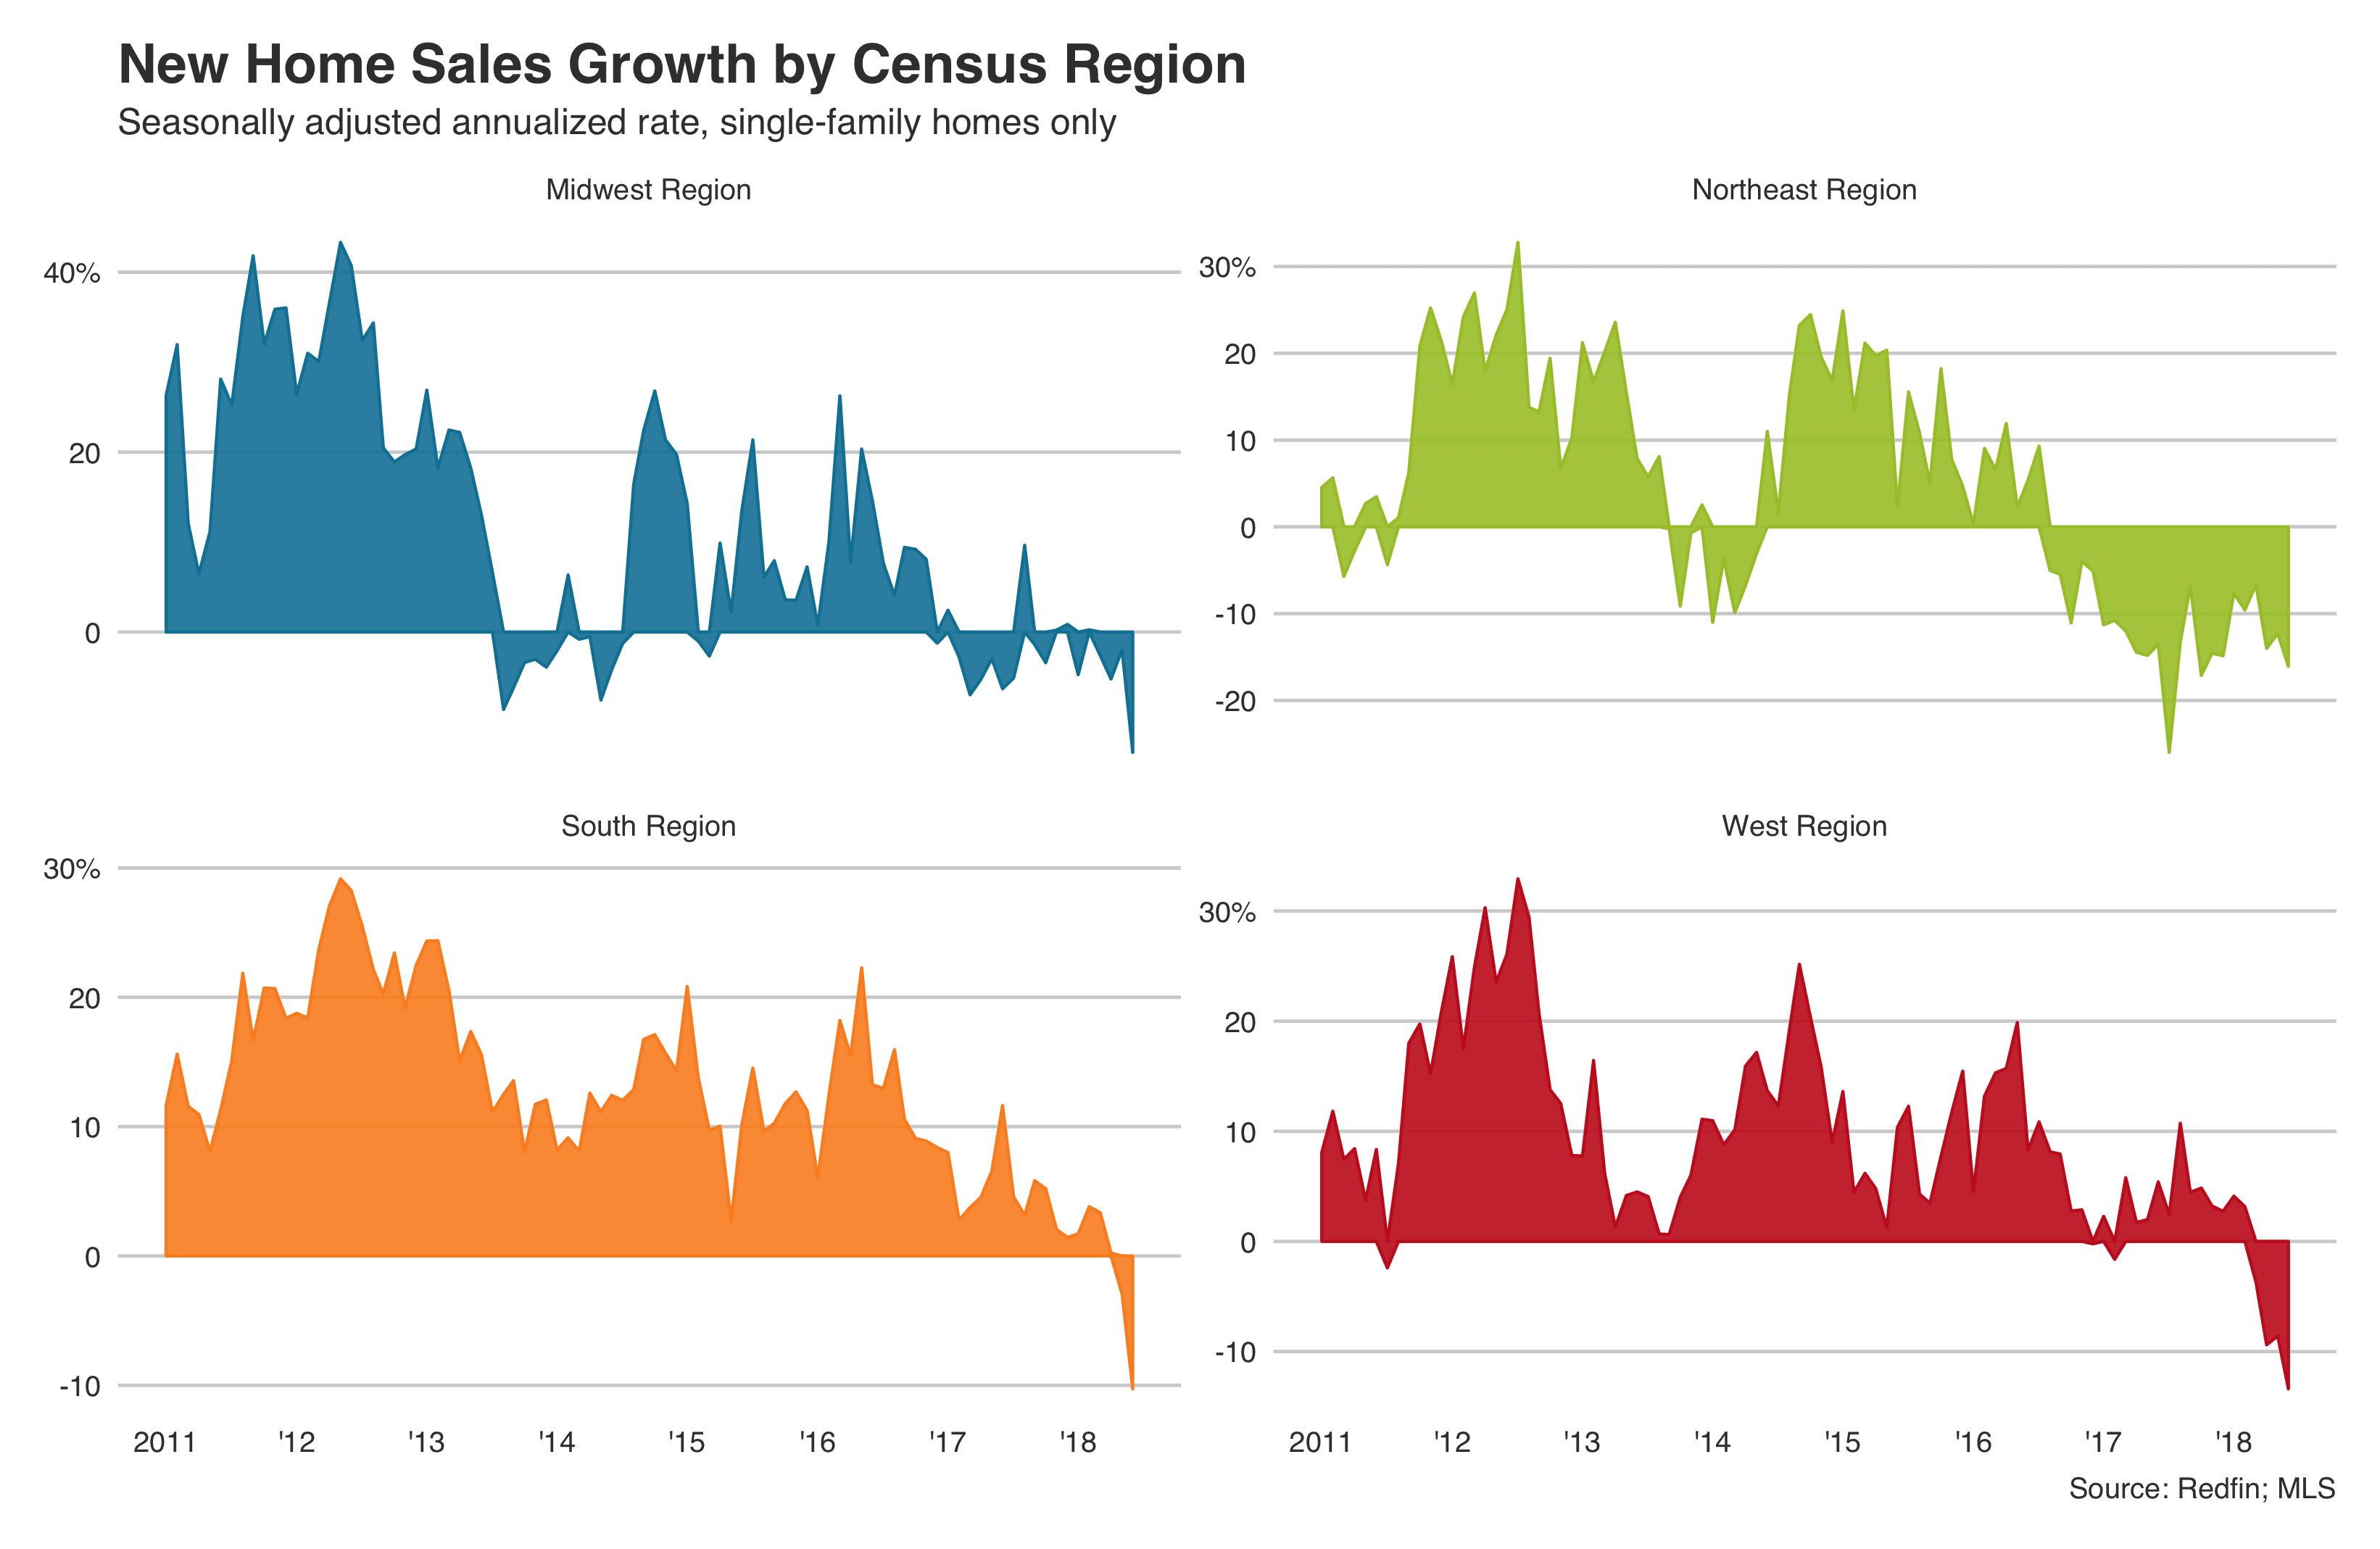
Here’s a look at the seasonally adjusted annualized rate for growth in new-home sales:
The data above is based on Redfin data that covers more than 150 US markets. The US Department of Housing and Urban Development, in conjunction with the Census, typically reports monthly data on new-home sales. Due to the partial shutdown of the federal government, the data for the end of 2018 hasn’t been released. Redfin released its November and December 2018 numbers on single-family new-home sales to bridge the gap as the shutdown continues. The chart below illustrates that overall, Redfin and HUD data show the same trends in new-home sales. All data below is based on year-over-over growth.
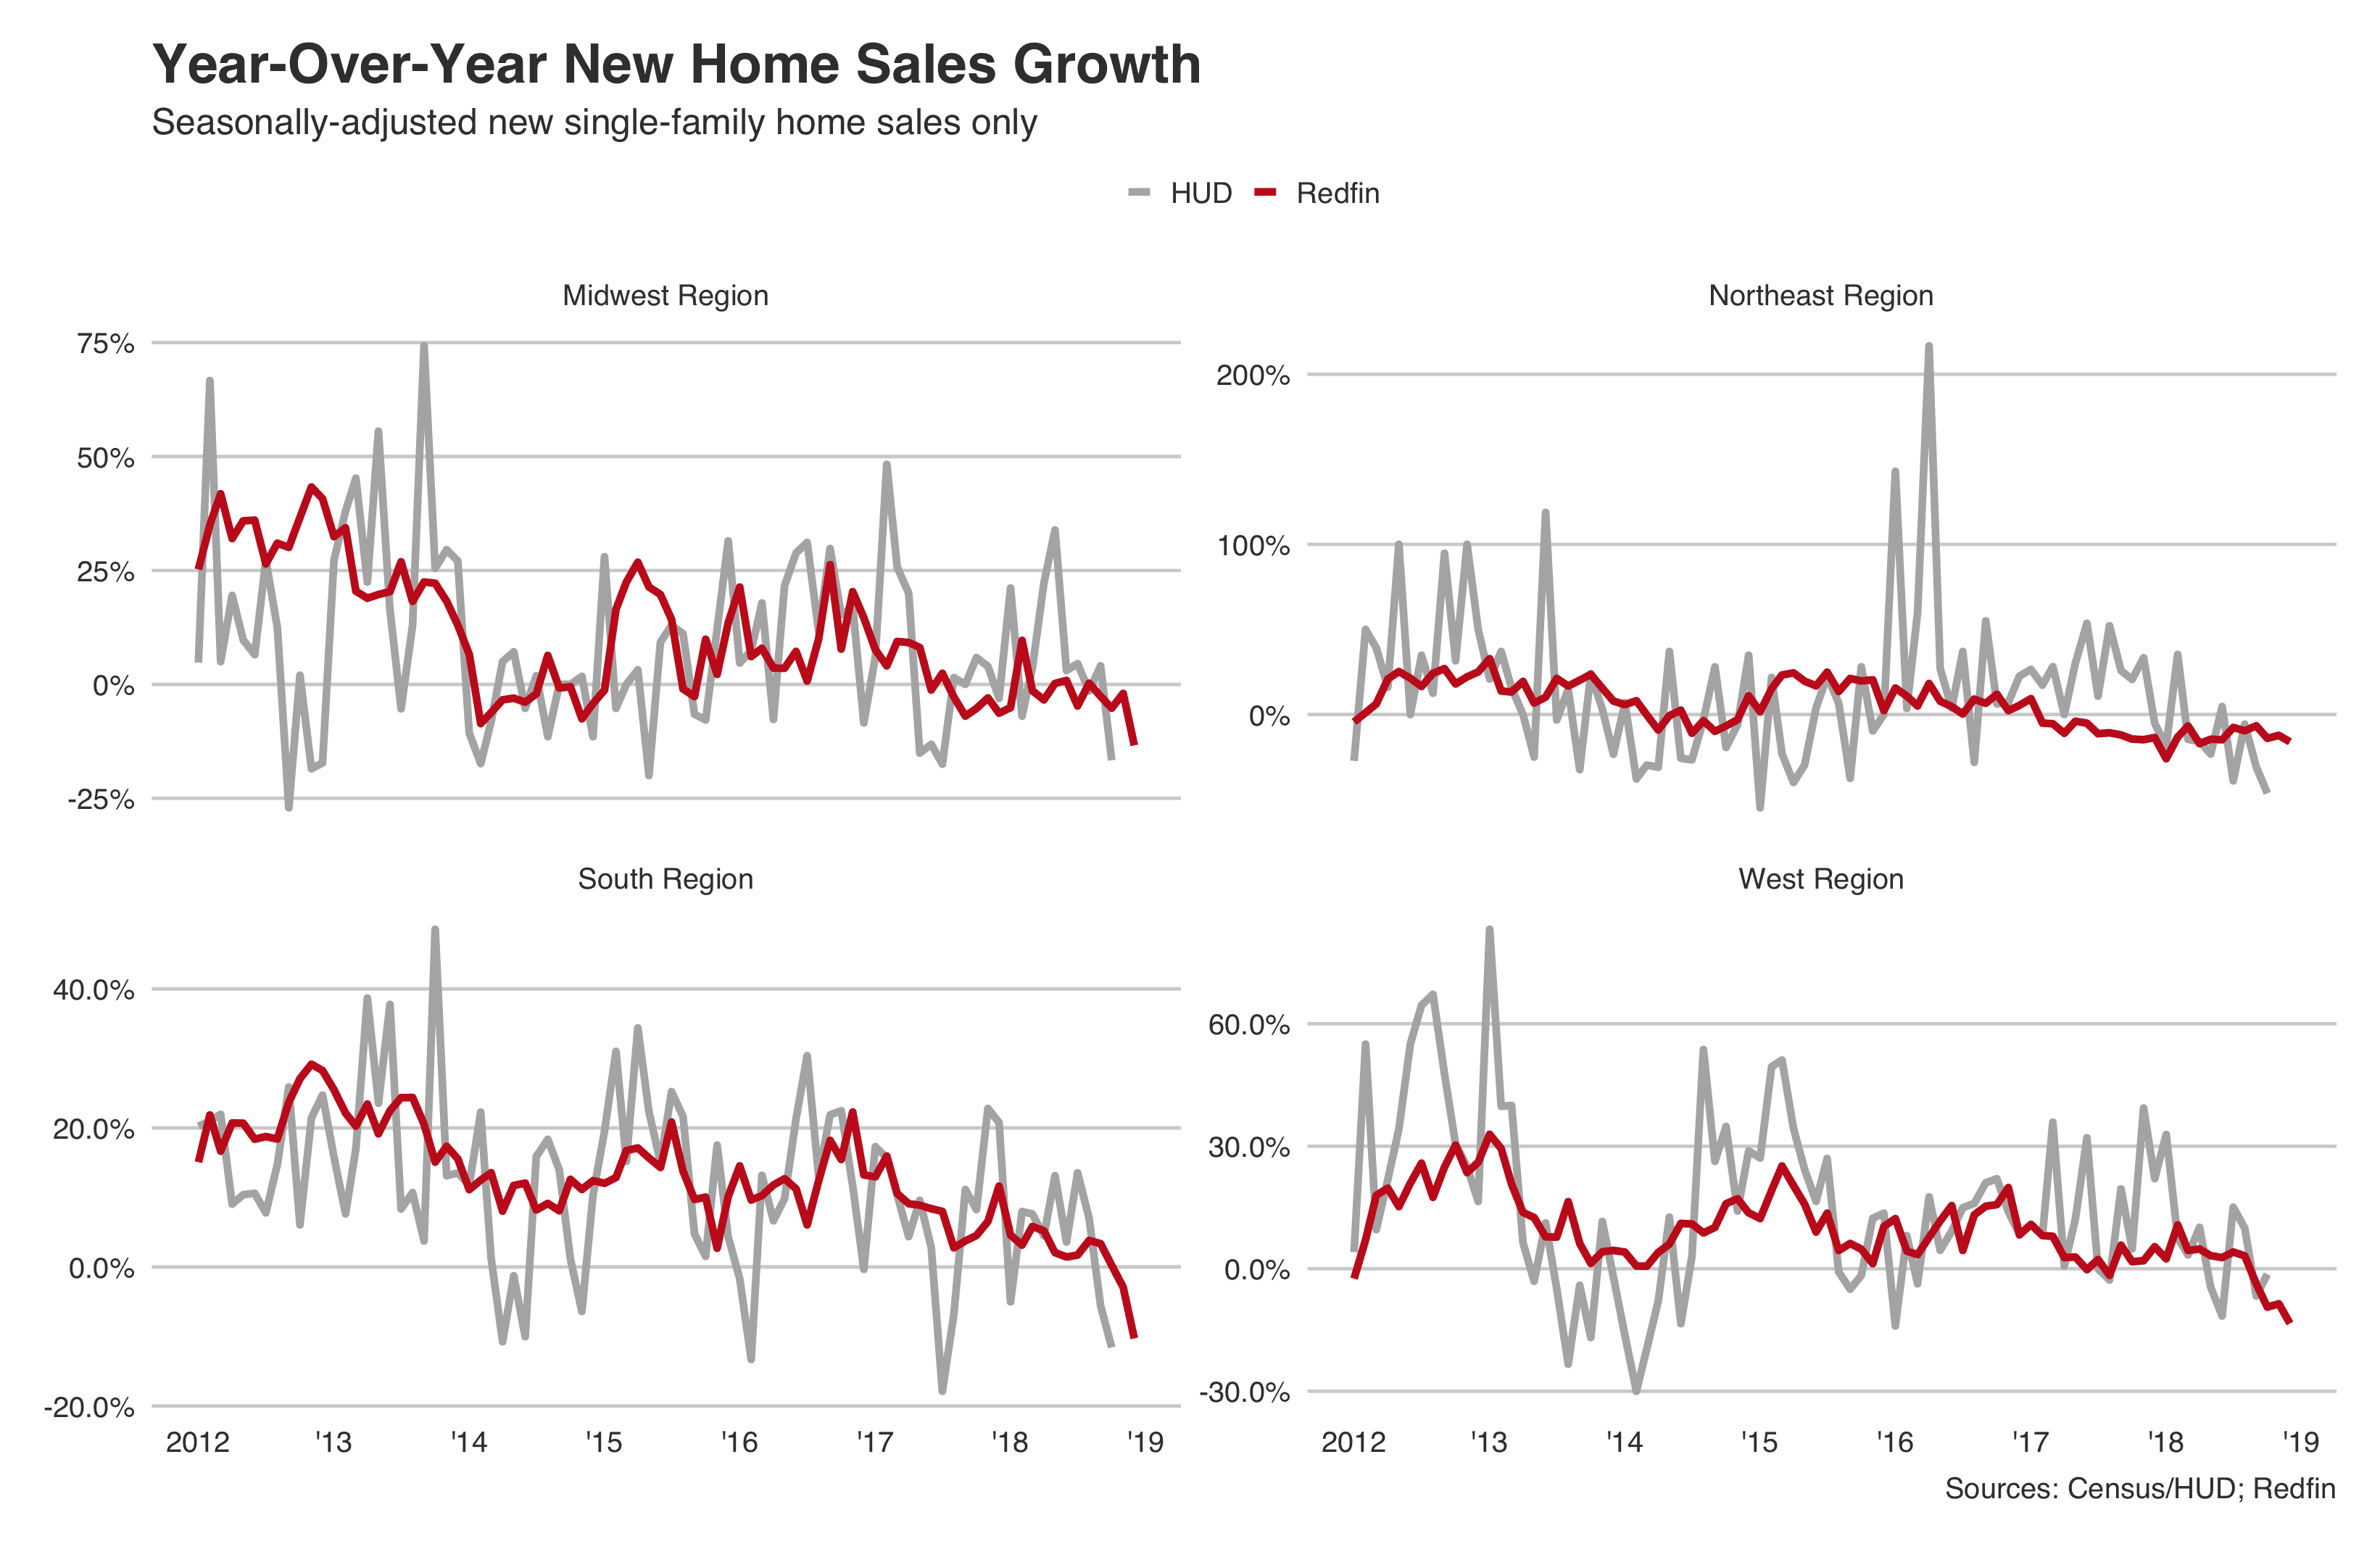
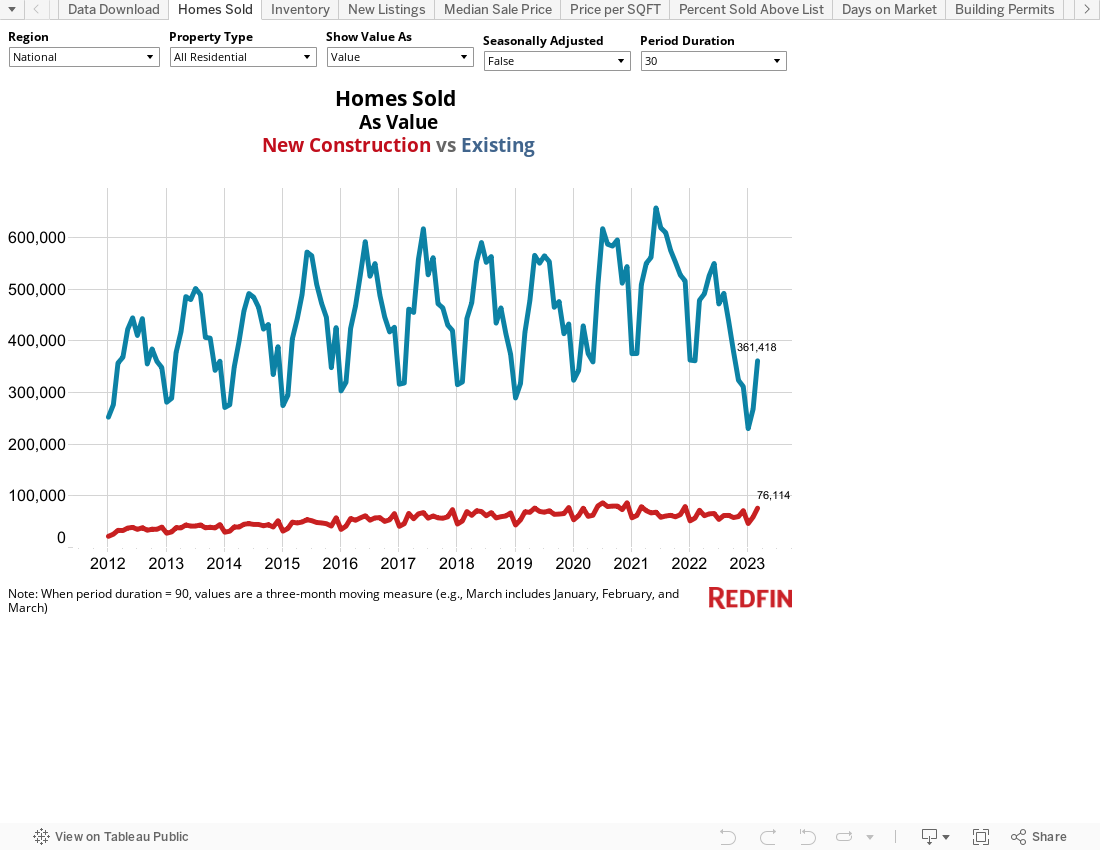
Here’s a look at Redfin’s new construction data:
 United States
 Canada