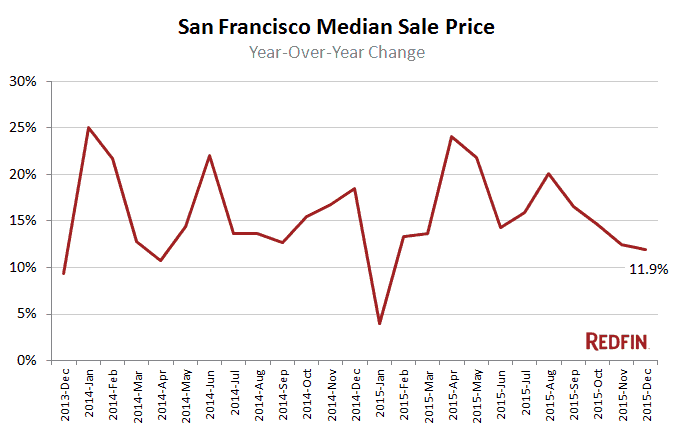
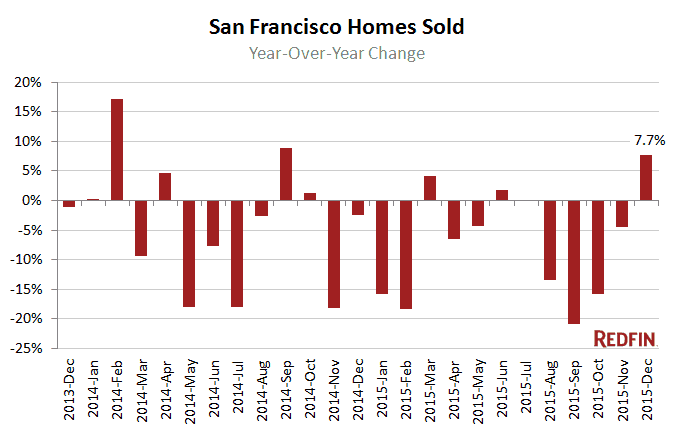
San Francisco home values rose nearly 12 percent in December from a year earlier, posting a median sale price of $1.15 million. Home sales also continued to climb, up 7.7 percent year over year. The city’s shortage of properties grew more acute last month, making the market even more difficult for buyers. There were only 143 new listings on the market in December, down 18 percent from last year. Total inventory in San Francisco also dwindled down to less than a month’s supply of homes for sale, the lowest it’s been since Redfin started tracking those numbers in 2012. This is a far cry from the standard six months of inventory that signals a balanced market.
“With so few homes to choose from buyers are really battling it out in San Francisco right now,” said Redfin agent Miriam Westberg. “Although buyers are facing heavy competition it is still possible to get an offer accepted even if you’re not an all-cash buyer. My most successful buyers go a step beyond pre-approval with their lender and get fully approved before making an offer. Not all lenders offer this option so it’s important to shop around. Perhaps more importantly, do everything you can to make a personal connection with the seller — compelling cover letters do work!”
Across the greater Bay Area, the median sale price rose nearly 15 percent in December, to $1 million, and sales rose almost 30 percent compared to a year earlier.
Hot Neighborhoods
Ashbury Heights was the most expensive neighborhood, with the median sale price jumping nearly 87 percent to almost $2.24 million. Forest Hill was a close second, with the typical home selling for about $2.07 million.
Tenderloin remained the city’s most affordable neighborhood, posting a median sale price of $483,500. Typical homes in Merced Heights and Outer Mission sold for less than $800,000, the city’s second and third least-expensive neighborhoods.
See our city page for the most up-to-date data on San Francisco home prices.
Here’s what’s happening in your neighborhood:
| Neighborhood | Median Sale Price | Year-Over-Year | Homes Sold | Year-Over-Year | Inventory | Year-Over-Year | New Listings | Median Days on Market | Avg Sale-to-List |
|---|---|---|---|---|---|---|---|---|---|
| Ashbury Heights | $2,237,500 | 86.5% | 8 | -57.9% | 5 | 150.0% | 9 | 16 | 113.2% |
| Bernal Heights | $1,197,500 | 4.1% | 61 | 5.2% | 23 | 15.0% | 48 | 14 | 115.1% |
| Civic Center / Van Ness | $802,500 | 7.0% | 22 | -31.3% | 19 | 216.7% | 25 | 24 | 103.7% |
| Crocker Amazon | $829,000 | 7.7% | 15 | 50.0% | 9 | -10.0% | 12 | 14 | 114.9% |
| Excelsior | $831,500 | 17.4% | 24 | -4.0% | 14 | -48.1% | 16 | 20 | 108.5% |
| Financial District | $949,500 | -55.3% | 8 | 14.3% | 5 | -28.6% | 5 | 22 | 104.9% |
| Forest Hill | $2,075,000 | 26.9% | 6 | -40.0% | 4 | 100.0% | 6 | 20 | 111.5% |
| Haight Ashbury | $1,300,000 | 20.9% | 22 | 0.0% | 3 | 0.0% | 15 | 15 | 104.3% |
| Hayes Valley | $1,275,000 | 11.8% | 11 | 22.2% | 8 | 700.0% | 13 | 13 | 104.1% |
| Ingleside | $870,000 | 32.4% | 12 | 20.0% | 5 | 66.7% | 7 | 16 | 108.9% |
| Inner Richmond | $1,150,000 | -14.8% | 16 | -23.8% | 6 | -40.0% | 8 | 17 | 110.2% |
| Inner Sunset | $1,475,000 | 5.0% | 15 | -34.8% | 13 | 8.3% | 21 | 14 | 119.4% |
| Lower Haight | $1,487,500 | 19.7% | 12 | -42.9% | 6 | -33.3% | 8 | 16 | 110.8% |
| Merced Heights | $710,000 | 12.7% | 12 | -40.0% | 6 | -45.5% | 9 | 22 | 112.2% |
| Miraloma Park | $1,250,000 | 21.0% | 37 | -17.8% | 9 | -30.8% | 26 | 13 | 110.6% |
| Mission | $1,200,000 | 35.1% | 31 | -13.9% | 24 | -14.3% | 35 | 17 | 107.8% |
| Mission Bay | $1,110,000 | 38.8% | 33 | -10.8% | 11 | 10.0% | 25 | 13 | 103.9% |
| Nob Hill | $1,225,000 | 3.2% | 27 | 22.7% | 10 | 11.1% | 18 | 16 | 104.7% |
| Noe Valley | $1,740,000 | 2.4% | 48 | -23.8% | 26 | 73.3% | 47 | 15 | 110.8% |
| Outer Mission | $780,000 | -1.9% | 16 | 6.7% | 4 | -63.6% | 11 | 17 | 112.0% |
| Outer Richmond | $1,105,000 | -8.5% | 24 | 60.0% | 18 | 260.0% | 26 | 25 | 107.8% |
| Outer Sunset | $1,020,000 | 25.9% | 47 | 11.9% | 14 | -22.2% | 39 | 16 | 118.7% |
| Pacific Heights | $1,700,000 | -13.3% | 50 | -24.2% | 30 | 30.4% | 39 | 16 | 107.2% |
| Parkside | $1,185,000 | 27.4% | 23 | -28.1% | 5 | -64.3% | 14 | 13 | 120.7% |
| Portola | $915,000 | 15.5% | 14 | -33.3% | 11 | 37.5% | 13 | 16 | 109.4% |
| Potrero Hill | $1,214,192 | 21.4% | 47 | -26.6% | 21 | 110.0% | 53 | 16 | 106.6% |
| Rincon Hill | $875,000 | -3.3% | 23 | -17.9% | 10 | 0.0% | 14 | 29 | 98.3% |
| Russian Hill | $1,562,500 | -16.6% | 31 | 19.2% | 13 | -31.6% | 28 | 15 | 105.3% |
| South of Market | $1,105,000 | 22.8% | 154 | 2.7% | 72 | 7.5% | 129 | 18 | 102.0% |
| Sunnyside | $1,281,000 | 57.5% | 19 | -20.8% | 5 | 0.0% | 19 | 13 | 115.0% |
| Sunset District | $1,186,500 | 22.3% | 139 | -10.9% | 49 | -19.7% | 118 | 15 | 118.7% |
| Telegraph Hill | $1,190,500 | -1.8% | 8 | -11.1% | 8 | 0.0% | 13 | 15 | 105.9% |
| Tenderloin | $483,500 | 46.2% | 4 | 100.0% | 2 | 0.0% | 3 | 11 | 105.4% |
| Twin Peaks | $1,158,500 | 27.6% | 4 | -55.6% | 8 | 166.7% | 8 | 14 | 114.1% |
| Visitacion Valley | $805,000 | 16.7% | 15 | -28.6% | 11 | -62.1% | 10 | 14 | 109.7% |
| Western Addition | $840,000 | 20.0% | 9 | -43.8% | 8 | 100.0% | 11 | 15 | 114.8% |
| San Francisco | $1,150,000 | 11.9% | 474 | 7.7% | 331 | -7.0% | 143 | 19 | 107.3% |
NOTE: Not all neighborhoods are listed, but totals for San Francisco encompass entire city. Data is based on listing information and might not reflect all real estate activity in the market. Neighborhood-specific data is measured over the three months ended Dec. 31. Inventory measures listings active as of Dec. 31.
For more information, contact Redfin journalist services
Phone: 206-588-6863
Email: press@redfin.com
 United States
 Canada