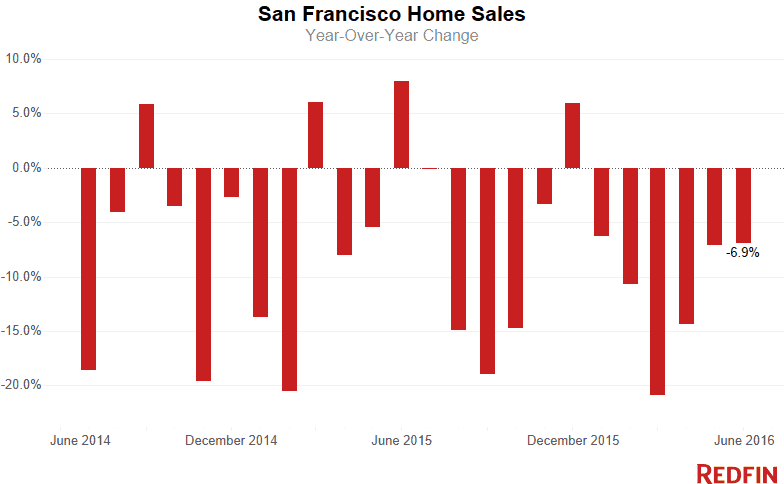
San Francisco home prices rose 2 percent in June from a year earlier, to a median $1.25 million. Sales in the city fell 6.9 percent, the sixth year-over-year slowdown.
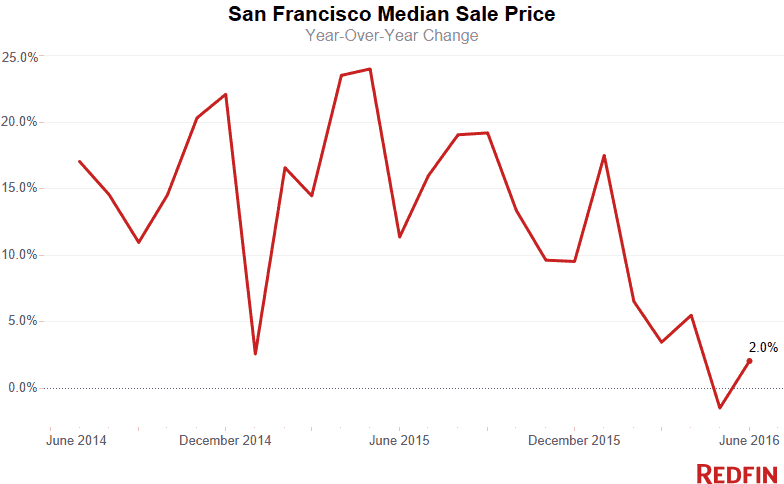
Price growth has slowed this year after four years double-digit inflation, which has sellers rushing into the market. The supply of homes for sale jumped 77.4 percent. Condo owners in particular were active in June, causing inventory of those units to more than double from the same time last year. Single-family inventory was up 37.4 percent.
“We have a lot of folks who are just trying to take advantage of what they perceive as the top of the market,” Redfin agent Mark Colwell said. Prices might be peaking for condos, he said, but not for single-family homes.
“There’s a feeling that a one- or two-bedroom condo can cost only so much, but that feeling doesn’t seem to apply with single-family homes,” Colwell said.
The city had more than 980 homes listed for sale in June, compared to 553 in June 2015. The number of new for-sale signs planted in June was up 8.5 percent, the sixth month of year-over-year growth.
Although inventory has improved, it hasn’t caught up with demand and buyers remain discouraged by high prices and a lack of choice. Less than 67 percent of homes sold for more than asking price, down 10 percent from a year ago. It was the third-straight month of year-over-year declines.
Bay Area
Across the greater Bay Area, the median sale price rose 9.1 percent in June to $1.2 million. Sales slowed, dropping 2.6 percent year over year.
Hot Neighborhoods
Twin Peaks had only three home sales, but all went for more than asking price, pushing the neighborhood’s median price to $2.1 million, the city’s highest.
That contrasted with other high-end neighborhoods in the city, where fewer sellers were able to command as much money as they wanted. In the Financial District, Nob Hill, Mission Bay, Rincon Hill and other communities where a typical home sold for more than $1.5 million, sellers had to compromise as fewer houses fetched more than asking price.
In Nob Hill about one in three homes sold above list price, a 37 percent drop from a year ago. In the Financial District, it was fewer than one in seven, a drop of nearly 29 percent.
The Tenderloin continued its streak as the city’s most-affordable community, with a median sale price of $535,000 based on five sales.
See our city page for the most up-to-date data on San Francisco home prices.
Here’s what’s happening in your neighborhood:
| Place | Median Sale Price | Year-Over-Year | Homes Sold | Year-Over-Year | Inventory | Year-Over-Year | New Listings | Median Days on Market | Avg Sale-to-List |
|---|---|---|---|---|---|---|---|---|---|
| Ashbury Heights | $1,510,000 | 18.4% | 10 | -56.5% | 4 | 0.0% | 16 | 14 | 103.1% |
| Bayview | $726,250 | -0.2% | 28 | -33.3% | 30 | 87.5% | 41 | 17 | 108.1% |
| Bernal Heights | $1,280,000 | -1.9% | 61 | 10.9% | 28 | 33.3% | 80 | 15 | 117.7% |
| Castro | $1,090,000 | -32.6% | 2 | 100.0% | 1 | NA | 2 | 14 | 97.5% |
| Civic Center / Van Ness | $712,500 | -18.8% | 30 | 7.1% | 32 | 128.6% | 59 | 16 | 105.8% |
| Colma | $755,000 | 11.8% | 1 | 0.0% | 1 | -66.7% | 1 | 14 | 111.9% |
| Crocker Amazon | $886,500 | 4.5% | 7 | -41.7% | 12 | 100.0% | 16 | 24 | 105.1% |
| Daly City | $804,000 | 8.1% | 51 | 10.9% | 83 | 62.8% | 70 | 23 | 107.4% |
| Excelsior | $890,000 | 13.4% | 31 | 10.7% | 13 | 0.0% | 34 | 14 | 113.0% |
| Financial District | $1,625,000 | 20.4% | 7 | 0.0% | 7 | 75.0% | 10 | 49 | 99.2% |
| Forest Hill | $2,100,000 | 13.5% | 8 | -27.3% | 2 | 0.0% | 9 | 18 | 105.2% |
| Haight Ashbury | $1,535,000 | 17.4% | 13 | -50.0% | 7 | 75.0% | 18 | 14 | 109.7% |
| Hayes Valley | $1,400,000 | 20.4% | 7 | 16.7% | 9 | -10.0% | 19 | 23 | 105.9% |
| Ingleside | $844,000 | 16.8% | 12 | 100.0% | 3 | 0.0% | 12 | 14 | 112.0% |
| Inner Richmond | $1,825,000 | 4.3% | 24 | -31.4% | 9 | -35.7% | 24 | 13 | 110.7% |
| Inner Sunset | $1,600,000 | 13.5% | 31 | 63.2% | 11 | -8.3% | 32 | 17 | 114.3% |
| Lower Haight | $1,383,750 | 17.2% | 14 | -22.2% | 8 | 100.0% | 17 | 13 | 115.1% |
| Merced Heights | $740,000 | 19.4% | 17 | 30.8% | 7 | -12.5% | 18 | 19 | 109.6% |
| Miraloma Park | $1,200,000 | -14.3% | 34 | -26.1% | 20 | 100.0% | 48 | 15 | 111.6% |
| Mission | $1,210,000 | 23.5% | 41 | -46.8% | 23 | 76.9% | 50 | 20 | 105.7% |
| Mission Bay | $1,282,500 | -5.7% | 46 | 12.2% | 23 | 228.6% | 45 | 29 | 100.7% |
| Nob Hill | $1,754,000 | 34.9% | 22 | -24.1% | 17 | 88.9% | 28 | 29 | 99.7% |
| Noe Valley | $1,669,000 | -8.1% | 74 | 2.8% | 38 | 58.3% | 88 | 15 | 108.9% |
| Outer Mission | $610,000 | -37.4% | 10 | 42.9% | 10 | 233.3% | 18 | 29 | 100.1% |
| Outer Richmond | $1,400,000 | 7.7% | 25 | 8.7% | 18 | 63.6% | 30 | 20 | 117.2% |
| Outer Sunset | $1,100,000 | 10.5% | 49 | 8.9% | 14 | 27.3% | 45 | 15 | 117.5% |
| Pacific Heights | $1,082,500 | 19.1% | 6 | -25.0% | 4 | 100.0% | 9 | 14 | 108.7% |
| Pacific Heights | $1,917,500 | -14.8% | 62 | 17.0% | 43 | 138.9% | 83 | 17 | 105.2% |
| Parkside | $1,250,500 | 10.2% | 33 | 13.8% | 9 | 28.6% | 31 | 16 | 117.3% |
| Portola | $950,000 | 8.0% | 15 | -11.8% | 7 | -12.5% | 20 | 14 | 113.4% |
| Potrero Hill | $1,137,000 | -21.4% | 44 | 4.8% | 32 | 77.8% | 56 | 14 | 109.7% |
| Rincon Hill | $1,247,500 | 4.0% | 28 | -17.6% | 40 | 344.4% | 59 | 23 | 99.3% |
| Russian Hill | $1,600,000 | -26.9% | 35 | 34.6% | 22 | 69.2% | 49 | 14 | 105.2% |
| South of Market | $959,000 | -4.4% | 70 | -27.1% | 100 | 117.4% | 139 | 28 | 102.0% |
| South San Francisco | $800,000 | 6.0% | 36 | 5.9% | 73 | 58.7% | 58 | 17 | 106.9% |
| Sunnyside | $1,130,000 | -9.6% | 23 | -8.0% | 8 | 33.3% | 24 | 15 | 115.8% |
| Sunset District | $1,275,000 | 6.2% | 165 | 5.1% | 50 | 16.3% | 183 | 15 | 117.7% |
| Telegraph Hill | $1,331,000 | 43.1% | 13 | -35.0% | 11 | 175.0% | 18 | 19 | 102.8% |
| Tenderloin | $535,000 | -38.9% | 5 | 66.7% | 4 | 33.3% | 6 | 13 | 102.5% |
| Twin Peaks | $2,110,000 | 118.1% | 3 | -75.0% | 6 | 50.0% | 7 | 14 | 109.1% |
| Visitacion Valley | $850,000 | 17.6% | 9 | -62.5% | 10 | 0.0% | 20 | 14 | 110.0% |
| Western Addition | $1,100,000 | -4.3% | 15 | -31.8% | 13 | 30.0% | 23 | 22 | 105.3% |
| San Francisco, CA | $1,250,000 | 2.0% | 515 | -6.9% | 981 | 77.4% | 653 | 17 | 107.6% |
NOTE: Not all neighborhoods are listed, but totals for San Francisco encompass the entire city. Data is based on listing information and might not reflect all real estate activity in the market. Neighborhood-specific data is measured over a three-month span that ended June 30. Inventory measures listings active as of June 30.
For more information, contact Redfin journalist services
Phone: 206-588-6863
Email: press@redfin.com
See Redfin’s data center to find out what’s happening in other cities.
To be added to Redfin’s press release distribution list, subscribe here.
 United States
 Canada