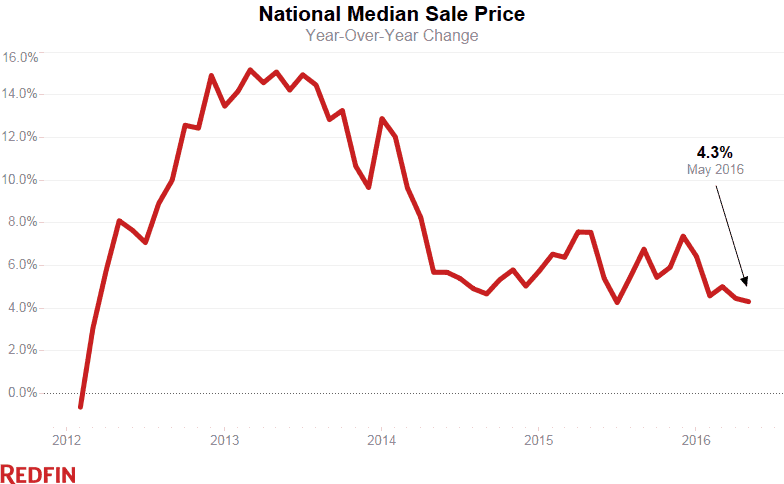
While home prices grew a moderate 4.3 percent year over year last month, sales surged 7 percent and inventory fell by nearly as much. These forces, combined with new technologies allowing buyers to see and make informed decisions about homes as soon as they hit the market, caused the pace of sales to accelerate to its fastest level on record.
The pickup in sales was widespread, as nearly a third of the markets Redfin tracks reported growth in the double digits. Affordable markets in the Midwest and the South led the surge in sales.
| Market Summary | May 2016 | Month-Over-Month | Year-Over-Year |
|---|---|---|---|
| Median sale price | $269,200 | 2.3% | 4.3% |
| Homes sold | 263,000 | 11.4% | 7.0% |
| New listings | 342,400 | -2.8% | -2.2% |
| All Homes for sale | 845,000 | 2.0% | -6.6% |
| Median days on market | 42 | -6 | -7 |
| Months of supply | 3.2 | -0.3 | -0.5 |
| Sold above list | 23.2% | 1.3% | 1.8% |
| Average Sale-to-list | 98.5% | 3.5% | 0.7% |
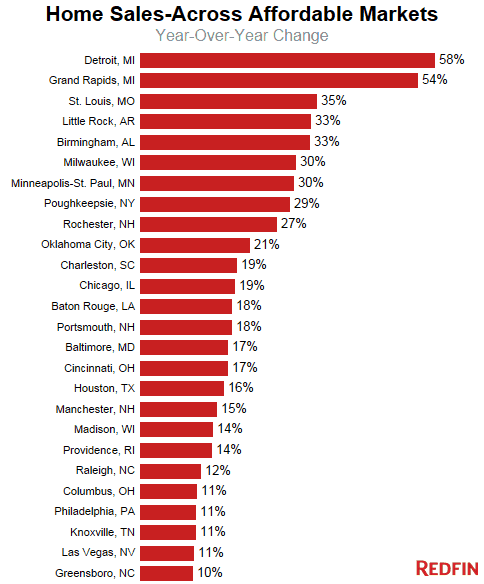
In Michigan, Detroit and Grand Rapids saw the number of homes sold surge by more than 50 percent from last year.
“Grand Rapids is inventory-starved, so every listing is like a feeding frenzy,” said Redfin agent Kent Selders. “Almost everything is selling immediately, even at higher price points.”
Tech migration from high-priced cities is a common driver of local demand in Grand Rapids among other affordable markets that saw sizeable increases in home sales this spring.
“We’re seeing an influx of buyers from places like San Francisco, Southern California, Seattle and Washington, D.C. Most new residents are lured by tech jobs and opportunities to work remotely,” said Selders. “Locals are watching prices rise, and many realize if they don’t buy soon, they’ll miss out while homes are still affordable. The result is incredible demand and rapid sales. Nothing like this has ever happened in Grand Rapids.”
Affordability is key to homebuyers this spring. In 26 of the 32 markets with double-digit sales growth, the typical home sold for less than the national median of $269,200. Meanwhile, expensive markets in the West continue to lag the nation. Sales grew by less than 1 percent from last year in Seattle, San Francisco, San Diego and Riverside, California—and fell in Los Angeles, Portland, Denver and Sacramento.
Also making an impact among spring buyers were rock-bottom 30-year mortgage rates, which reached three-year lows this spring, at 3.6 percent.
“Move-up buyers have specifically noted they are buying now to take advantage of still-low mortgage rates,” said William Porterfield, a Redfin agent in Little Rock, where sales increased 33 percent from a year ago. “They’re focused on buying as much house as possible while interest rates are so low.”
The shift in the mix of housing activity away from expensive coastal markets and toward affordable ones in the middle of the country kept a lid on price growth. May’s median home sales price rose by just 4.3 percent, down from the 4.8 percent rate posted in April, even though sales grew and inventory shrunk.
As buyers were eager to scoop up existing inventory, sellers pulled back in May. The number of new homes listed fell for the second month in a row, down 2.2 percent from last year. The decline in new listings was especially acute in the Northeast. Boston, New York’s Hudson Valley and Wilmington, Delaware all saw 18 percent year-over-year declines.
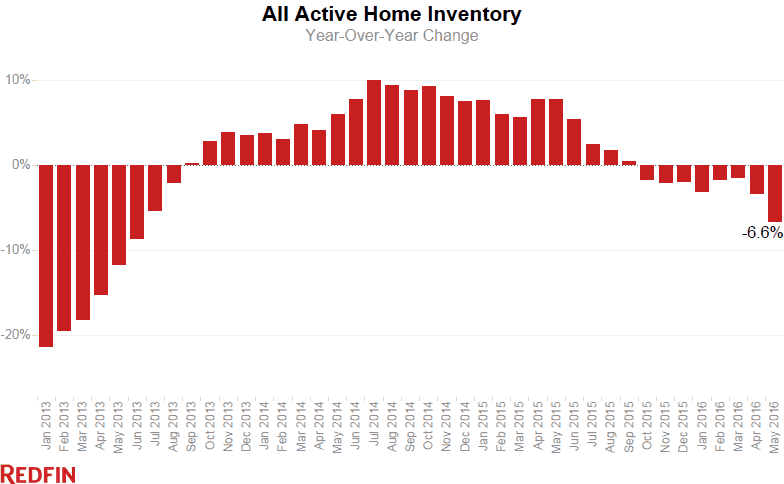
Overall home inventory decreased for the eighth-consecutive month in May, falling 6.6 percent. This was the largest year-over-year decline in the number of homes for sale in nearly three years.
May was the fastest market on record since we began keeping track in 2009. The typical home spent 42 days on the market, a full week faster than the same time last year. Even the affordable markets could not avoid the intensity of the 2016 market. Sacramento, Salt Lake City, Grand Rapids and Omaha all saw their typical home sell within two weeks last month.
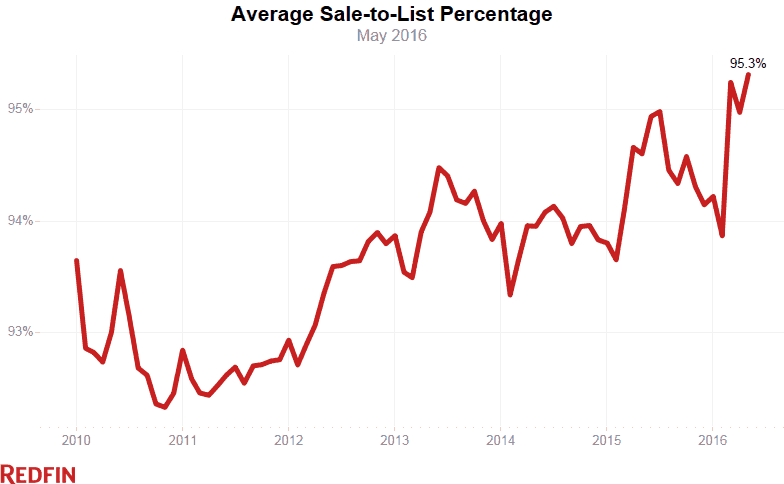
The average sale-to-list price ratio was also the highest recorded since at least 2009, clocking in at a record 95.3 percent, up from 94.6 percent a year earlier. With inventory continuing to fall and all indicators suggesting that mortgage rates won’t rise before autumn, the market’s intensity is unlikely to diminish as we head into summer.
Other May Highlights
Prices
- The central Florida city of Deltona led the country in price growth, where the median sale price increased by 15.4% year over year to $161,500, followed by Orlando (+14.0% to $205,000). Poughkeepsie, NY rebounded from a drop in April to round out the top three (+13.8% to $215,000).
- Prices fell the most in Greensboro, NC, where the median sale prices dropped 3.6% from a year earlier to $144,000, followed by Camden, NJ (-2.8% to $179,900) and Birmingham, AL (-1.6% to $185,000).
- Two additional metros saw at least a 1 percent price drop from a year ago: Washington, D.C. (-1.1% to $375,00) and Baton Rouge, LA (-1.0% to $192,400).
Sales
- The year-over-year increase in sales was widespread, with 70% of metro areas reporting growth. In addition to Detroit and Grand Rapids, other midwestern cities saw large increases, including St. Louis, MO (34.6%), Minneapolis, MN (30.0%) and Madison, WI (14.2%).
- Columbia, SC saw the biggest drop in sales, down 42.5% year over year. Several Florida metros, including Miami (-19.3%), Deltona (-16.2%) and West Palm Beach (-16%), also saw double-digit year-over-year declines.
Inventory
- Birmingham, AL had the largest increase in homes for sale, up 62.8% from a year ago. Despite the surge in inventory, months of supply in Birmingham stood at just 3.8, still indicating a strong seller’s market.
- The San Francisco Bay Area continues to see large increases in inventory compared to last year. Inventory increased in San Jose and San Francisco by 49.4% and 28%, respectively.
- Months of supply was lowest in Seattle at 1.0, Denver at 1.2 and Portland and Oakland at 1.3.
Competition
- Denver outpaced Portland and Seattle as the fastest market in May, with half of all new listings selling in 6 days or less. Portland and Seattle now tie for second fastest at a median 7 days on market.
- Despite slowing growth in its median sale price, San Francisco continued to lead the country with the highest sale-to-list price ratio. Homes sold on average for 106.9% of the asking price for the third month in a row. Six other western cities saw their average home sell above the asking price, including Oakland (105.2%), San Jose (104.4%), Seattle (103.2%), Portland (102%) Denver (101.3%), Tacoma, WA(100.6%) and Dallas (100.6%).
You can download data from the May Market Tracker in an Excel spreadsheet. The tables that follow feature Redfin’s largest metro regions. For all of our data coverage, visit the Data Center.
For additional local analysis, see: Chicago, Los Angeles, San Francisco, Miami and Washington, D.C.
Redfin chief economist Nela Richardson will host a Facebook Live Video Q&A on the latest housing market updates on Monday, June 20th at 11 AM PT/ 2 PM ET. Join in on our Facebook www.facebook.com/redfin.
Median Sale Price
| Redfin Metro | Median Sale Price | Month-Over-Month | Year-Over-Year |
|---|---|---|---|
| Atlanta, GA | $210,500 | 2.7% | 6.0% |
| Baltimore, MD | $261,500 | 6.8% | 3.8% |
| Boston, MA | $370,000 | 2.8% | 2.8% |
| Chicago, IL | $232,000 | 4.0% | 6.4% |
| Cleveland, OH | $134,000 | 4.9% | 7.2% |
| Dallas-Fort Worth, TX | $239,500 | 6.4% | 8.9% |
| Denver, CO | $355,000 | 2.9% | 10.9% |
| Detroit, MI | $162,000 | 11.7% | 4.5% |
| Edison, NJ | $290,000 | 7.4% | 1.8% |
| Houston, TX | $225,000 | 3.2% | 2.7% |
| Kansas City, MO | $187,000 | 3.7% | 1.2% |
| Las Vegas, NV | $210,000 | 2.4% | 9.9% |
| Long Island, NY | $390,000 | 4.0% | 3.8% |
| Los Angeles, CA | $540,000 | 1.9% | 9.6% |
| Miami, FL | $250,000 | 0.0% | 2.0% |
| Minneapolis-St. Paul, MN | $235,400 | 3.0% | 6.1% |
| Oakland, CA | $650,000 | 4.0% | 8.3% |
| Orange County, CA | $630,600 | 0.4% | 5.3% |
| Orlando, FL | $205,000 | 5.8% | 14.0% |
| Philadelphia, PA | $240,000 | 6.7% | 7.6% |
| Phoenix, AZ | $227,500 | 1.1% | 5.8% |
| Pittsburgh, PA | $150,200 | 3.2% | 2.1% |
| Portland, OR | $340,000 | 1.1% | 11.5% |
| Riverside-San Bernardino, CA | $315,000 | 0.4% | 6.8% |
| Sacramento, CA | $340,000 | 2.7% | 6.0% |
| San Antonio, TX | $202,900 | 4.1% | 2.6% |
| San Diego, CA | $505,000 | 1.0% | 7.9% |
| Seattle, WA | $440,000 | 2.3% | 10.3% |
| St. Louis, MO | $170,500 | 4.0% | 1.2% |
| Tampa, FL | $185,000 | 3.4% | 12.1% |
| Washington, DC | $375,000 | 2.0% | -1.1% |
| National | $269,200 | 2.3% | 4.3% |
New Listings
| Redfin Metro | New Listings | Month-Over-Month | Year-Over-Year |
|---|---|---|---|
| Atlanta, GA | 12,017 | -5.9% | -2.6% |
| Baltimore, MD | 5,284 | -10.3% | -6.9% |
| Boston, MA | 8,979 | 0.7% | -18.1% |
| Chicago, IL | 16,560 | -2.0% | -4.6% |
| Cleveland, OH | 3,453 | -0.2% | -11.1% |
| Dallas-Fort Worth, TX | 10,152 | 0.2% | -6.1% |
| Denver, CO | 6,431 | 4.9% | -3.3% |
| Detroit, MI | 7,955 | 4.6% | -7.3% |
| Edison, NJ | 4,618 | -8.2% | -6.3% |
| Houston, TX | 10,002 | 3.7% | 2.7% |
| Kansas City, MO | 4,069 | -9.3% | 7.3% |
| Las Vegas, NV | 4,169 | -3.4% | 3.6% |
| Long Island, NY | 4,168 | 4.5% | -9.2% |
| Los Angeles, CA | 9,649 | 3.7% | 11.8% |
| Miami, FL | 4,514 | -1.4% | 10.2% |
| Minneapolis-St. Paul, MN | 7,814 | 1.8% | 1.2% |
| Oakland, CA | 3,313 | -1.9% | -4.3% |
| Orange County, CA | 4,345 | 6.2% | 12.1% |
| Orlando, FL | 4,620 | -1.2% | -2.6% |
| Philadelphia, PA | 6,233 | -7.7% | -13.5% |
| Phoenix, AZ | 8,920 | -9.9% | 5.3% |
| Pittsburgh, PA | 2,558 | -4.0% | -4.9% |
| Portland, OR | 4,838 | 0.3% | -3.6% |
| Riverside-San Bernardino, CA | 7,607 | 6.8% | 18.2% |
| Sacramento, CA | 3,890 | -2.9% | -3.1% |
| San Antonio, TX | 3,072 | -1.8% | -7.3% |
| San Diego, CA | 4,190 | -3.5% | -1.7% |
| Seattle, WA | 5,841 | 1.4% | 0.2% |
| St. Louis, MO | 4,819 | -12.8% | 17.4% |
| Tampa, FL | 5,986 | -3.6% | -0.7% |
| Washington, DC | 10,427 | -17.7% | -13.8% |
| National | 342,400 | -2.8% | -2.2% |
All Homes for Sale
| Redfin Metro | All Homes for Sale | Month-Over-Month | Year-Over-Year |
|---|---|---|---|
| Atlanta, GA | 34,619 | 9.9% | -1.3% |
| Baltimore, MD | 11,996 | -1.3% | -16.6% |
| Boston, MA | 13,086 | -1.3% | -24.9% |
| Chicago, IL | 49,958 | 2.6% | -9.0% |
| Cleveland, OH | 10,384 | 1.2% | -14.0% |
| Dallas-Fort Worth, TX | 14,807 | -8.5% | -15.6% |
| Denver, CO | 5,823 | 1.5% | -24.4% |
| Detroit, MI | 13,708 | 0.1% | -23.2% |
| Edison, NJ | 18,849 | 11.9% | 6.8% |
| Houston, TX | 23,009 | -1.2% | 15.3% |
| Las Vegas, NV | 13,455 | -2.5% | -6.3% |
| Long Island, NY | 13,539 | 1.1% | -15.9% |
| Los Angeles, CA | 16,575 | 3.4% | 3.6% |
| Miami, FL | 18,050 | -1.3% | 4.3% |
| Minneapolis-St. Paul, MN | 13,082 | 4.0% | -16.5% |
| Oakland, CA | 3,196 | 4.3% | -6.9% |
| Orange County, CA | 8,378 | 7.2% | 7.8% |
| Orlando, FL | 11,007 | -4.2% | -20.2% |
| Philadelphia, PA | 17,946 | 1.2% | -16.0% |
| Phoenix, AZ | 22,874 | -8.1% | 0.4% |
| Portland, OR | 4,950 | 1.5% | -25.9% |
| Riverside-San Bernardino, CA | 17,208 | 1.9% | 6.5% |
| Sacramento, CA | 5,391 | 3.3% | -21.2% |
| San Antonio, TX | 7,068 | -4.6% | -5.7% |
| San Diego, CA | 6,293 | -4.5% | -17.1% |
| Seattle, WA | 4,803 | -1.9% | -29.2% |
| St. Louis, MO | 13,715 | -2.1% | 19.0% |
| Tampa, FL | 15,373 | -4.1% | -15.4% |
| Washington, DC | 19,319 | -3.0% | -18.4% |
| National | 845,000 | 2.0% | -6.6% |
 United States
 Canada