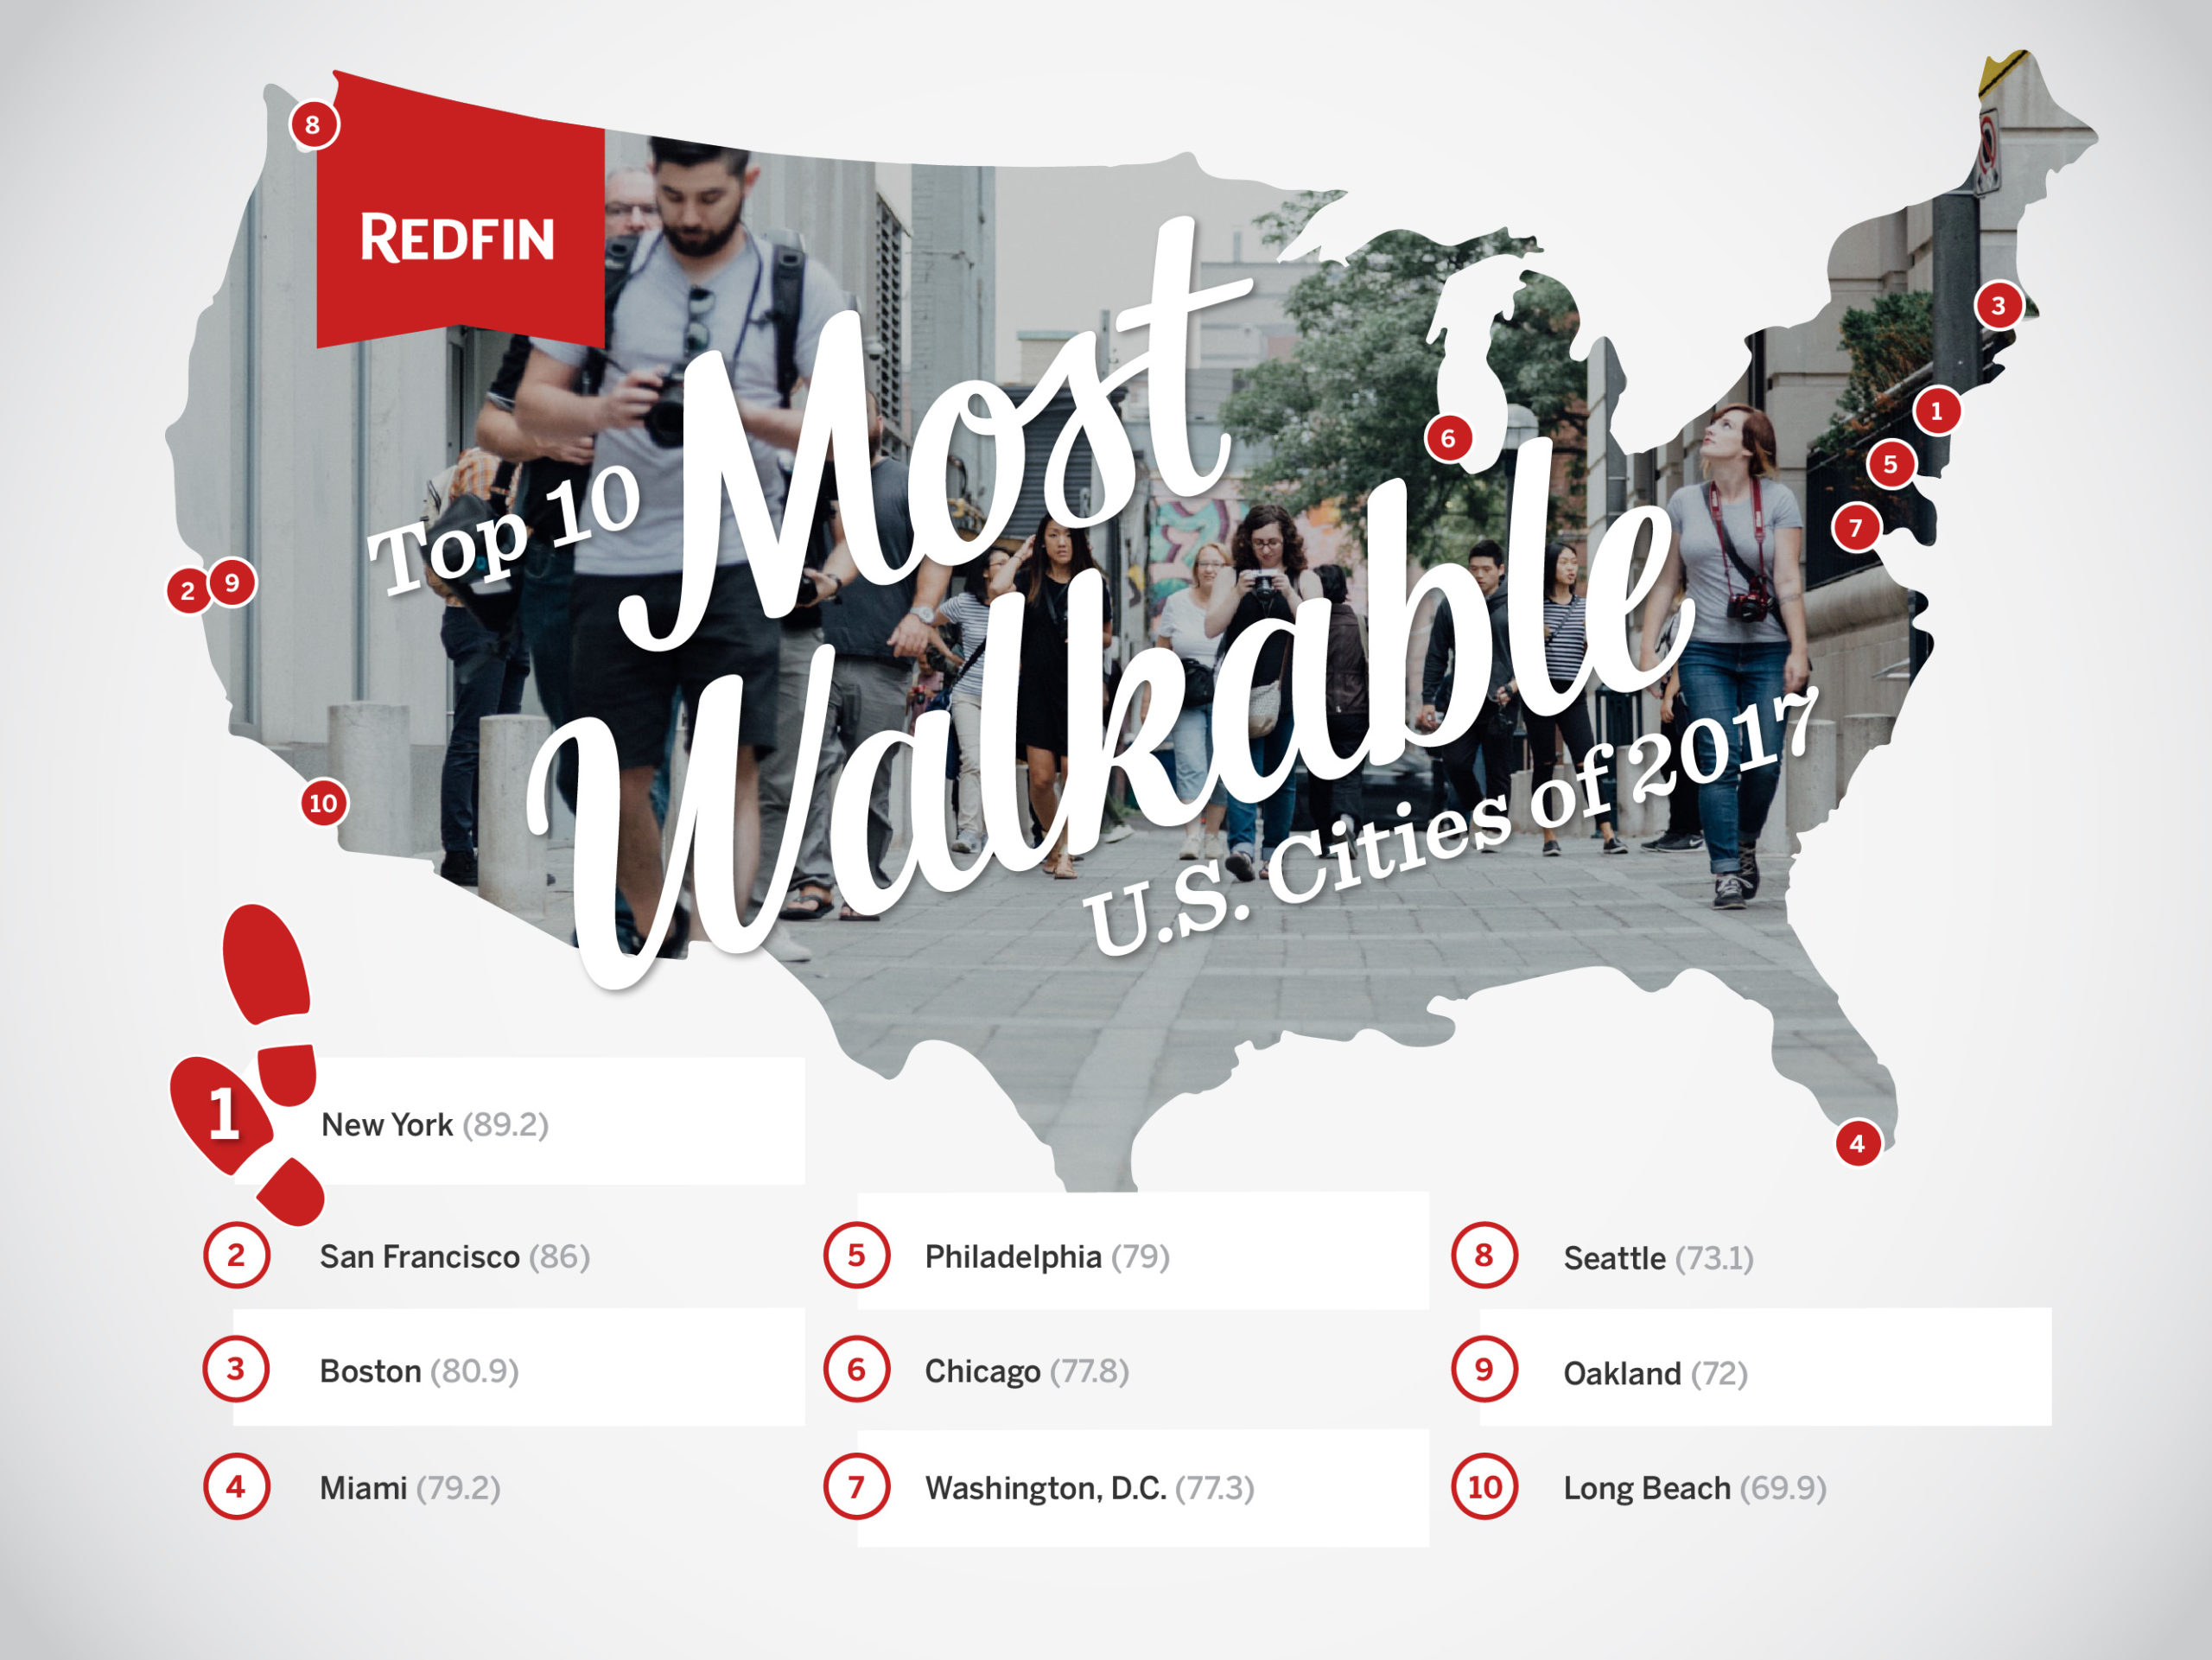
New York, San Francisco and Boston remain the most walkable large cities in the U.S., according to the latest annual ranking by Walk Score®, a Redfin company. Miami, which saw its Walk Score rating increase by one point since last year, has surpassed Philadelphia to become the fourth-most walkable city. Unlike last year, no new cities cracked the top 10.
| Rank | City | Walk Score | Change from 2016 |
| 1 | New York | 89.2 | +0.3 |
| 2 | San Francisco | 86.0 | +0.4 |
| 3 | Boston | 80.9 | +0.2 |
| 4 | Miami | 79.2 | +1.0 |
| 5 | Philadelphia | 79.0 | +0.7 |
| 6 | Chicago | 77.8 | +0.3 |
| 7 | Washington D.C. | 77.3 | +0.4 |
| 8 | Seattle | 73.1 | +0.2 |
| 9 | Oakland | 72.0 | +0.5 |
| 10 | Long Beach | 69.9 | +0.9 |
New York City has maintained the No. 1 spot on the list once again. Since Walk Score updated its algorithm in 2014, New York reigns as the king of walkability, and its Walk Score now sits at an all-time high of 89.2.
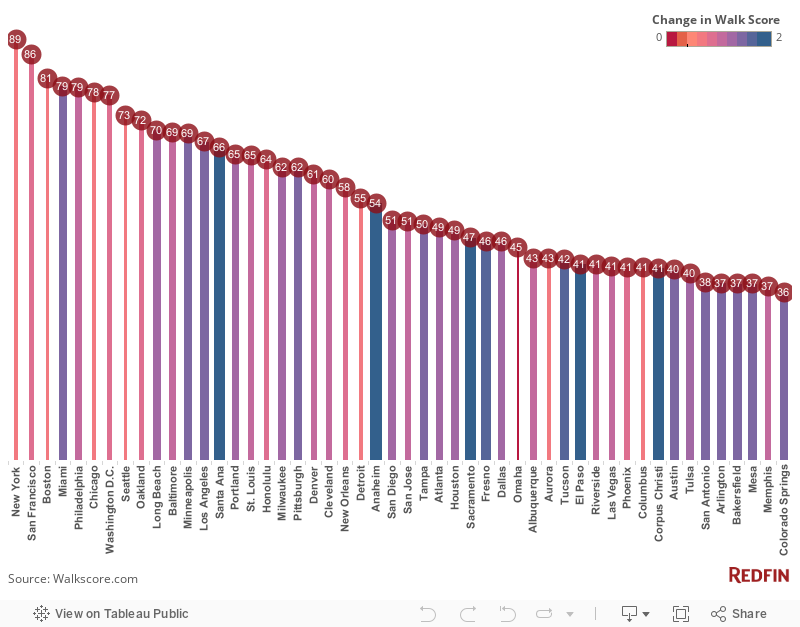
The nation’s most walkable cities are becoming even more walkable. Of the top 50 most walkable cities only one, Omaha, Nebraska, saw its Walk Score decline, and it only decreased 0.3 points from last year.
Walk Score measures the walkability of a location based on its distance from amenities, density of population, block length and pedestrian friendliness. The annual ranking identifies the most walkable U.S. cities with populations of more than 300,000.

Changes in the Top Five
Miami’s steady increase in walkability can be attributed to builders and city officials embracing the idea of densely populated neighborhoods.
“Developers are seeing an overall trend in people who desire to live, work and play within the same neighborhood,” said Aaron Drucker, a Redfin real estate agent in Miami. “Developers have focused on popular, urban neighborhoods like Wynwood, Midtown, Brickell, South Beach and Coconut Grove, constructing high rises, multi-family homes and condominiums.This has led to population increases, creating density that didn’t exist in Miami years ago.”
Despite Philadelphia’s drop in rank, the city’s walkability continues to increase. The city of brotherly love saw its Walk Score increase from 78.3 last year to 79.0 in 2017.
“Some main retail arteries that run through hot residential areas are experiencing a huge renaissance,” said Philadelphia Redfin agent Jennifer Seal. “The likelihood that there’s a new grocery store, coffee shop or even spinning studio within blocks of many Philadelphia homes has greatly increased in recent years.”
Changes in the Top 50
Fresno, California experienced a healthy surge, moving up two places in the top 50 and increasing its Walk Score from 45.1 in 2016 to 46.3 this year. Also making moves in 2017 is El Paso, Texas with an impressive leap from 40.0 to 41.5. The Virginia neighborhood in El Paso was named one of Texas’ 10 most walkable neighborhoods.
Columbus, Ohio dropped three places from 38th to 41st most walkable city in the country this year; still the Ohio capital remains in the top 50 with a Walk Score® of 40.7. St. Louis (64.5), Dallas (46.2), Omaha (45.1), Aurora (42.6) and Riverside (41.3) were the other cities to drop rank in the top 50, albeit only one spot each.
Why Walkability Matters
Our goal at Redfin and Walk Score is to help people find the right home, not just any home, and what often makes a home “right” is location. Walkability is about convenience, quality of life and everything outside the four walls of a house. When you live near the people and places you enjoy most, you can spend less time and money on transit and more time doing what you love.
For the full ranking of America’s most walkable cities, click here. To see how your home fares in terms of walkability, get your score here. If you’re looking to buy, Redfin features Walk Score on listings of homes for sale. Renters can use Walk Score’s Apartment Search to find a rental home in a walkable neighborhood.
Methodology
To calculate the rankings, Walk Score analyzed over 10 million locations and computed more than 2 billion walking routes for 2,500 U.S. cities. The Walk Score algorithm incorporates walking routes, the number of nearby amenities (e.g. restaurants, coffee shops and grocery stores), respective distance to those amenities, pedestrian friendliness, population and neighborhood boundary data.
 United States
 Canada