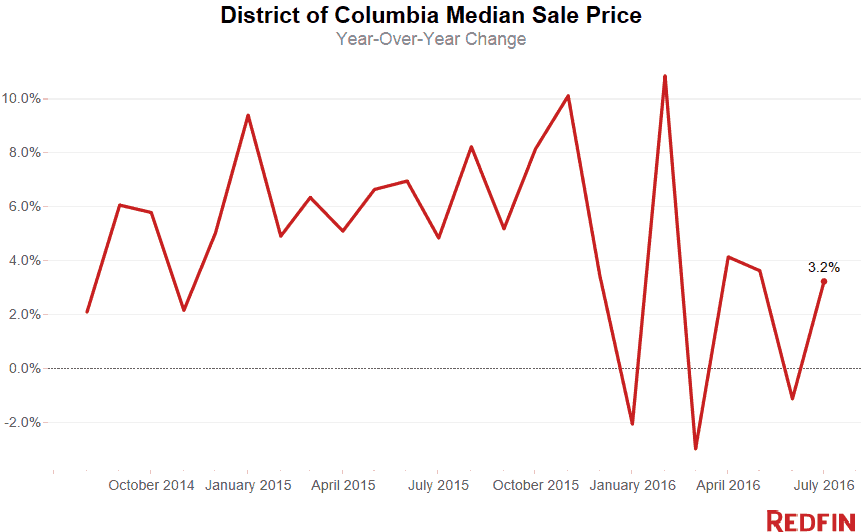
Washington, D.C., home prices increased 3.2 percent in July from a year earlier to a median sale price of $558,000. After prices declined in June, the peak of the real estate season, homeowners in the District welcomed July’s price appreciation.
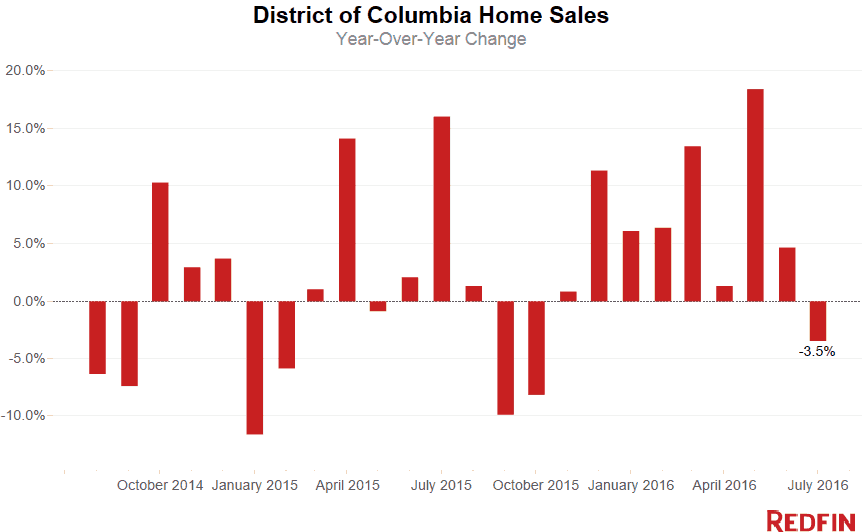
Sales fell 3.5 percent, but that decline may be deceiving because homes sales last July were particularly strong. Nearly 1,000 homes sold in the District last month, which is fewer than last July, but relatively strong based on historical sales trends. Overall, the District has had strong sales this year with year-over-year growth every month except July, despite the fact that the number of homes for sale remains low.
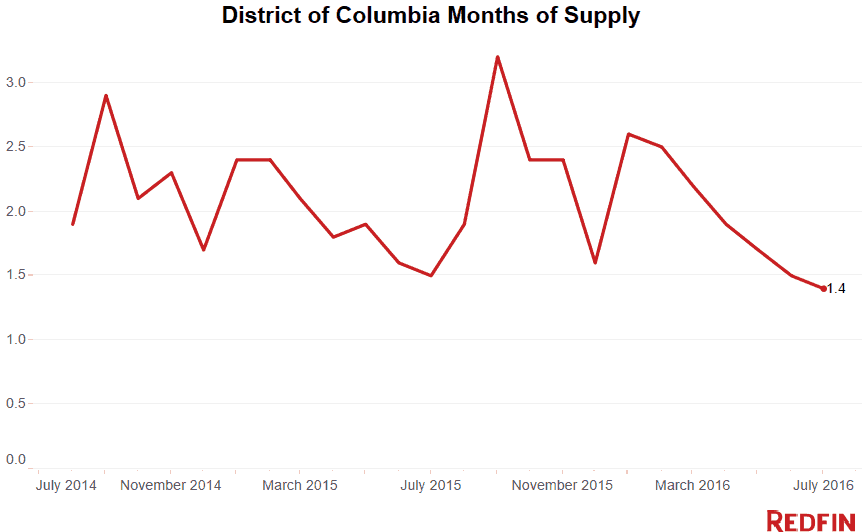
The overall number of properties for sale declined 9.6 percent since last July, resulting in just 1.4 months of supply on the market—the lowest level on record since 2009.
Redfin’s latest Demand Index indicates that buyer demand for homes in June, measured in terms of the number of people touring homes and writing offers, is on par with where we expect it to be at this time of year.
Solid buyer demand coupled with the shortage of inventory kept conditions competitive. The typical home found a buyer in 15 days and 37 percent of homes were bid up, selling for more than their initial asking price.
With prices up and buyer demand strong, what’s keeping sellers from listing their homes for sale? Redfin agent Steve Centrella says trade-up buyers are in a bind.
“Many residents want to stay in the city and upgrade to a larger or nicer home. They’re confident about being able to sell their home for a good price but worry about finding a suitable one to move to given rising prices and competition,” Centrella said. “The high demand across pretty much every price point limits flexibility and fluidity in the market, which further exacerbates the low inventory situation. Hopefully, we’ll see more homes hit the market after Labor Day, as we’ve seen in prior years.”
What’s Happening in the D.C. Metro Region?
Across the broader D.C., Maryland and Virginia region, the median sale price fell 3.8 percent in July from last year, to $375,000. July was the sixth month in a row that prices have fallen year over year. Home sales declined 6.3 percent compared to last year.
The number of homes listed in July fell 11.7 percent, pushing the total number of properties for sale down by 20.2 percent from last year. The region had a 2.4-month supply of homes for sale. The typical home found a buyer in 24 days.
Washington, D.C., Neighborhood Trends
Buyer interest, prices and sales have been strong in several Northeast neighborhoods this year. The median sale price increased nearly 18 percent compared to last year in both Takoma and Woodridge/Fort Lincoln, while sales surged 50 percent and 20 percent respectively.
At the risk of sounding like a broken record, it’s worth noting that Mount Pleasant continued its reign as one of the hottest ‘hoods in the District. The typical home in Mount Pleasant sold in just six days – the fastest of all D.C. neighborhoods Redfin tracks – and for nearly 4 percent over asking price. Named by Redfin as one of the hottest neighborhoods of 2016, Mount Pleasant has been among the neighborhoods with the lowest median days on market and the highest sale-to-list price ratio.
See our city page for the most up-to-date data on Washington-area home prices.
Here’s what’s happening in your neighborhood:
| Place | Median Sale Price | Year-Over-Year | Homes Sold | Year-Over-Year | Inventory | Year-Over-Year | New Listings | Median Days on Market | Avg Sale-to-List |
|---|---|---|---|---|---|---|---|---|---|
| Adams Morgan / Kalorama Heights / Lanier Heights | $493,500 | -12.7% | 124 | -15.1% | 54 | -12.9% | 122 | 15 | 99.9% |
| Alexandria | $463,100 | 6.5% | 574 | -4.5% | 1,156 | -15.9% | 560 | 26 | 98.7% |
| American University Park / Friendship Heights / Tenleytown | $1,050,000 | 10.5% | 71 | 20.3% | 12 | -47.8% | 47 | 7 | 103.1% |
| Arlington | $593,000 | -2.8% | 302 | -22.4% | 649 | -15.1% | 318 | 22 | 98.7% |
| Atlas District | $681,950 | -1.2% | 82 | 36.7% | 27 | -3.6% | 74 | 13 | 100.4% |
| Bellevue / Congress Heights / Washington Highlands | $230,000 | 6.0% | 49 | 22.5% | 47 | 0.0% | 69 | 44 | 97.9% |
| Benning Heights / Capitol View / Marshall Heights | $237,500 | 8.0% | 64 | 77.8% | 32 | -21.9% | 58 | 16 | 103.1% |
| Bethesda | $722,500 | -16.2% | 106 | -27.9% | 402 | 1.5% | 95 | 27 | 97.9% |
| Bloomingdale | $699,000 | -6.2% | 59 | 68.6% | 12 | -14.3% | 52 | 12 | 100.5% |
| Capitol Hill | $850,000 | 6.9% | 145 | -2.7% | 36 | -42.9% | 113 | 9 | 101.2% |
| Chevy Chase-DC | $975,000 | 0.0% | 63 | 3.3% | 29 | 3.6% | 64 | 8 | 101.3% |
| Chinatown / Mount Vernon Square / Penn Quarter | $514,439 | 2.9% | 119 | -10.5% | 38 | -44.1% | 88 | 20 | 99.3% |
| Cleveland Park | $466,000 | -41.2% | 39 | 8.3% | 18 | -33.3% | 37 | 18 | 101.1% |
| College Park | $300,000 | -0.8% | 21 | 75.0% | 28 | -44.0% | 31 | 14 | 99.7% |
| Columbia Heights | $578,500 | -1.1% | 148 | 35.8% | 63 | 12.5% | 130 | 18 | 100.2% |
| Congress Heights | $249,500 | -16.8% | 26 | 116.7% | 30 | 20.0% | 40 | 47 | 99.4% |
| Deanwood | $239,500 | 11.4% | 18 | -14.3% | 14 | -36.4% | 32 | 21 | 97.1% |
| Dupont Circle | $425,000 | 1.9% | 145 | 15.1% | 53 | 6.0% | 139 | 11 | 99.7% |
| Eckington | $617,500 | 3.1% | 42 | 133.3% | 16 | -30.4% | 28 | 14 | 99.1% |
| Edgewood | $459,650 | -24.0% | 37 | 42.3% | 19 | 58.3% | 50 | 8 | 102.1% |
| Fairlawn / Twining / Randle Highlands / Penn Branch | $321,500 | 14.6% | 52 | 26.8% | 34 | -10.5% | 59 | 31 | 99.5% |
| Foggy Bottom / George Washington University / West End | $422,500 | 2.5% | 76 | -7.3% | 49 | -32.9% | 86 | 14 | 98.7% |
| Fort Totten / Lamont Riggs / Pleasant Hill / Queens Chapel | $468,500 | 11.3% | 48 | 0.0% | 16 | -48.4% | 37 | 14 | 100.3% |
| Foxhall / Palisades / Spring Valley / Wesley Heights | $1,310,000 | 19.4% | 81 | -3.6% | 70 | 6.1% | 88 | 30 | 97.7% |
| Georgetown | $957,500 | -24.2% | 82 | -8.9% | 69 | 9.5% | 101 | 20 | 97.5% |
| Glover Park / Cathedral Heights / McLean Gardens | $467,500 | 5.3% | 148 | -3.3% | 85 | 21.4% | 144 | 21 | 98.5% |
| Greenway / Benning / Dupont Park / River Terrace | $242,100 | 8.8% | 27 | 50.0% | 14 | -26.3% | 33 | 22 | 96.1% |
| Hill East | $709,800 | 5.7% | 89 | 14.1% | 19 | -47.2% | 70 | 11 | 101.1% |
| Historic Anacostia | $310,500 | 29.4% | 12 | 50.0% | 12 | 71.4% | 17 | 29 | 100.9% |
| Howard University / Le Droit Park | $675,000 | 10.7% | 69 | -8.0% | 32 | -8.6% | 85 | 11 | 100.9% |
| Kingman Park | $495,000 | 8.8% | 51 | 8.5% | 13 | -51.9% | 46 | 17 | 100.0% |
| Logan Circle-Shaw | $666,950 | 3.4% | 106 | 1.9% | 38 | 26.7% | 125 | 8 | 101.8% |
| Logan Circle-Shaw | $675,000 | 3.9% | 129 | 12.2% | 42 | -12.5% | 140 | 12 | 101.1% |
| Massachusetts Avenue Heights | $456,000 | 23.3% | 57 | 39.0% | 25 | 8.7% | 53 | 18 | 99.5% |
| Mount Pleasant | $875,000 | 10.4% | 49 | 69.0% | 6 | 0.0% | 45 | 6 | 103.7% |
| Navy Yard | $476,500 | -9.7% | 14 | -30.0% | 8 | 166.7% | 17 | 14 | 99.8% |
| NoMa | $699,500 | 0.7% | 36 | 20.0% | 11 | -38.9% | 28 | 14 | 98.7% |
| Petworth | $657,500 | 8.7% | 86 | -3.4% | 47 | 67.9% | 112 | 7 | 100.9% |
| Pleasant Plains | $629,950 | 9.6% | 32 | -15.8% | 13 | 44.4% | 29 | 13 | 102.2% |
| Rockville | $435,000 | -19.4% | 159 | -27.7% | 449 | -18.7% | 148 | 22 | 98.9% |
| Silver Spring | $340,500 | -9.2% | 262 | -13.8% | 576 | -26.9% | 254 | 20 | 99.3% |
| Southwest / Waterfront | $320,000 | -1.2% | 57 | -12.3% | 25 | 8.7% | 59 | 13 | 99.5% |
| Stanton Park | $686,000 | -6.5% | 135 | 18.4% | 40 | -11.1% | 115 | 8 | 101.6% |
| Takoma | $445,000 | 17.9% | 15 | 50.0% | 3 | 50.0% | 10 | 10 | 100.9% |
| Trinidad / Arboretum / Ivy City | $425,000 | 0.2% | 59 | -18.1% | 35 | 0.0% | 75 | 31 | 99.5% |
| Truxton Circle | $680,000 | -2.9% | 23 | 109.1% | 4 | -77.8% | 15 | 41 | 97.8% |
| Union Station / Kingman Park / Stanton Park | $645,000 | 2.9% | 191 | 15.1% | 63 | -13.7% | 180 | 10 | 100.8% |
| Van Ness / Forest Hills / Wakefield | $480,000 | -1.0% | 43 | -18.9% | 20 | -20.0% | 44 | 17 | 99.5% |
| Woodley Park | $854,500 | 46.1% | 26 | 30.0% | 9 | -30.8% | 24 | 10 | 101.2% |
| Woodridge | $525,000 | NA | 1 | NA | NA | NA | NA | 278 | 100.0% |
| Woodridge-Fort Lincoln | $499,500 | 17.5% | 30 | 20.0% | 15 | -25.0% | 24 | 29 | 99.0% |
| Washington, DC | $557,500 | 3.2% | 979 | -3.5% | 1,341 | -9.6% | 847 | 15 | 100.0% |
NOTE: Not all neighborhoods are listed, but totals for Washington, D.C., encompass entire city. Data is based on listing information and might not reflect all real estate activity in the market. Neighborhood-specific data is measured over the three months ended July 31. Inventory measures listings active as of July 31.
For more information, contact Redfin journalist services:
Phone: 206-588-6863
Email: press@redfin.com
See Redfin’s data center to find out what’s happening in other cities.
To be added to Redfin’s press release distribution list, subscribe here.
 United States
 Canada