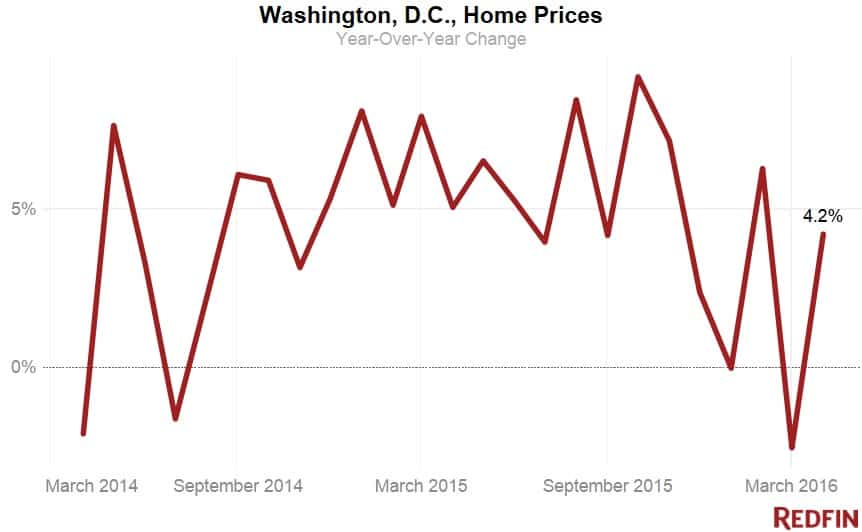
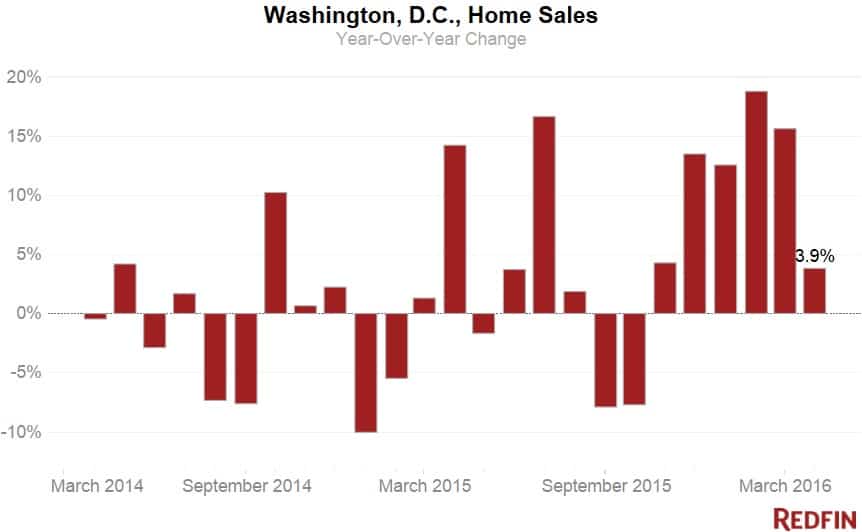
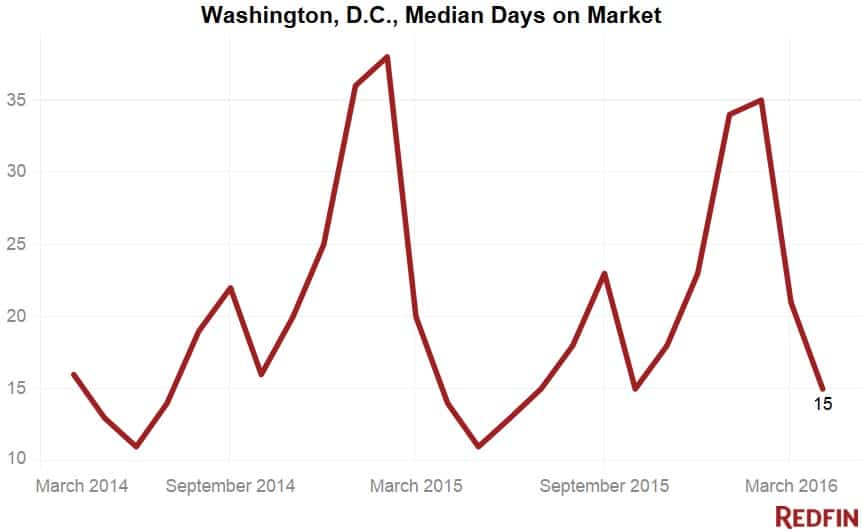
Home prices in Washington, D.C., rose 4.2 percent in April from a year earlier, with the typical home selling for $520,000. Sales increased 3.9 percent over the same period, with the typical home finding a buyer in just 15 days.
Sellers put 2.4 percent fewer homes on the market in April compared to a year ago, the first slowdown in new for-sale listings in almost a year. As a result, the overall number of homes for sale dipped nearly 1 percent and supply tightened.
The city had a 1.7-month supply of homes for sale, far below the six months that signals a balance between buyers and sellers. It was the first time this year that the supply of homes for sale fell to less than two months, meaning buyers continued to face fierce competition. Buyers bid up prices on nearly 40 percent of homes sold in April, the highest level since last summer.
David Ehrenberg, a Redfin agent in Washington, D.C., said it’s important that buyers are mentally prepared for the frenetic pace of the local housing market. “When competing against five to 10 offers is the norm, my role is to help buyers understand the various levers they can pull to make their offer stand apart,” said Ehrenberg. “Sellers are not just concerned with the price, but are also factoring in the buyer’s financial strength, the lender, the personal letter, the closing timing, the contingencies. Depending on their situation, sellers prioritize different things and so we tailor our offer strategy.”
What’s Happening in the D.C. Metro Region?
Across the broader D.C., Maryland and Virginia region, the median sale price increased 0.5 percent from a year earlier to $369,000. Sales were up 7.1 percent year over year.
The number of new homes put up for sale in the region fell 3.1 percent, sending the total number of properties for sale down nearly 11 percent compared to last year. The region had a 2.7-month supply of homes for sale.
The typical home found a buyer in 22 days. That was twice as fast as sales in March and about a week faster than April of last year. More than a fourth of homes sold for more than sellers were asking.
Washington, D.C., Neighborhood Trends
Prices jumped the most in Benning Heights/Capitol View/Marshall Heights (39.2%), Pleasant Plains (36.8%), Massachusetts Avenue Heights (32.9%) and Mount Pleasant (29.3%).
AU Park/Tenleytown was the fastest-moving neighborhood, with the typical home finding a buyer in seven days. Sixty percent of homes in the community sold for more than asking price.
See our city page for the most up-to-date data on Washington-area home prices.
Here’s what’s happening in your neighborhood:
| Place | Median Sale Price | Year-Over-Year | Homes Sold | Year-Over-Year | Inventory | Year-Over-Year | New Listings | Median Days on Market | Avg Sale-to-List |
|---|---|---|---|---|---|---|---|---|---|
| 16th Street Heights | $645,000 | 12.2% | 27 | -32.5% | 28 | 33.3% | 59 | 28 | 99.5% |
| Adams Morgan / Kalorama Heights / Lanier Heights | $505,000 | 8.9% | 80 | -4.8% | 78 | 4.0% | 142 | 20 | 99.2% |
| Alexandria | $444,000 | -0.7% | 493 | 6.0% | 1,157 | -2.7% | 826 | 15 | 98.6% |
| American University Park / Friendship Heights / Tenleytown | $1,030,000 | 9.9% | 25 | -41.9% | 16 | -20.0% | 59 | 7 | 104.6% |
| Arlington | $549,900 | -8.0% | 265 | 9.5% | 669 | -1.0% | 464 | 14 | 99.1% |
| Atlas District | $660,625 | -5.0% | 62 | 59.0% | 30 | 30.4% | 86 | 29 | 99.5% |
| Bellevue / Congress Heights / Highlands | $205,000 | -16.3% | 29 | -21.6% | 31 | -29.5% | 49 | 47 | 98.6% |
| Benning Heights / Capitol View / Marshall Heights | $257,450 | 39.2% | 44 | -6.4% | 21 | -46.2% | 72 | 29 | 99.4% |
| Bethesda | $800,000 | -7.5% | 101 | -22.9% | 421 | 18.9% | 218 | 17 | 98.6% |
| Bloomingdale | $680,000 | -2.9% | 36 | -2.7% | 18 | 63.6% | 58 | 14 | 100.7% |
| Capitol Hill | $749,750 | 2.9% | 96 | 28.0% | 56 | 36.6% | 145 | 10 | 101.3% |
| Chevy Chase-DC | $941,415 | -9.0% | 46 | 12.2% | 29 | 20.8% | 71 | 12 | 101.4% |
| Chinatown / Mount Vernon Square / Penn Quarter | $469,000 | -0.6% | 69 | -6.8% | 55 | -15.4% | 119 | 14 | 99.6% |
| Cleveland Park | $365,000 | -24.8% | 25 | 31.6% | 19 | -5.0% | 35 | 63 | 99.6% |
| College Park | $277,500 | 38.8% | 16 | 45.5% | 25 | -21.9% | 19 | 23 | 99.3% |
| Columbia Heights | $549,900 | -5.2% | 111 | 19.4% | 84 | 61.5% | 179 | 12 | 101.1% |
| Congress Heights | $270,000 | 22.0% | 11 | -54.2% | 17 | -29.2% | 25 | 50 | 95.8% |
| Deanwood | $229,500 | 2.0% | 28 | 64.7% | 17 | 13.3% | 30 | 29 | 98.6% |
| Dupont Circle | $411,750 | 2.9% | 88 | 1.1% | 57 | 0.0% | 152 | 17 | 100.0% |
| Eckington | $538,000 | -9.9% | 20 | -23.1% | 26 | 62.5% | 46 | 17 | 99.7% |
| Edgewood | $507,425 | -15.0% | 28 | 133.3% | 12 | 0.0% | 27 | 19 | 103.8% |
| Fairlawn / Twining / Randle Highlands / Penn Branch | $259,067 | 4.7% | 33 | 17.9% | 32 | -15.8% | 48 | 43 | 98.6% |
| Foggy Bottom / George University / West End | $373,000 | -32.8% | 52 | 0.0% | 46 | -9.8% | 88 | 41 | 99.3% |
| Fort Totten / Lamont Riggs / Pleasant Hill / Queens Chapel | $365,000 | -2.6% | 43 | 26.5% | 17 | -37.0% | 48 | 19 | 100.3% |
| Foxhall / Palisades / Spring Valley / Wesley Heights | $950,000 | -14.1% | 52 | 23.8% | 73 | 9.0% | 98 | 22 | 99.2% |
| Georgetown | $1,095,000 | 14.8% | 71 | 36.5% | 64 | 8.5% | 102 | 31 | 98.6% |
| Glover Park / Cathedral Heights / McLean Gardens | $399,999 | 9.6% | 89 | 7.2% | 89 | 1.1% | 149 | 25 | 99.0% |
| Greenway / Benning / Dupont Park / River Terrace | $278,000 | 26.4% | 15 | -21.1% | 8 | -55.6% | 25 | 14 | 99.0% |
| Hill East | $700,000 | 9.6% | 51 | -3.8% | 28 | 3.7% | 81 | 10 | 101.0% |
| Historic Anacostia | $269,450 | -40.1% | 14 | 1300.0% | 10 | 150.0% | 16 | 19 | 100.7% |
| Howard University / Le Droit Park | $659,000 | 27.2% | 49 | -21.0% | 27 | 17.4% | 82 | 8 | 100.9% |
| Kingman Park | $490,000 | 2.7% | 51 | 8.5% | 19 | -13.6% | 44 | 53 | 99.6% |
| Logan Circle-Shaw | $704,000 | 5.1% | 78 | 16.4% | 38 | 8.6% | 131 | 9 | 102.3% |
| Logan Circle-Shaw | $680,000 | 3.0% | 91 | 4.6% | 45 | 9.8% | 151 | 10 | 102.0% |
| Massachusetts Avenue Heights | $485,000 | 32.9% | 43 | 87.0% | 29 | -17.1% | 57 | 25 | 99.2% |
| Mount Pleasant | $682,500 | 29.3% | 24 | 26.3% | 5 | -44.4% | 31 | 34 | 99.9% |
| Navy Yard | $465,264 | 4.2% | 10 | -28.6% | 5 | -16.7% | 14 | 18 | 99.3% |
| NoMa | $662,625 | 2.2% | 32 | 128.6% | 15 | 66.7% | 40 | 14 | 99.4% |
| Petworth | $612,000 | 6.4% | 65 | -13.3% | 37 | -11.9% | 107 | 15 | 100.8% |
| Pleasant Plains | $570,000 | 36.8% | 35 | 25.0% | 15 | -11.8% | 43 | 16 | 101.2% |
| Rockville | $477,000 | -4.6% | 142 | -10.7% | 418 | -7.9% | 276 | 14 | 98.4% |
| Silver Spring | $360,000 | -1.1% | 236 | -11.6% | 593 | -18.4% | 441 | 21 | 98.9% |
| Southwest / Waterfront | $345,000 | 11.3% | 48 | -15.8% | 29 | 16.0% | 67 | 18 | 99.3% |
| Stanton Park | $655,000 | -7.3% | 103 | 56.1% | 47 | 20.5% | 143 | 18 | 99.6% |
| Takoma | $491,000 | 19.8% | 7 | -12.5% | 4 | 300.0% | 13 | 31 | 100.7% |
| Trinidad / Arboretum / Ivy City | $425,000 | 0.8% | 51 | -7.3% | 39 | 5.4% | 76 | 52 | 100.4% |
| Truxton Circle | $614,900 | -1.6% | 13 | -35.0% | 7 | 16.7% | 20 | 83 | 100.1% |
| Union Station / Kingman Park / Stanton Park | $605,000 | 5.9% | 154 | 51.0% | 76 | 26.7% | 204 | 24 | 99.9% |
| Van Ness / Forest Hills / Wakefield | $550,000 | 1.8% | 27 | 42.1% | 19 | -24.0% | 42 | 17 | 100.1% |
| Woodley Park | $443,250 | -2.6% | 12 | -7.7% | 11 | 10.0% | 28 | 16 | 101.6% |
| Woodridge | $645,000 | NA | 1 | NA | NA | NA | NA | 23 | 97.0% |
| Woodridge-Fort Lincoln | $499,500 | -4.3% | 30 | -9.1% | 13 | -13.3% | 38 | 27 | 98.8% |
| Washington, DC | $520,000 | 4.2% | 807 | 3.9% | 1,407 | -0.8% | 1,141 | 15 | 100.3% |
NOTE: Not all neighborhoods are listed, but totals for Washington, D.C., encompass entire city. Data is based on listing information and might not reflect all real estate activity in the market. Neighborhood-specific data is measured over the three months ended April 30. Inventory measures listings active as of April 30.
For more information, contact Redfin journalist services:
Phone: 206-588-6863
Email: press@redfin.com
See Redfin’s data center to find out what’s happening in other cities.
To be added to Redfin’s press release distribution list, subscribe here.
 United States
 Canada