Cash is on the rise as affluent Americans benefit from a surging stock market and the flexibility to relocate to more affordable parts of the country.
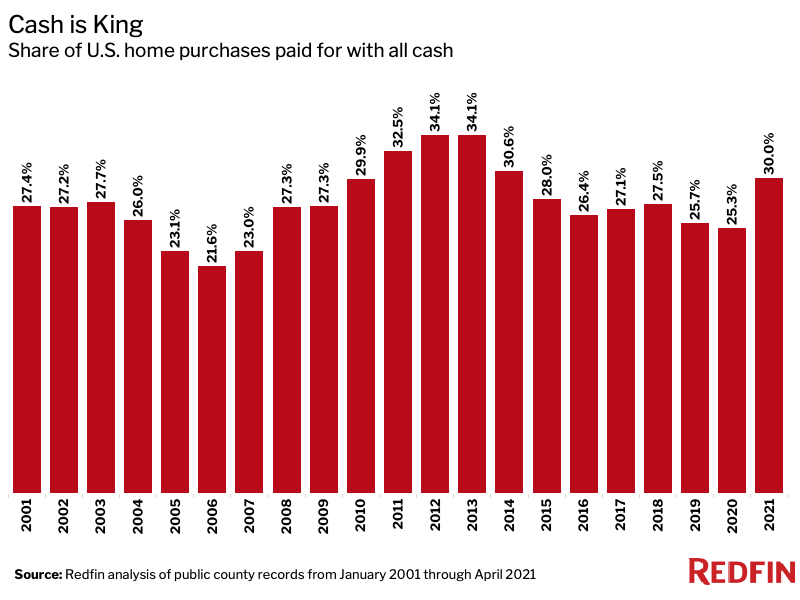
Nearly one-third (30%) of U.S. home purchases this year were paid for with all cash. That’s up from 25.3% during all of 2020 and represents the largest share since 2014, when 30.6% of homes were purchased with all cash. This is according to a Redfin analysis of county records published from January 2001 through April 2021—the most recent month for which national data was available.
Cash purchases are on the rise as Americans reap the benefits of a strong stock market. The S&P 500 Index has gained 36% in the past 12 months alone, as of July 14, 2021.
“I’ve never seen more cash in Boise’s housing market than I’ve seen in the past year,” said Shauna Pendleton, a Redfin real estate agent in Idaho. “I just sold a $700,000 home to a cash buyer last week. The entire $700,000 came from his E*Trade account.”
Additionally, remote work has allowed homeowners in expensive cities including San Francisco and New York to sell their homes and move to less expensive areas, where they can often afford to buy properties in cash.
“Affluent homeowners in Seattle, Portland and parts of California are selling their homes for $1 million or $2 million,” Pendleton said. “Then they’re coming to Boise, where they’re buying houses that are twice the size for half the price.”
Investors, who often pay in cash, are wading back into the housing market after pressing pause at the onset of the pandemic. U.S. home purchases by investors rose 2.7% year over year in the first quarter, marking the first period of growth since the coronavirus pandemic began.
The rise in all-cash home purchases is posing challenges for many first-time and lower-income homebuyers, who are having trouble competing with cash offers. While competition is easing slightly, about two-thirds of home offers written by Redfin agents still face bidding wars.
“It can be difficult to compete with an all-cash offer, but prospective buyers should keep in mind that these bids don’t always turn into purchases,” Pendleton said. “Cash buyers are frequently the first to back out because they know they can compete in the market, so they easily get buyer’s remorse if they’re worried they might be overpaying for a house. That’s often good news for financed buyers because it means fewer bids to compete with.”
In Parts of Florida, More Than Half of Homes That Have Sold This Year Were Bought With Cash
In West Palm Beach, FL, 52.6% of home purchases this year were paid for with all cash. That’s the largest share of the 86 metropolitan areas in this analysis. Metros must have had at least 3,000 home sales from January 2021 through April 2021 to be included in this report.
Naples, FL came in second place, with 52.5% of home purchases so far this year using cash. It was followed by Nassau County, NY (50.2%), North Port, FL (49.4%), Port St. Lucie, FL (46.2%), Greenville, SC (45.4%), Palm Bay, FL (44.1%), Cape Coral, FL (44.1%), Des Moines, IA (41%) and Jacksonville, FL (40.1%).
“Florida is a big second-home market, and second-home buyers often pay with cash,” said Dina Blau, a Redfin real estate agent in the West Palm Beach area. “During the pandemic, folks also flocked to Florida to buy primary homes. They sold their houses in New York, New Jersey, Chicago or California and used the proceeds to pay cash for properties in Florida.”
Blau continued: “Most of my buyers understand that competition is stiff and all-cash offers are the best way to win—even if you don’t end up actually paying in all cash. Sometimes a buyer who has enough cash will submit an all-cash bid, but ultimately finance the purchase with a loan to take advantage of low mortgage rates and avoid a lack of liquidity later on. We always let the seller know if this is the plan, and the buyer is still required to pay in cash if their financing falls through.”
Expensive California metros, where it’s more challenging to pay with cash because home prices are relatively high, were at the bottom of the list. In both San Jose, CA and Oakland, CA, 12.5% of home purchases this year used all cash—the lowest share of the metros Redfin analyzed. Next came Richmond, VA (16%), Los Angeles (16%), San Diego (16.2%), Lake County, IL (17.2%), Sacramento, CA (17.7%), San Francisco (17.8%), Oxnard, CA (18%) and Bakersfield, CA (19.3%).
Still, buyers in California aren’t out of the woods, according to Steven Moore, a Redfin real estate agent in Los Angeles.
“I recently put in a $1.8 million offer on a home that was listed at $1.7 million,” Moore said. “The top 10 offers—out of 40 total—all came in at around $2 million and were all cash.”
Metro-Level Summary of All-Cash Offers, January 2021-April 2021
Methodology
For data on homes bought with all cash, we looked at county sale records for homes purchased from January 2001 through April 2021. We define an all-cash purchase as one in which no mortgage information is included on the home deed. We used filters to remove any transactions that may not be true sales to new owners, such as quitclaim deeds.
To be included in the metro-level breakdown of this report, metros must have had at least 3,000 home sales from January 2021 through April 2021.
While the 2021 figures in this report only cover sales that have occurred so far this year, the share of cash purchases in the first half of the year typically matches the share for the full year.
 United States
 Canada