- The share of U.S. homes bought with all cash is down slightly from the peak reached earlier this year as the market cools, but still up from before the pandemic.
- All-cash sales are most prevalent in Florida.
- For buyers taking out loans, the share of homes purchased using FHA and VA loans are both up slightly from record lows as the market cools down.
- FHA loans are most prevalent in Providence, RI, and VA loans are most prevalent in Virginia Beach, VA.
Nearly one-third (31.4%) of U.S. home purchases were paid for with all cash in July, near the eight-year high reached in February and up from 27.5% a year earlier. The share of all-cash purchases jumped in early 2021 during the pandemic-driven homebuying frenzy and has remained elevated since then.
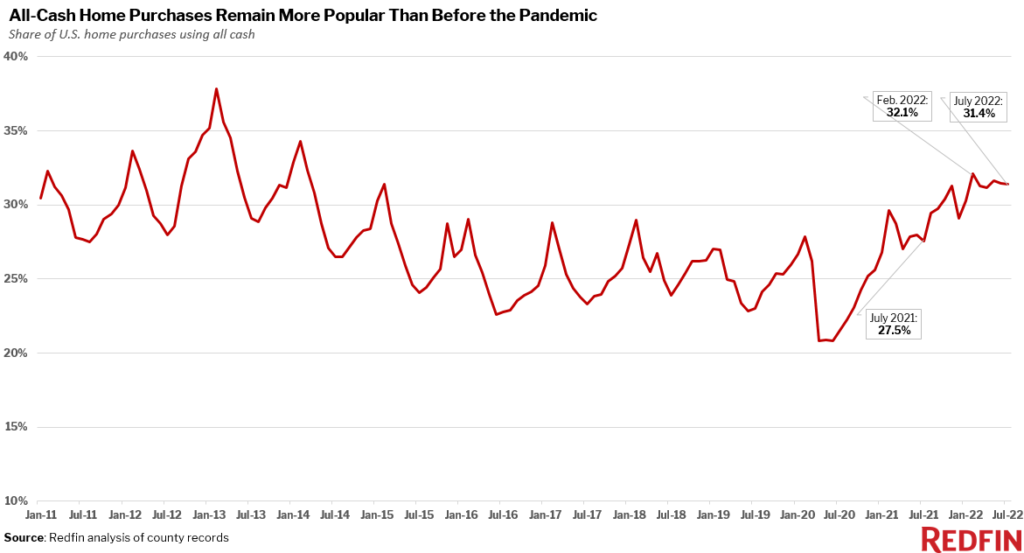
The data in this report is from a Redfin analysis of county records across 41 of the most populous U.S. metropolitan areas, going back through 2011. July 2022 is the most recent month for which data is available. An all-cash purchase is one in which there is no mortgage loan information on the deed.
All-cash purchases are prevalent with today’s affluent buyers largely because mortgage rates have doubled from a year ago, reaching 6% in mid-September. Buyers who don’t use loans avoid high interest payments that exacerbate home prices, which remain near record highs even as the housing market slows.
All-cash purchases jumped in popularity last year because they allowed buyers to stand out among fierce competition: Bidding-war rates reached record highs in early 2021 due to sub-3% mortgage rates and remote work driving homebuyer demand. Remote work has also given more Americans the option to use all cash, as it allowed a record share of homebuyers to relocate, often from expensive to affordable parts of the country. U.S. home values have skyrocketed since the start of the pandemic, which means Americans who sell a home in a pricey place like San Francisco may use equity to pay cash in a more affordable area like Las Vegas.
Investors are also contributing to the all-cash boom. Real estate investors bought up a record share of the U.S. housing stock in the fourth quarter of last year, and their share has remained above pre-pandemic levels since then. About three-quarters of investor home purchases are made with cash.
All-cash purchases are most prevalent in Florida
Four of the five metro areas with the highest share of all-cash purchases in July are in Florida, partly because the state is home to a lot of affluent buyers. We analyzed home sales in the 50 most populous metro areas, but only included 40 metros in this report due to non-disclosure of sale prices in some counties.
West Palm Beach, where 56.4% of homes were bought in cash in July, is first. Jacksonville (45.5%), Milwaukee (45.3%), Fort Lauderdale (43.3%) and Orlando (42.5%) are next.
A trio of expensive West Coast markets have the lowest share of all-cash purchases, partly because high prices make it more challenging to pay in cash: Oakland, CA (15.1%), San Jose, CA (16%) and Seattle (16.7%). Washington, D.C. (17.5%) and Pittsburgh (17.8%) round out the bottom five. For a full metro-level summary, scroll to the bottom of this report.
FHA loans are somewhat more popular than they were at the height of the market, but less prevalent than before the pandemic
Even though all-cash purchases are at an eight-year high, most home purchases use loans. Conventional loans are by far the most common type, followed by Federal Housing Administration (FHA) and Veterans Affairs (VA) loans.
More than eight in 10 (81.3%) of home sales that used a mortgage in July took out a conventional loan, down slightly from 81.9% a year earlier and down from the record high of 83.8% set in April.
Roughly 12% of home sales that used a mortgage in July took out an FHA loan, flat from a year earlier but up from the all-time low of 10.4% in the spring. And 6.8% used a VA loan, up slightly from 6.2% a year earlier but up from the record low of 5.4% in spring 2021.

An FHA loan, insured by the government and meant for low- to moderate-income borrowers and popular with first-time homebuyers, is available to people with lower down payments and lower credit scores than most conventional loans. FHA loans require a type of mortgage insurance. A VA loan, insured by the government through the U.S. Department of Veterans Affairs, is available to veterans, service members and their surviving spouses to purchase homes with little to no down payment and no private mortgage insurance.
FHA and VA loans have become a bit more popular amid the cooling market because there’s less competition for homes. That means sellers are slightly more apt to accept an offer that comes with a lower down payment and one they may view as less attractive.
“The spike in interest rates is pricing some buyers out of the market, but it’s also helping some buyers get into the market because there’s less competition,” said Tampa Redfin agent Eric Auciello. “A lot of buyers who were repeatedly outbid earlier this year are having their offers accepted, including those using FHA loans, those with smaller down payments and ones that include inspection and financing contingencies. In 2021, hardly any buyers used FHA loans. The story is completely different now, as low down payments are no longer an automatic deal breaker for sellers.”
But FHA loans are still much less prevalent than they were pre-pandemic; about 17% of mortgaged purchases used them in 2019. That’s partly because even though the market has cooled and FHA buyers are less likely to face competition, homes are still quite expensive: The typical U.S. home that sold in July cost about 8% more than a year earlier. That means a lot of the people who would use an FHA loan–lower-income, first-time homebuyers–are priced out of the market.
VA purchases are about as popular as before the pandemic; roughly 7% of mortgaged purchases used them in 2019.
The fact that the prevalence of FHA and VA loans is essentially unchanged from last year while conventional loans have become less popular suggests that the small shift away from conventional loans went to the all-cash bucket.
FHA loans most prevalent in Providence; VA loans most popular in Virginia Beach
FHA loans are most prevalent in Providence, RI, with 23.5% of mortgaged home sales in July using one. Next come Riverside, CA (23.1%), Detroit (21.8%), Las Vegas (16.9%) and Baltimore (16.4%).
Expensive West Coast markets are least likely to see FHA loans. Less than 1% of mortgaged home sales used an FHA loan in San Francisco, followed by San Jose (1.6%), Anaheim, CA (3.4%), Seattle (4%) and Oakland, CA (6.1%).
More than 4 in 10 (40.9%) of mortgaged home sales in Virginia Beach, VA used a VA loan in July, far and away the biggest share of the metros in this analysis. That stands to reason, as Virginia Beach is home to the largest military presence in the U.S. Next come Jacksonville (16.5%), San Diego (15.9%), Washington, D.C. (14.8%) and Las Vegas (12%), all of which are also home to major military bases.
| Metro-level Summary: U.S. Home Sales By Loan Type, July 2022
Share of U.S. home sales using all cash Share of U.S. mortgaged home sales using each common loan type |
||||
| U.S. metro area | Share of home sales using all cash | Share of mortgaged home sales using FHA loan | Share of mortgaged home sales using VA loan | Share of mortgaged home sales using conventional loan |
| Anaheim, CA | 26.9% | 3.4% | 2.7% | 93.9% |
| Atlanta, GA | 42.4% | 14.6% | 6.7% | 78.7% |
| Baltimore, MD | 29.2% | 16.4% | 9.9% | 73.7% |
| Charlotte, NC | 41.8% | 10.3% | 5.3% | 84.4% |
| Chicago, IL | 25.9% | 15.0% | 2.6% | 82.5% |
| Cincinnati, OH | 34.0% | 13.0% | 6.3% | 80.8% |
| Cleveland, OH | 42.1% | 16.0% | 5.5% | 78.5% |
| Columbus, OH | 27.3% | 11.5% | 4.8% | 83.6% |
| Denver, CO | 28.1% | 10.0% | 7.1% | 82.9% |
| Detroit, MI | 32.1% | 21.8% | 3.4% | 74.8% |
| Fort Lauderdale, FL | 43.3% | 10.8% | 4.3% | 84.8% |
| Jacksonville, FL | 45.5% | 12.7% | 16.5% | 70.8% |
| Las Vegas, NV | 40.4% | 16.9% | 12.0% | 71.1% |
| Los Angeles, CA | 19.6% | 11.3% | 3.0% | 85.7% |
| Miami, FL | 40.0% | 13.9% | 3.5% | 82.6% |
| Milwaukee, WI | 45.3% | 9.5% | 3.3% | 87.1% |
| Minneapolis, MN | 24.3% | 7.6% | 4.4% | 88.0% |
| Montgomery County, PA | 24.7% | 7.5% | 3.1% | 89.4% |
| Nashville, TN | 35.5% | 9.2% | 5.9% | 84.9% |
| New Brunswick, NJ | 25.9% | 10.2% | 2.4% | 87.4% |
| New York, NY | 24.9% | 8.1% | 1.0% | 90.9% |
| Newark, NJ | 19.6% | 13.8% | 2.6% | 83.5% |
| Oakland, CA | 15.1% | 6.1% | 2.4% | 91.5% |
| Orlando, FL | 42.5% | 13.5% | 8.0% | 78.5% |
| Philadelphia, PA | 30.5% | 15.6% | 2.9% | 81.5% |
| Phoenix, AZ | 38.2% | 12.4% | 8.0% | 79.6% |
| Pittsburgh, PA | 17.8% | 12.4% | 5.1% | 82.4% |
| Portland, OR | 20.4% | 9.1% | 4.9% | 86.0% |
| Providence, RI | 34.9% | 23.5% | 5.9% | 70.7% |
| Riverside, CA | 26.8% | 23.1% | 8.4% | 68.5% |
| Sacramento, CA | 21.6% | 12.5% | 7.1% | 80.5% |
| San Diego, CA | 20.1% | 6.3% | 15.9% | 77.8% |
| San Francisco, CA | 19.9% | 0.8% | 0.8% | 98.5% |
| San Jose, CA | 16.0% | 1.6% | 0.9% | 97.5% |
| Seattle, WA | 16.7% | 4.0% | 2.8% | 93.2% |
| Tampa, FL | 41.3% | 12.8% | 10.7% | 76.5% |
| Virginia Beach, VA | 18.0% | 15.4% | 40.9% | 43.7% |
| Warren, MI | 31.9% | 12.7% | 4.5% | 82.8% |
| Washington, DC | 17.5% | 11.2% | 14.8% | 73.9% |
| West Palm Beach, FL | 56.4% | 9.9% | 3.6% | 86.5% |
Editor’s note: An earlier version of this report said Long Island, NY had the highest share of all-cash purchases in July. We have removed Long Island from this report because we discovered an inconsistency in the data there.
 United States
 Canada