- In the three years after major fires, home prices rise 21% in directly-hit areas on average, compared with 33% growth just outside of fire zones.
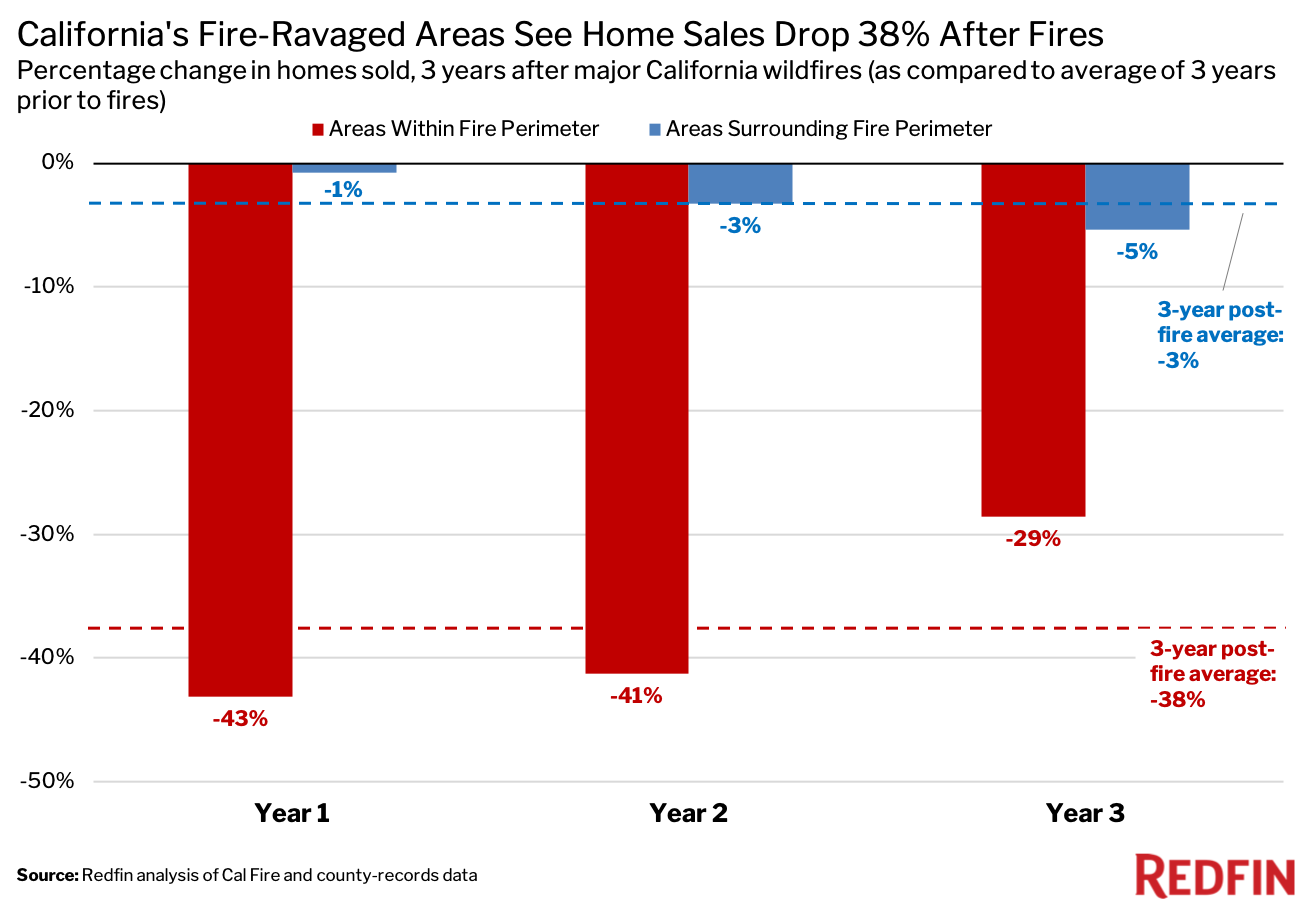
- Home purchases start to recover by year three after a fire, following a 43% plunge in the first year after the blaze.
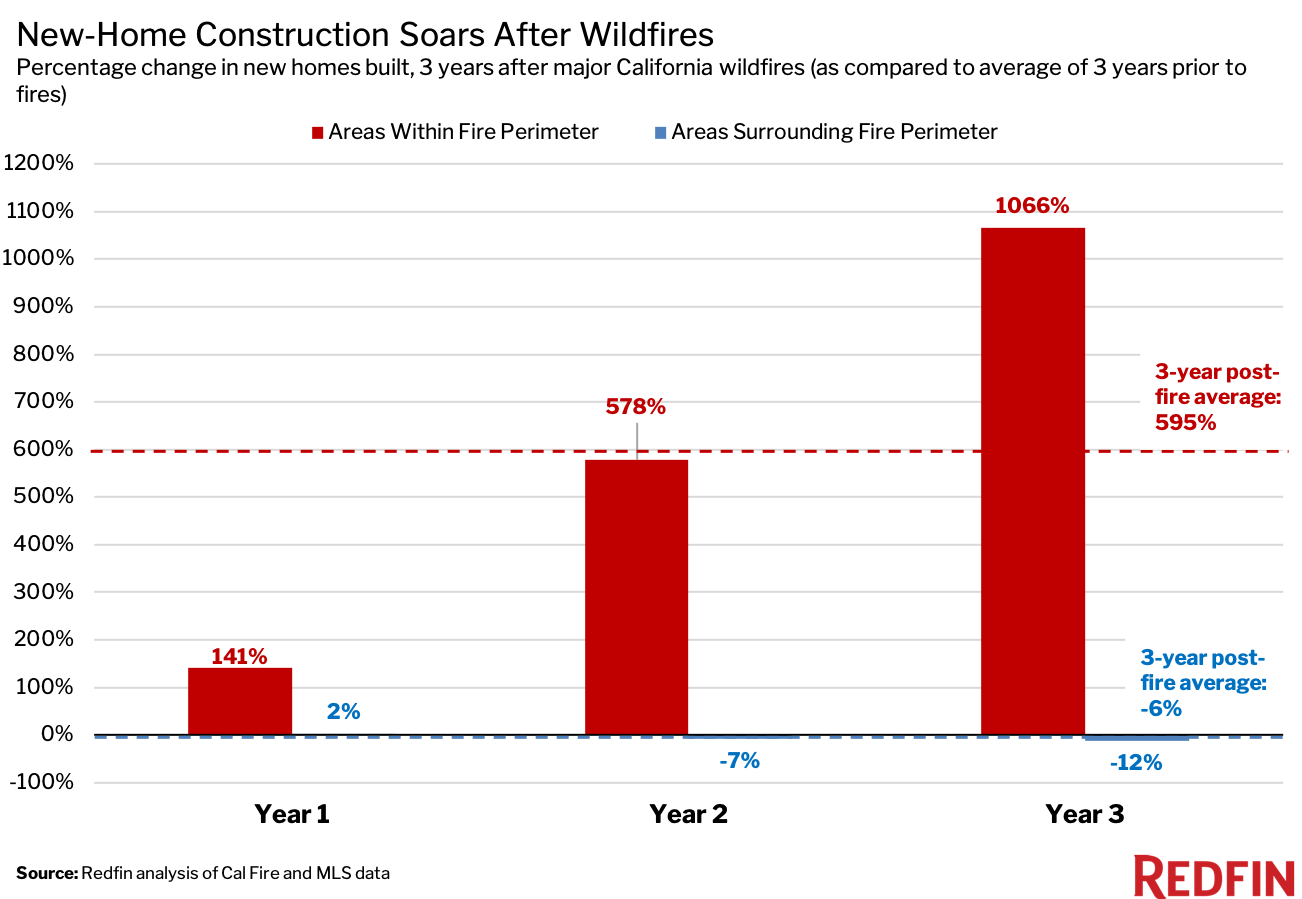
- New-home construction surges nearly 600% after fires amid efforts to rebuild, which contributes to rising prices because new homes tend to be pricier.
- All-cash home purchases jump 17% in the wake of fires as investors and builders buy up land in search of profit.
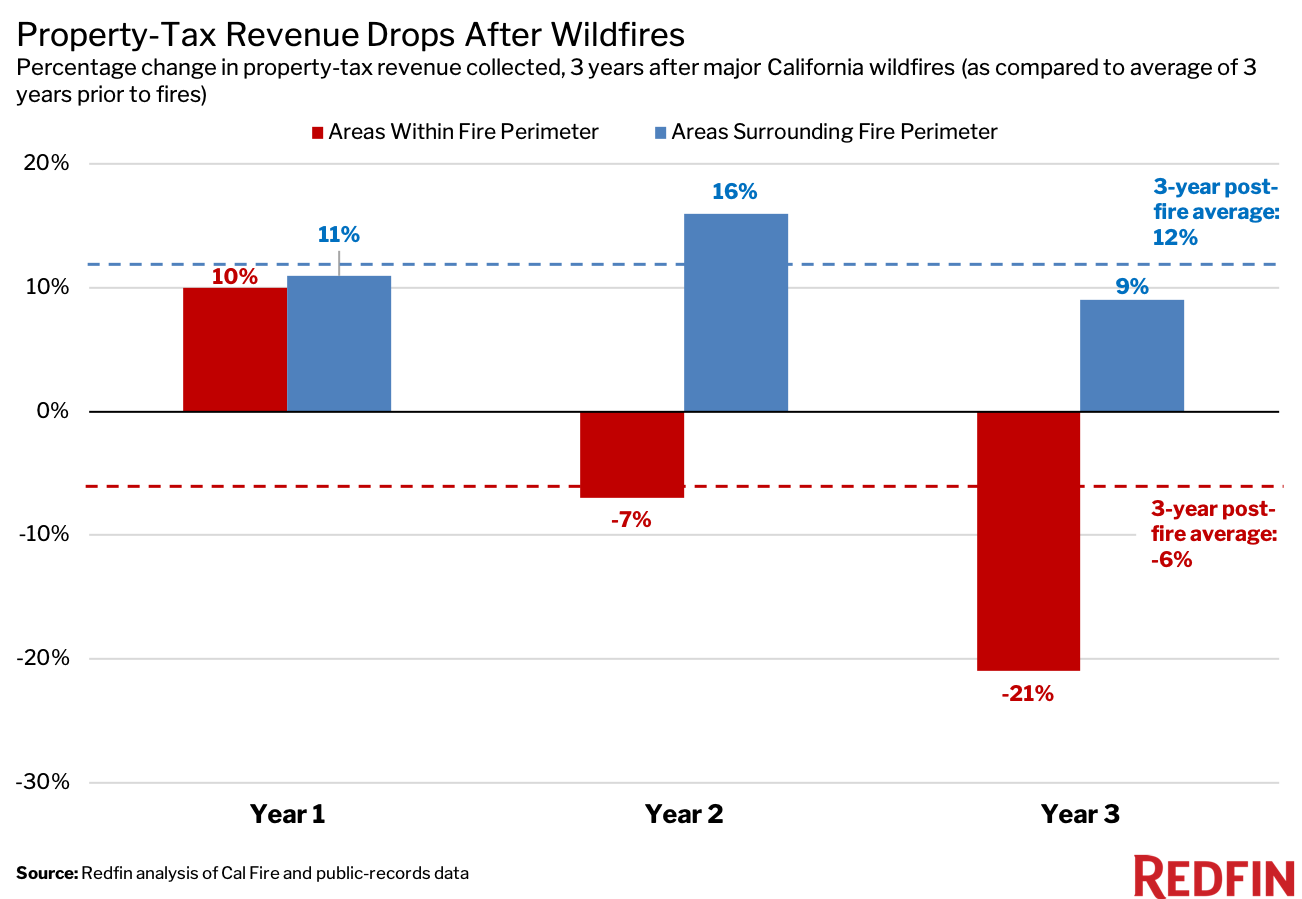
- Property-tax revenue falls 6% in areas directly hit by fires, compared with a 12% gain outside fire boundaries.
- Leaders should incentivize builders to create more housing in regions resilient to wildfires and other natural disasters.
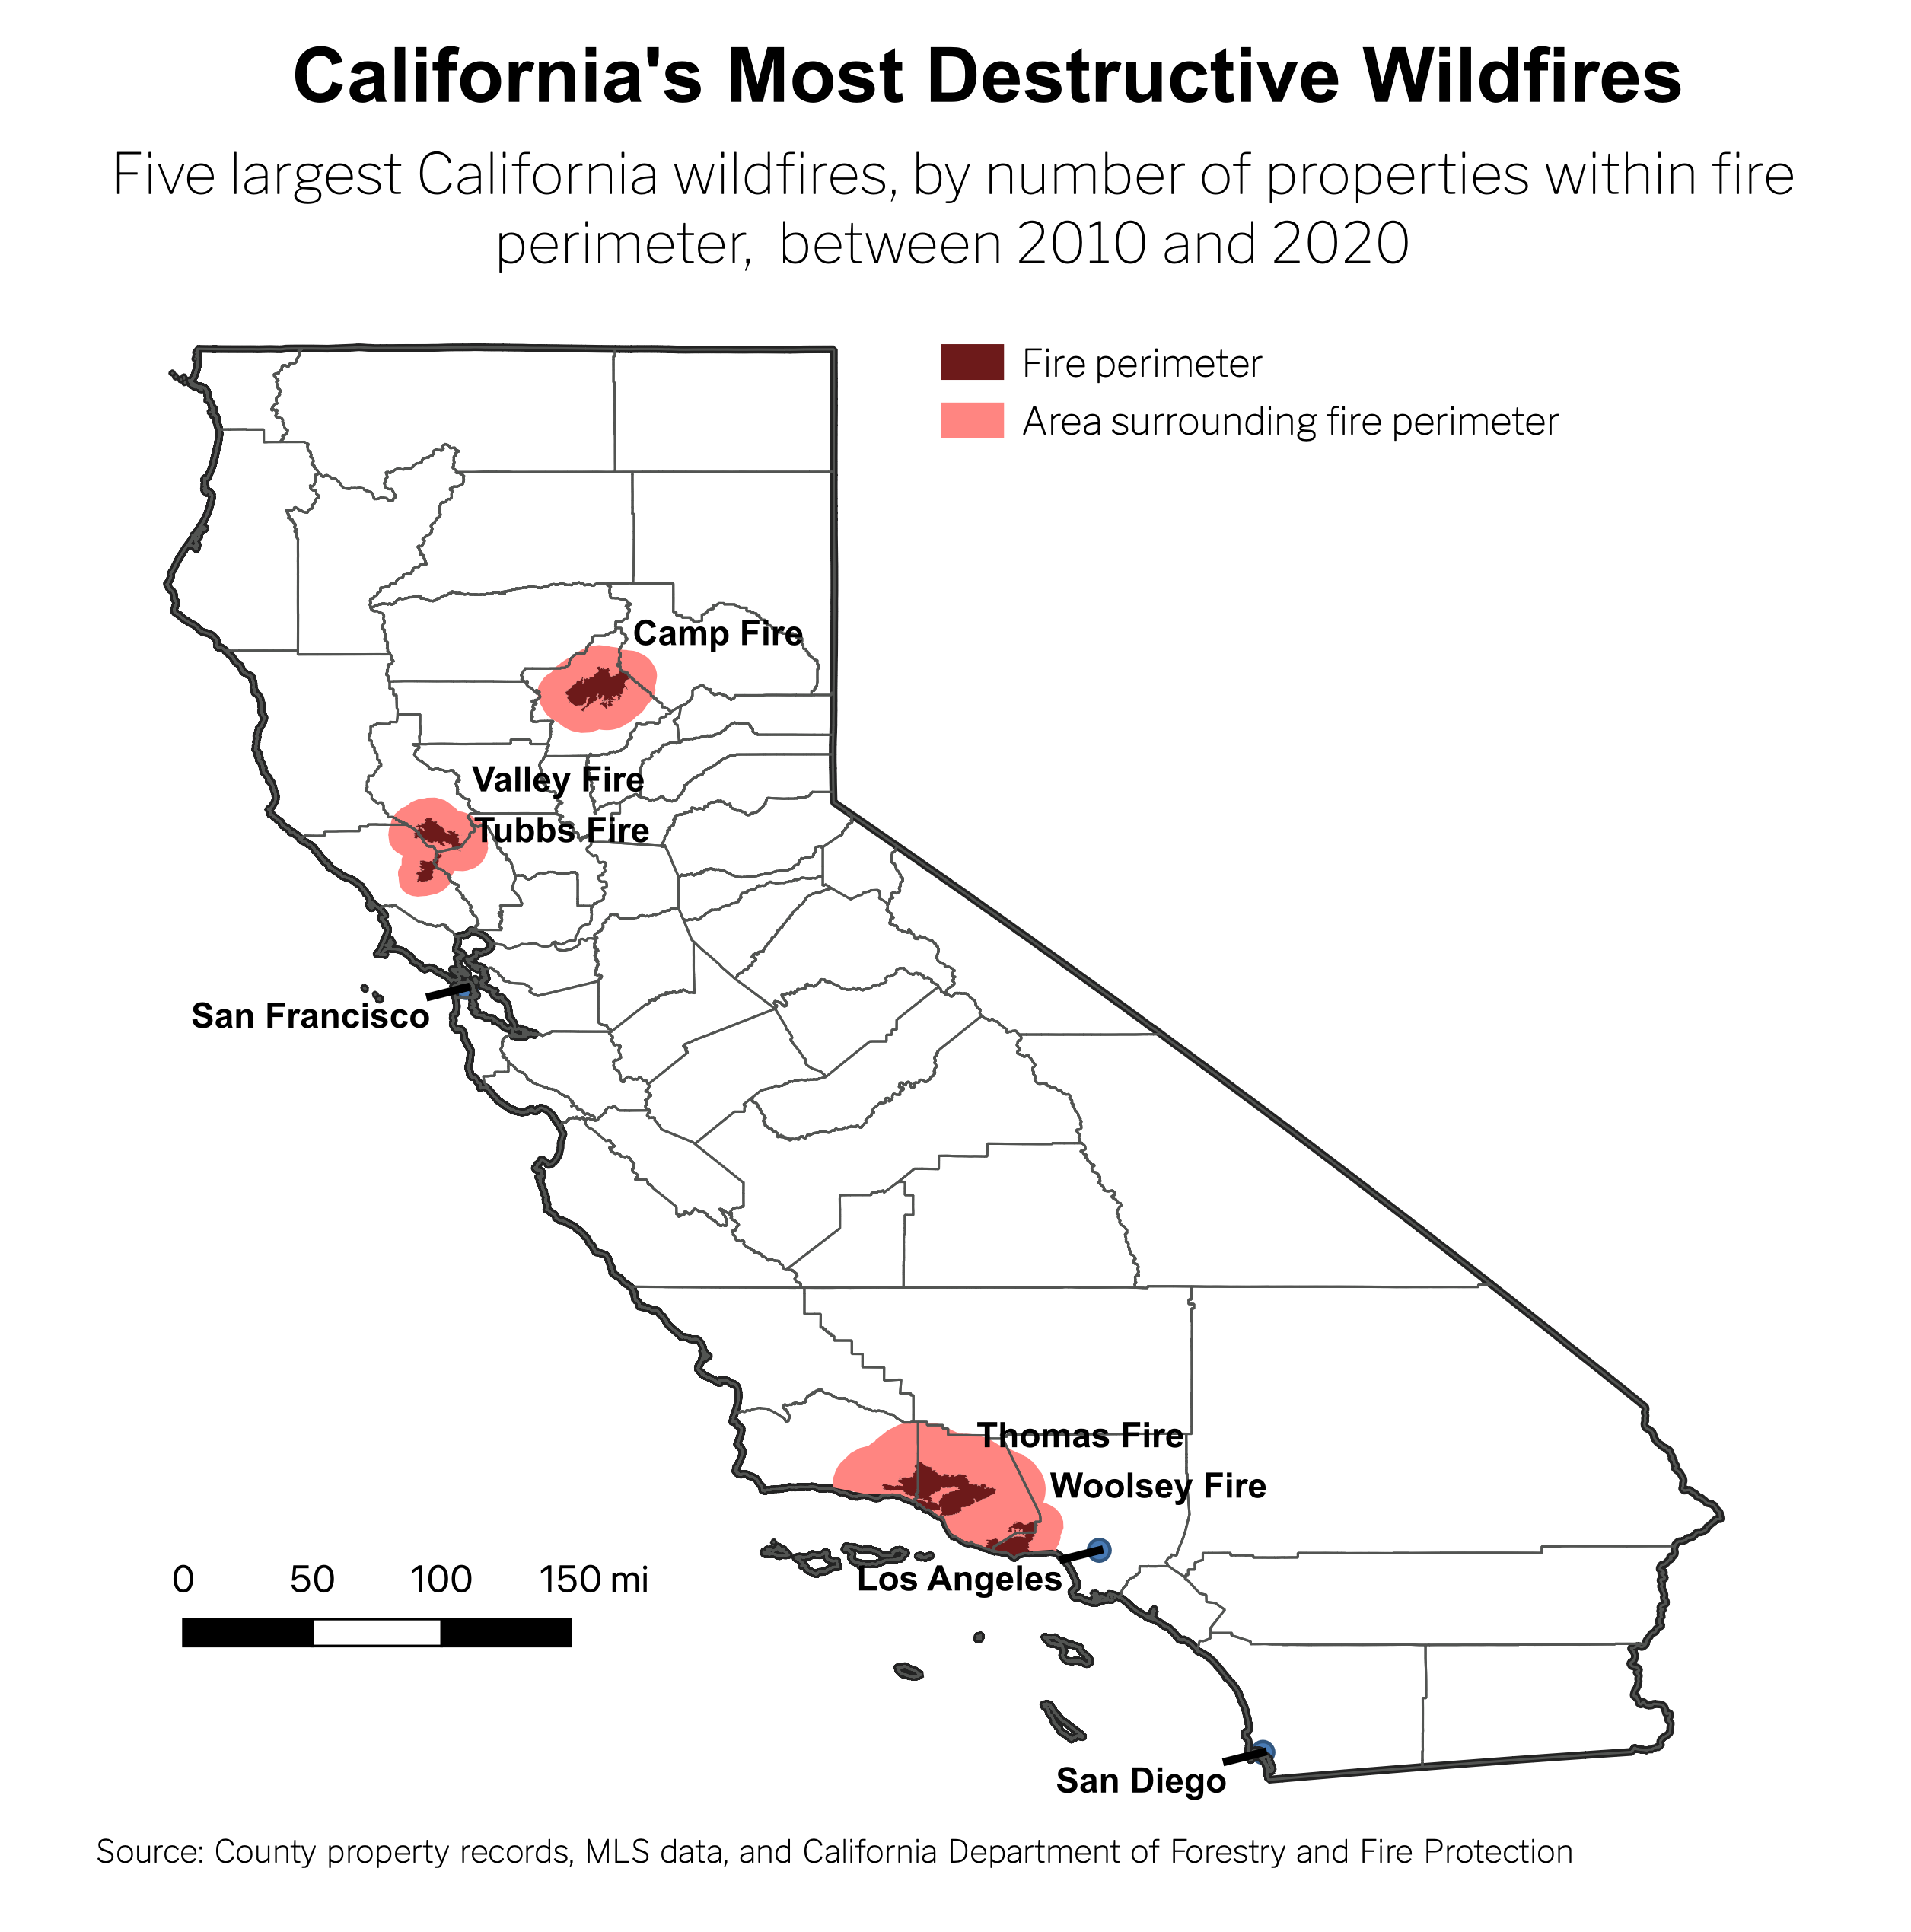
This is according to a Redfin analysis of housing-market activity following the five largest California wildfires between 2010 and 2020. We define the largest wildfires as those that had the highest number of homes inside the fire perimeters. We compare the areas inside the fire perimeters with those directly outside.
In the areas within the fire perimeters, home purchases declined by an average of 38% during the three years after the blazes. That’s in part because when homes in a community burn down, there are fewer properties available to sell, said Redfin Chief Economist Daryl Fairweather. By comparison, purchases only declined by an average of 3% in areas that surrounded the fires.
Home purchases inside the fire perimeters suffered the most during the first year after the fires, plummeting 43%. By year three, that decline had shrunk to 29%, as more homes were rebuilt and memories of the fires grew increasingly distant.
How to read the charts: The data in the charts below represent averages across all five wildfires. The charts show how home sales, prices, new construction, all-cash purchases and property taxes changed in the aftermath of the fires. In each chart, we show how a metric changed in the first, second and third years following the disasters, as well as the average change across those three years. When we measure change, we’re comparing each metric to the average seen during the three years leading up to the fires. For example, fire-ravaged areas saw 43% fewer home purchases during the first year after the fires than they saw on average during the three years before the fires. That decline narrowed to 41% in the second year after the fires and 29% in the third year. The average decline during the three years after the fires was 38%, as shown by the horizontal red line in the chart below.
“Immediately after a big wildfire, there are people who are scared to move to the area,” said Christopher Anderson, a Redfin real estate agent in Napa, CA, which was hit by the Tubbs Fire in 2017. “But with time, that fear tends to subside. In Napa, that’s partly because it’s a beautiful place where folks really want to be. People feel confident that local leaders and homeowners will prioritize fire mitigation to keep the community safe. Many rural, less populous areas aren’t so lucky.”
There are $628 billion worth of homes in California that face high fire risk, more than any other Western state analyzed by Redfin in June. Buying one of those homes comes with responsibility—much of it financial. Home-insurance premiums have skyrocketed, and private insurance companies now refuse to cover some at-risk regions. That has forced many house hunters to search for a home elsewhere or opt for the state’s insurance plan, which is significantly more expensive, Anderson said. Even with insurance, California homeowners frequently end up investing thousands of dollars in “hardening” their properties against fires. That can mean cutting back vegetation and/or replacing wood structures with metal or stone.
“Homeowners are taking a much more active approach to wildfires than ever before. People have started buying pumps for their pools so they can use the water to extinguish a fire,” Anderson said. “Local leaders are also being proactive. In some areas, they’re hiring cherry pickers to trim back flammable trees, and a new law went into effect at the start of the year that requires sellers in high-danger areas to disclose fire risk.”
Fire-Ravaged Areas See 21% Increase in Home Prices, While Areas Just Outside Fire Zones See 33% Growth
While home purchases fell in the wake of California’s most destructive wildfires, housing prices rose. In the three years after the fires, home prices climbed by 21% on average, compared with 33% growth in areas just outside the reach of the fires.
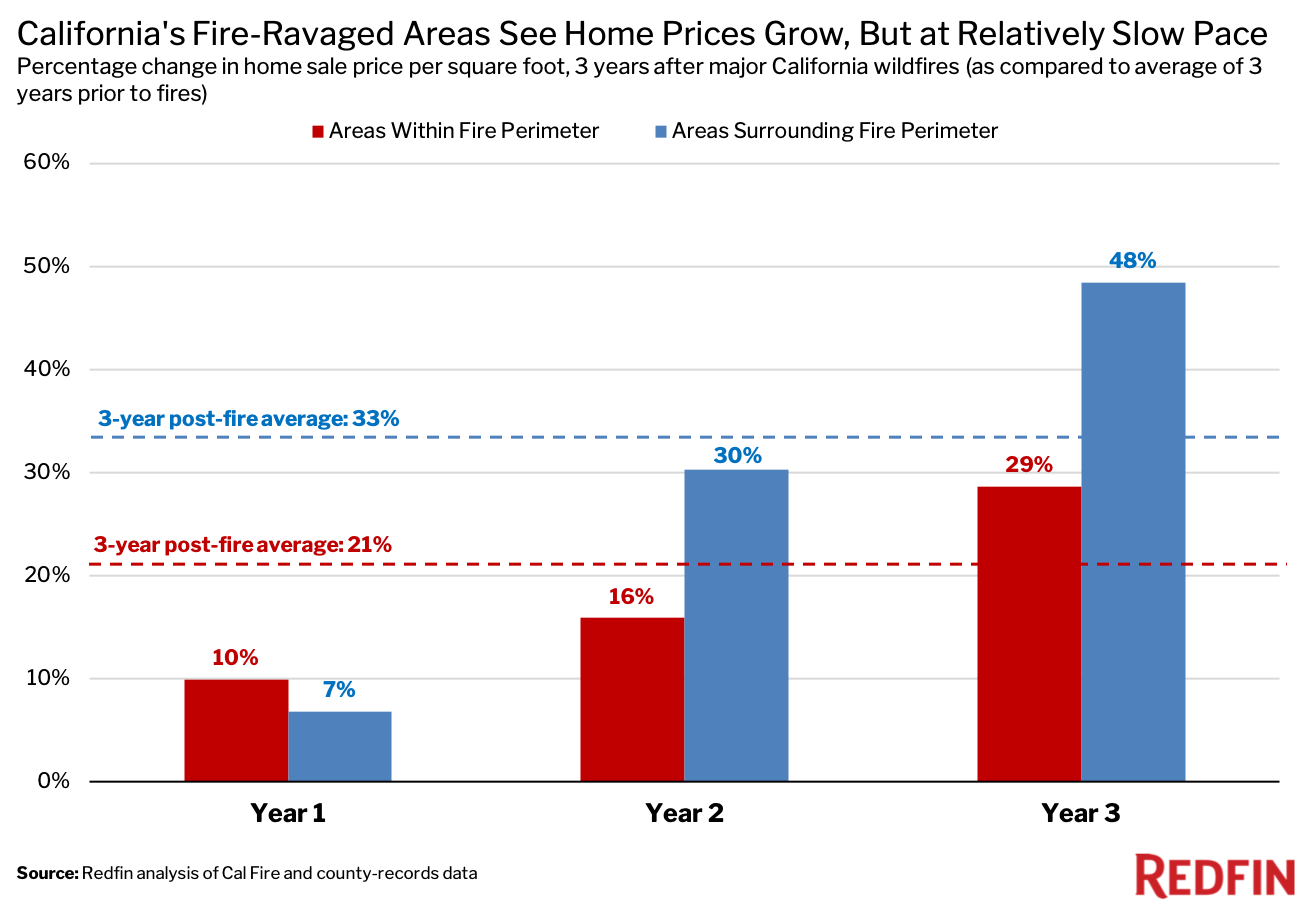
“Like much of the U.S., California is facing an acute housing shortage. That means there are often intense bidding wars for the homes that are for sale—even those in fire-prone areas—which contributes to the rise in prices,” Fairweather said. “The wildfires themselves are also making housing more expensive. After a town burns, builders come in and construct new homes, which are typically more expensive. And homeowners who stay frequently invest in making their homes more fireproof, which increases property value.”
Fairweather continued: “Governments should focus on incentivizing builders to create more housing in places with low fire risk—areas that don’t require as much costly investment in mitigating the dangers of climate change.”
Cash Purchases Jump 17% in Wildfire-Hit Areas as Investors and Builders Swoop In, Compared With a 5% Drop Outside Fire Zones
In areas directly impacted by the fires Redfin analyzed, there was a 17% average increase in all-cash home purchases during the three years after the fires. By comparison, home purchases paid for with cash declined 5% in areas located just outside of the fire perimeters.
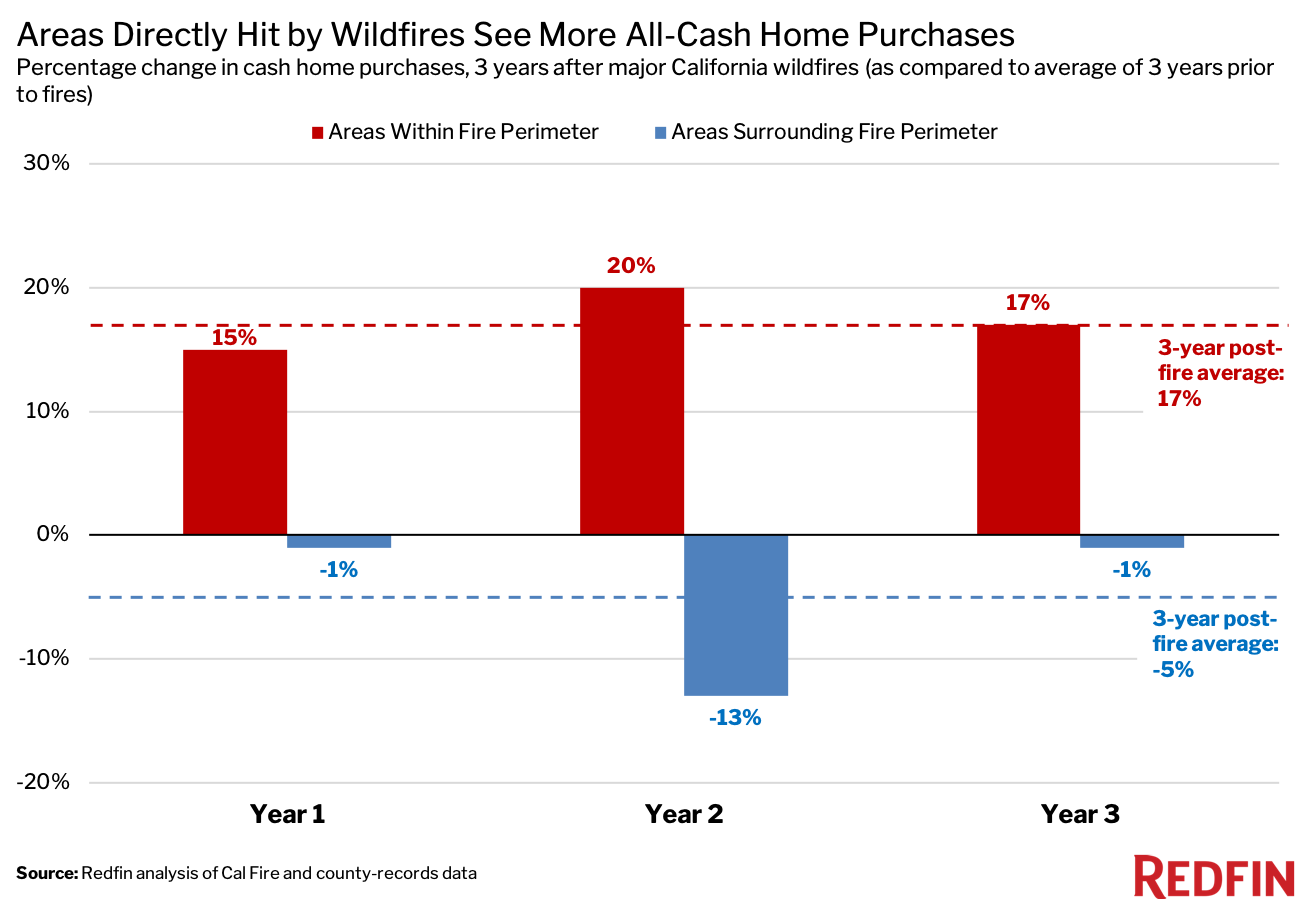
An increase in home and land purchases by investors and homebuilders—who frequently pay with cash—is likely the driving force, according to Anderson.
“In the Napa Valley, builders show up right after fires happen. Communities want to rebuild, so local authorities tend to fast-track permits and design reviews, and push properties hit by fires to the front of the line,” Anderson said. “They build homes in four to six months after fires, whereas normally it can take a year and a half for a builder to get a shovel in the ground.”
In the areas Redfin analyzed that were directly impacted by fires, there was a 595% average increase in the number of homes built during the three years after the fires. That compares with a 6% decrease in the areas that fell outside of the fire perimeters. The surge in construction activity after wildfires contributes to the increase in home prices discussed earlier in this report.
 Builders wouldn’t be rebuilding homes in high-risk areas if they weren’t confident people would move in, and research shows they’re right. More people are moving in than out of areas facing high risk from wildfires and other natural disasters tied to climate change, according to an August Redfin report.
Recovering lost tax revenue is another incentive that drives communities to rebuild quickly after wildfires, Fairweather said. In the areas Redfin analyzed that were directly impacted by fires, property-tax revenue dropped 6% on average in the three years following the fires. By comparison, there was a 12% increase in property-tax revenue in places that weren’t directly within the fires’ reach.
Leaders Should Encourage Homebuilding in Low-Risk Areas
As climate change continues to fuel life-threatening wildfires, local and federal leaders should develop plans to mitigate the risks of natural disasters and keep their communities safe. Here are several potential solutions, from Redfin Chief Economist Daryl Fairweather.
- Limit building in high-risk places: To limit the number of people living in high-risk areas, the federal or state government can incentivize construction elsewhere. This can be done by financially compensating communities that don’t rebuild—which can help ease the burden of lost tax revenue—or by taxing the land or building types with the highest risk. Governments can also purchase land where homes have burnt down and repurpose it for another use, such as a nature preserve.
-
-
- Eliminate single-family zoning: Banning single-family zoning and other restrictive zoning practices in cities that are resilient to climate change allows for more dense housing, and therefore more people, in those relatively safe areas. The federal government can also offer financial incentives to builders with projects in climate-resilient cities, and/or compensate individuals for moving to those areas.
-
- Raise awareness about risk: In places with high fire danger, authorities should provide resources that make clear the level of risk a person faces by moving to the area. Redfin now publishes climate-risk information for every location page on its website. Local leaders should also provide proactive guidance on how homeowners can fortify their properties against fires, and detailed escape routes for residents to follow in the event of fires.
Fire-Level Summary: Five Most Destructive California Wildfires, 2010-2020
Figures in the table below represent the change from the three years before the fire to the three years after the fire, on average.
| Change in average home-sale price (per square foot) | Change in number of homes purchased (AKA homes sold) | Change in number of homes purchased with all cash | Change in number of new homes built | Change in average property tax revenue collected | |
| Camp Fire (2018) | |||||
| Areas within fire perimeter | 37% | -69% | 65% | 673% | -58% |
| Areas surrounding fire perimeter | 14% | 9% | 23% | -39% | 15% |
| Woolsey Fire (2018) | |||||
| Areas within fire perimeter | 5% | -8% | 5% | 109% | 7% |
| Areas surrounding fire perimeter | 27% | -7% | 1% | 9% | 10% |
| Thomas Fire (2017) | |||||
| Areas within fire perimeter | 21% | -25% | 14% | 94% | -1% |
| Areas surrounding fire perimeter | 47% | -3% | -3% | 31% | 13% |
| Tubbs Fire (2017) | |||||
| Areas within fire perimeter | 25% | -14% | 61% | 1,372% | -31% |
| Areas surrounding fire perimeter | 35% | -3% | -4% | 59% | 12% |
| Valley Fire (2015) | |||||
| Areas within fire perimeter | 46% | -39% | -38% | 604% | -23% |
| Areas surrounding fire perimeter | 4% | 16% | -30% | -8% | 9% |
| All five fires | |||||
| Areas within fire perimeter | 21% | -38% | 17% | 595% | -6% |
| Areas surrounding fire perimeter | 33% | -3% | -5% | -6% | 12% |
Methodology
Fire perimeter data comes from the California Department of Forestry and Fire Protection’s Fire and Resource Assessment Program. We selected the five biggest California wildfires—based on the number of residential properties within fire perimeters—between 2010 and 2020. These fires were the Valley (2015), Tubbs (2017), Thomas (2017), Woolsey (2018), and Camp (2018) fires. To understand the impact of wildfires, we compared the affected areas three years before the fires to the affected areas three years after the fires. We also compared those areas to areas surrounding, but not within, the fire perimeters. We selected these surrounding areas by first measuring the distance from the center to the edge of the fire, and then expanding the fire perimeter by that distance on all sides.
Data on home sales, home-sale prices, taxes, all-cash purchases and new construction came from MLS and county records.
 United States
 Canada