Demand for single-family homes surged during the pandemic—but it surged so much that condos are now all some homebuyers can afford.
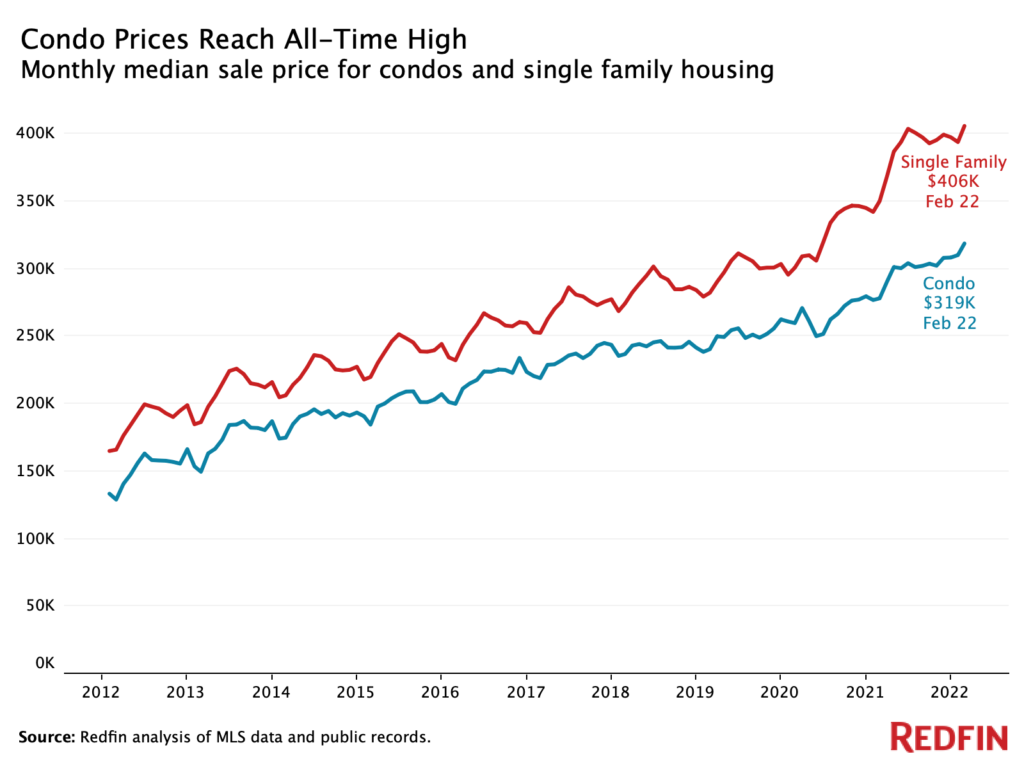
The typical U.S. condo sold for a record $319,000 in February, up 14.6% from a year earlier and 22.7% from two years earlier, just before the pandemic began.
Condos are in demand partly because they’re a comparatively affordable option amid skyrocketing home prices and rising mortgage rates. Single-family home prices hit a record $406,000 in February, up 15.9% year over year and up 34.9% from two years earlier.
Mortgage rates, meanwhile, surpassed 4% for the first time since 2019 this month, up from a record low of 2.65% in January 2021. The typical monthly mortgage payment rose 25% year over year to $2,123 in the four weeks ending March 13.
The fact that condos are nearly as hot as single-family homes marks a big shift from the beginning of the pandemic, when remote work and nerves about crowded spaces caused condo sales to plummet a record 48% and prices to drop the most since 2012. Now, with coronavirus cases declining and some Americans returning to the office, condos are an attractive option once again.
“The condo market has bounced back,” said Chance Glover, a Redfin manager in Boston. “People are no longer afraid to live downtown, close to the crowds–and they often prefer it, because they’re close to the office and all the amenities of the city. Rising prices are pushing single-family homes out of reach for a lot of buyers, so condos are affordable in comparison.”
| U.S. Market Summary, Condos Versus Single-Family Homes: February 2022 | ||
|---|---|---|
| Condos | Single-family homes | |
| Median sale price | $319,000 | $406,000 |
| Median sale price, YoY | 14.6% | 15.9% |
| Homes sold, YoY | -5.3% | -5.1% |
| Pending sales, YoY | -4% | -1.8% |
| New listings, YoY | -6.1% | -2.5% |
| All homes for sale, YoY | -28% | -14% |
| Median days on market | 30 (-13 YoY) | 24 (-7 YoY) |
| Share of homes off market in two weeks | 55.1% (+7.2 percentage points YoY) | 62.1% (+3.9 percentage points YoY) |
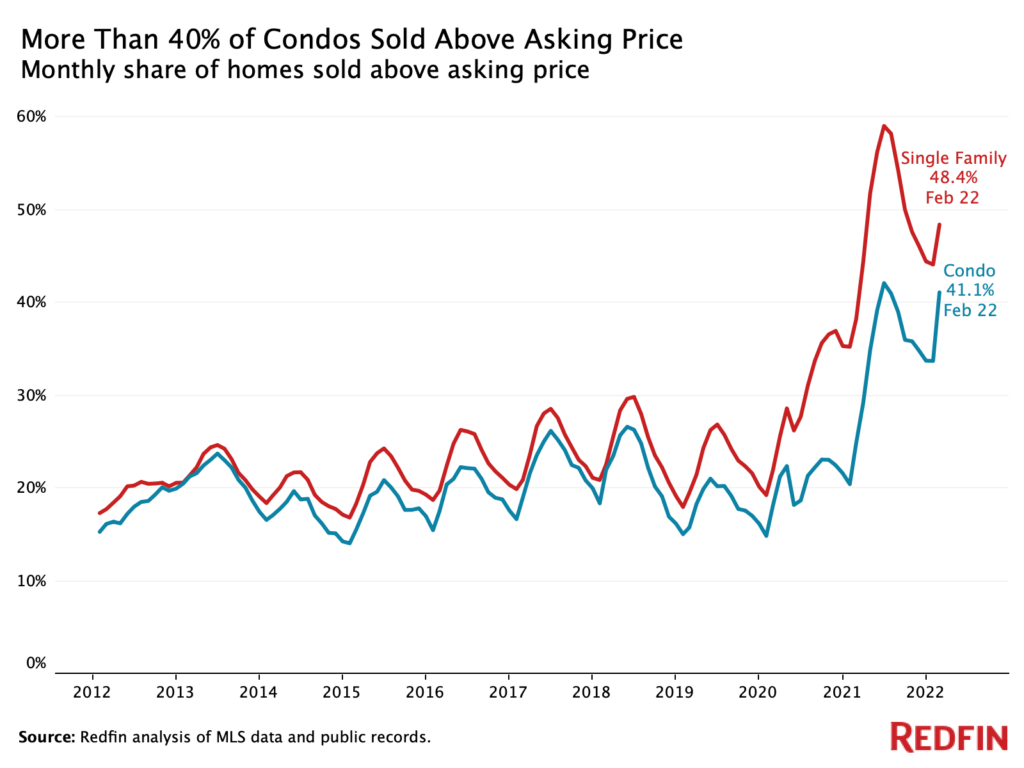
| Share of homes that sold above list price | 41.1% (+16.2 percentage points YoY) | 48.4% (+10.2 percentage points YoY) |
| Average sale-to-list ratio | 100.6% (+2 percentage points YoY) | 101.4% (+1.4 percentage points YoY) |
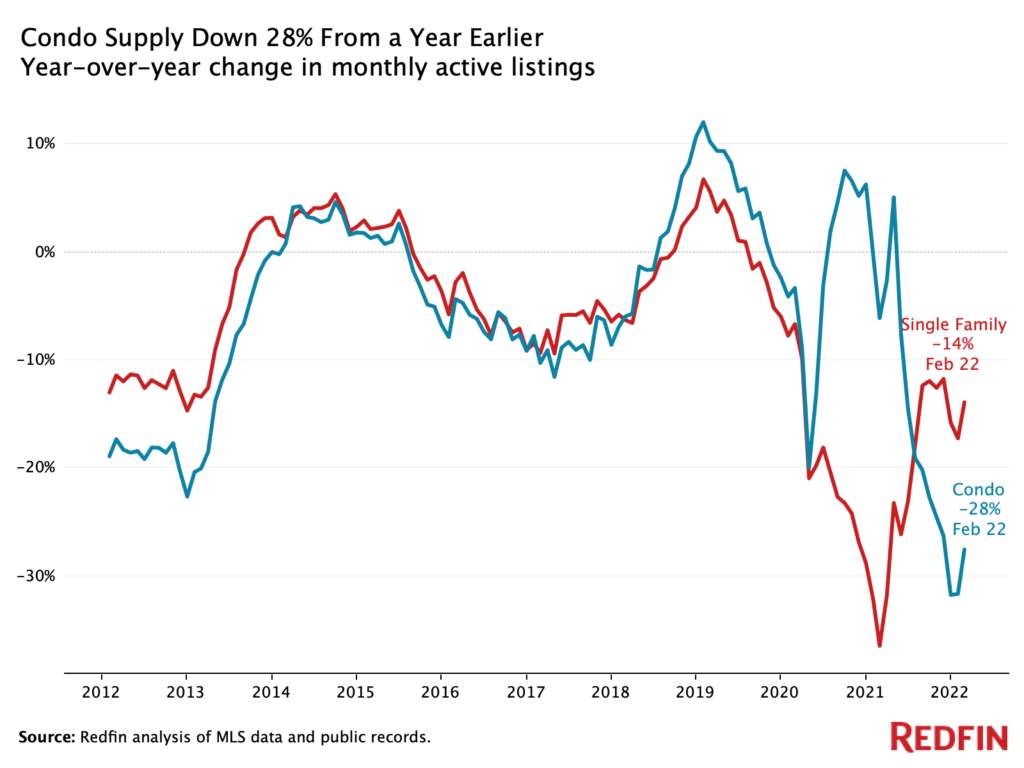
Condo supply is down, pushing up prices
Condo prices have jumped up partly because of the severe inventory shortage and ensuing competition. Condo supply was just shy of a record low in February, down 28% year over year. New condos listings were down 6.1%. Condos are experiencing an even bigger inventory decline than single-family homes, which saw a 14% year-over-year drop and a 2.5% drop in new listings.
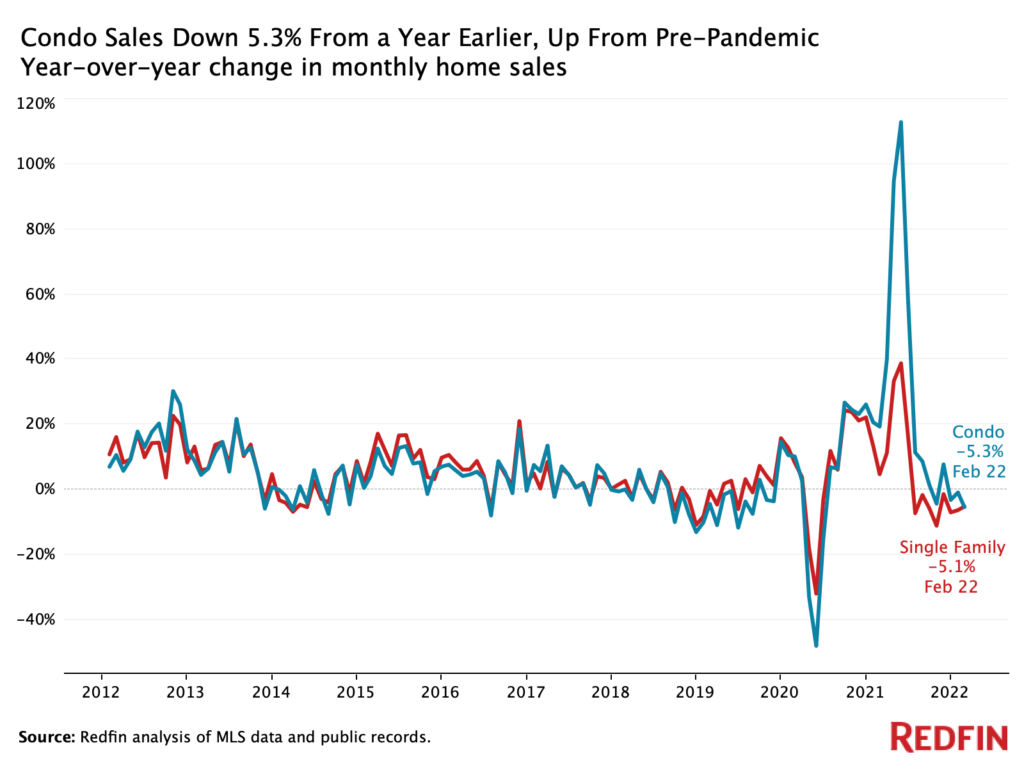
The supply shortage held back condo sales, which were down 5.3% year over year, in line with the decline for single-family homes. But condo sales were up 13% from February 2020, while sales of single-family homes were essentially flat over that same period.
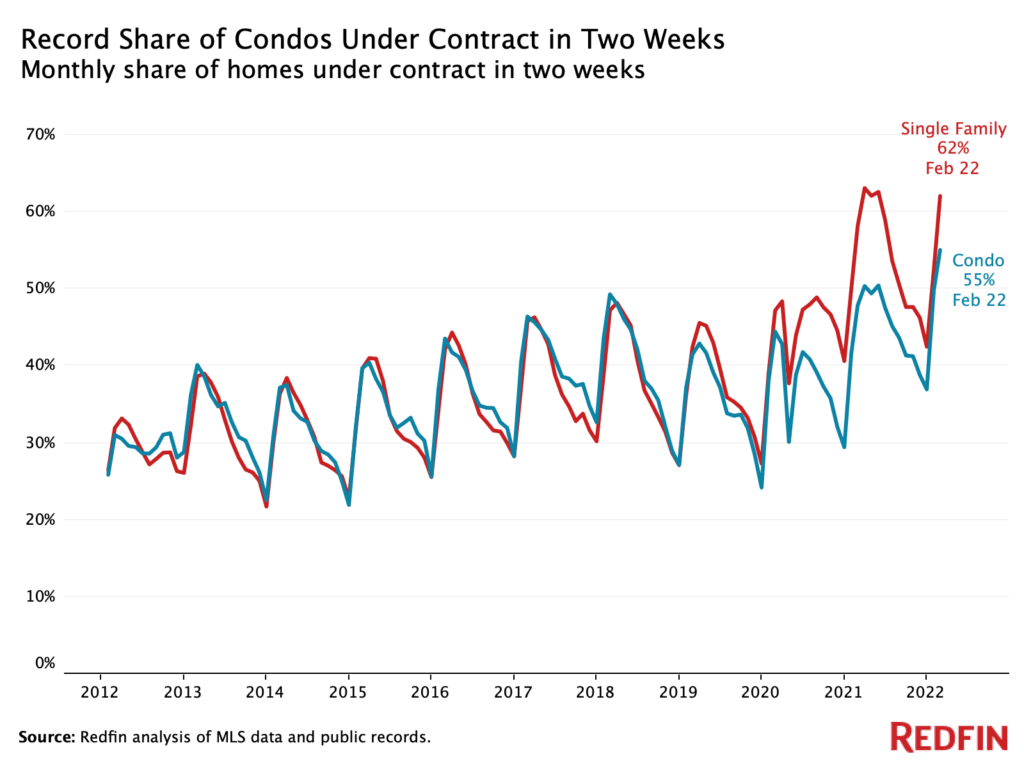
Condos are selling two weeks faster than they were a year ago
A record 55.1% of condos went off the market within two weeks in February, up from 47.9% a year earlier. The typical condo that sold in February went under contract in 30 days, 13 days faster than a year earlier.
By comparison, 62.1% of single-family homes sold within two weeks (versus 58.2% a year earlier), and the typical single-family home sold in 24 days (seven days faster than a year earlier).
Condos still aren’t as competitive as single-family homes
Nearly two-thirds (64.6%) of condo offers written by Redfin agents faced competition in February, up from 49.3% a year earlier. That’s partly due to the lack of supply, with buyers competing for the few condos on the market. By comparison, 72.9% of offers for single-family homes faced bidding wars.
Meanwhile, 41.1% of condos sold above asking price, up from 24.9% a year earlier—another sign of increasing competition. Houses are still a bit more competitive, with 48.4% of single-family homes selling above list price (up from 38.2% a year earlier).
The typical condo sold for 0.6% above its asking price, near the record 0.7% premium set in June 2021. Last May marked the first time on record the typical condo sold for more than its asking price. The typical single-family home sold for 1.4% above asking price.
The ongoing demand for single-family homes is driven by permanent remote work and many Americans growing used to living away from city centers.
“While interest in condos has picked up since the start of the pandemic, a lot of homebuyers are still searching for single-family homes,” said Seattle Redfin agent Shoshana Godwin. “I’ve met with a few potential condo sellers who are worried about a lack of interest until Amazon and other companies are back in the office. Many people haven’t decided where to buy because their work-from-home policies are still indefinite, but I have noticed more buyers looking at condos since the beginning of the year, and many condos are receiving multiple offers.”
Metro-level highlights, February condo market
The highlights listed below are for the 67 metro areas in this analysis.
Prices
- Condo prices increased from last year in 61 of the 67 metros.
- Nashville, TN had the nation’s highest price growth for condos, with median sale prices rising 49.3% year over year to $426,000. It was followed by Charleston, SC (41.1% to $319,000) and Las Vegas, NV (33.3% to $237,000).
Sales
- Condo sales increased most from the year before in Miami, FL, with a 30% increase. Next came Orlando, FL (26.6% increase) and Lake County, IL (23.1%).
- Sales declined most in North Port, FL (-34.1%), Salt Lake City, UT (-27.3%) and Detroit, MI (-25.4%).
Supply
- Condo supply dropped from a year earlier in all but one of the 67 metros. The only metro where supply increased was St. Louis, MO (62.8%).
- Supply declined most in Raleigh, NC (-55.5%), Birmingham, AL (-50.2%) and Nashville, TN (48.7%).
Speed
- Condos sold fastest in Seattle and Denver, with the typical condo going under contract within 5 days of being listed. Next came Indianapolis and Salt Lake City, at 6 days apiece.
- In Seattle, 90.8% of condos went off the market within two weeks, the highest share of the metros in this analysis. It’s followed by Denver (85.3%) and Tacoma, WA (84.8%).
Competition
- Nearly three-quarters (73.4%) of San Jose, CA condos sold above list price, the highest share of all the metros. It’s followed by San Diego (70.4%) and Oxnard, CA (70.2%).
- The Bay Area had the biggest premiums above list price, with the typical San Francisco condo selling for 6.1% above list price in February, followed by 5.5% in San Jose and 4.9% in Oakland.
| Metro-level summary: Condos, February 2022
67 largest U.S. metros tracked by Redfin, excluding Texas and metros with fewer than 50 condo sales last month |
||||||||
| U.S. metro area | Median sale price, YoY | Homes sold, YoY | Number of homes for sale, YoY | Median days on market | Share of homes off market in two weeks | Share of homes sold above list price | Average sale-to-list ratio | |
| Anaheim, CA | $655,000 | 21.3% | -19.1% | -34.1% | 25 | 49.0% | 67.8% | 104.5% |
| Atlanta, GA | $271,000 | 17.6% | 2.8% | -39.3% | 22 | 65.1% | 43.1% | 100.3% |
| Baltimore, MD | $225,000 | 12.5% | 12.6% | -12.6% | 26 | 57.3% | 38.8% | 100.2% |
| Birmingham, AL | $165,000 | -21.4% | 6.1% | -50.2% | 43 | 40.0% | 50.0% | 101.2% |
| Boston, MA | $519,000 | 2.8% | -7.5% | -28.4% | 32 | 48.7% | 37.6% | 100.6% |
| Bridgeport, CT | $285,000 | 9.2% | -4.7% | -38.5% | 54 | 33.5% | 46.0% | 100.5% |
| Camden, NJ | $160,000 | 9.0% | 0.0% | -25.9% | 15 | 60.2% | 60.3% | 102.5% |
| Charleston, SC | $319,000 | 41.1% | -7.9% | -38.1% | 37 | 30.0% | 43.0% | 100.6% |
| Charlotte, NC | $246,000 | 8.0% | 17.7% | -31.7% | 32 | 41.6% | 54.0% | 101.6% |
| Chicago, IL | $231,000 | 7.6% | 13.6% | -10.8% | 62 | 30.6% | 25.6% | 98.3% |
| Cincinnati, OH | $169,000 | 13.0% | -9.5% | -23.0% | 36 | 37.9% | 38.4% | 99.9% |
| Cleveland, OH | $140,000 | 16.7% | -7.6% | -28.2% | 21 | 58.5% | 38.3% | 99.1% |
| Columbus, OH | $220,000 | 12.8% | -2.4% | -13.1% | 37 | 30.4% | 54.8% | 101.9% |
| Dayton, OH | $145,000 | 16.0% | -3.3% | -14.1% | 19 | 58.1% | 41.4% | 100.6% |
| Denver, CO | $349,000 | 16.4% | -16.0% | -37.0% | 5 | 85.3% | 64.2% | 103.4% |
| Detroit, MI | $200,000 | 0.0% | -25.4% | -25.7% | 21 | 68.5% | 41.0% | 99.9% |
| Elgin, IL | $165,000 | 14.7% | 3.8% | -2.3% | 41 | 18.9% | 48.1% | 100.5% |
| Fort Lauderdale, FL | $208,000 | 24.3% | 1.9% | -42.5% | 56 | 33.3% | 21.2% | 97.8% |
| Frederick, MD | $235,000 | 2.2% | 0.8% | -23.4% | 33 | 50.9% | 33.9% | 99.9% |
| Grand Rapids, MI | $285,000 | 14.4% | -16.2% | -37.5% | 7 | 78.3% | 44.2% | 102.1% |
| Greenville, SC | $183,000 | -4.7% | 8.0% | -41.6% | 40 | 29.2% | 40.7% | 99.5% |
| Hartford, CT | $175,000 | 12.6% | -8.6% | -33.3% | 33 | 55.0% | 55.3% | 101.9% |
| Indianapolis, IN | $213,000 | 21.4% | 3.6% | -20.0% | 6 | 80.3% | 43.8% | 100.4% |
| Jacksonville, FL | $235,000 | 23.7% | -17.8% | -43.6% | 24 | 52.5% | 38.8% | 100.2% |
| Kansas City, MO | $174,000 | -2.5% | 6.9% | -37.5% | 63 | 65.1% | ||
| Knoxville, TN | $244,000 | 26.4% | -12.8% | -46.1% | 35 | 37.5% | 55.9% | 103.0% |
| Lake County, IL | $191,000 | 13.7% | 23.1% | -5.9% | 57 | 22.6% | 31.3% | 99.2% |
| Las Vegas, NV | $237,000 | 33.3% | 2.3% | -30.6% | 22 | 57.5% | 43.3% | 100.7% |
| Los Angeles, CA | $630,000 | 16.8% | 0.0% | -33.3% | 34 | 38.9% | 57.5% | 102.6% |
| Louisville, KY | $179,000 | 12.2% | -20.2% | -31.9% | 36 | 59.8% | 17.2% | 98.4% |
| Miami, FL | $383,000 | 32.8% | 30.0% | -30.8% | 70 | 34.5% | 14.4% | 96.9% |
| Milwaukee, WI | $234,000 | 10.0% | 13.0% | -16.3% | 46 | 28.3% | 45.5% | 100.3% |
| Minneapolis, MN | $183,000 | -12.3% | -18.0% | -16.4% | 62 | 39.6% | 21.4% | 98.5% |
| Montgomery County, PA | $211,000 | 12.8% | -10.6% | -29.4% | 11 | 62.1% | 42.9% | 101.8% |
| Nashville, TN | $426,000 | 49.3% | -21.4% | -48.7% | 19 | 59.0% | 44.1% | 101.9% |
| Nassau County, NY | $360,000 | 2.5% | -12.7% | -19.6% | 41 | 24.2% | 33.6% | 99.2% |
| New Brunswick, NJ | $310,000 | 19.2% | -11.6% | -6.7% | 37 | 54.2% | 52.3% | 101.9% |
| New Haven, CT | $175,000 | 16.7% | 3.4% | -23.9% | 46 | 40.7% | 43.5% | 99.8% |
| New Orleans, LA | $255,000 | 23.2% | 4.0% | -23.5% | 22 | 65.7% | 20.0% | 98.0% |
| New York, NY | $599,000 | 10.9% | 14.7% | -3.3% | 79 | 27.1% | 8.9% | 99.0% |
| North Port, FL | $325,000 | 31.6% | -34.1% | -43.3% | 7 | 78.4% | 45.6% | 101.0% |
| Oakland, CA | $579,000 | 10.8% | -5.6% | -17.9% | 11 | 77.0% | 67.1% | 104.9% |
| Orlando, FL | $188,000 | 26.3% | 26.6% | -38.4% | 12 | 69.0% | 32.5% | 99.2% |
| Oxnard, CA | $529,000 | 15.0% | -13.8% | -12.3% | 29 | 35.2% | 70.2% | 102.9% |
| Philadelphia, PA | $270,000 | -3.5% | 16.4% | -22.8% | 87 | 44.4% | 15.5% | 97.6% |
| Phoenix, AZ | $320,000 | 28.8% | -17.6% | -27.9% | 22 | 50.4% | 51.6% | 101.3% |
| Pittsburgh, PA | $214,000 | -7.1% | -11.9% | -26.7% | 52 | 28.1% | 20.3% | 97.4% |
| Portland, OR | $335,000 | 8.9% | 6.1% | -21.3% | 12 | 76.6% | 46.1% | 101.2% |
| Providence, RI | $295,000 | 30.1% | -0.6% | -24.7% | 26 | 54.2% | 47.2% | 100.8% |
| Raleigh, NC | $270,000 | 28.6% | 10.4% | -55.5% | 37 | 49.3% | 50.6% | 98.8% |
| Richmond, VA | $304,000 | 10.0% | -18.1% | -39.7% | 10 | 75.9% | 48.8% | 101.8% |
| Riverside, CA | $455,000 | 32.5% | -6.4% | -29.5% | 28 | 43.6% | 60.9% | 102.4% |
| Sacramento, CA | $360,000 | 26.8% | -5.7% | -25.2% | 9 | 81.9% | 63.9% | 103.0% |
| Salt Lake City, UT | $349,000 | 24.3% | -27.3% | 6 | 78.6% | 64.3% | 102.9% | |
| San Diego, CA | $580,000 | 24.7% | -18.7% | -34.8% | 8 | 77.7% | 70.4% | 104.2% |
| San Francisco, CA | $1,091,000 | 4.1% | -5.5% | -23.4% | 20 | 61.1% | 62.3% | 106.1% |
| San Jose, CA | $808,000 | 11.4% | -9.0% | -43.0% | 9 | 78.9% | 73.4% | 105.5% |
| Seattle, WA | $487,000 | 21.8% | 0.7% | -34.3% | 5 | 90.8% | 58.2% | 104.6% |
| St. Louis, MO | $180,000 | 16.0% | 22.1% | 62.8% | 20 | 68.9% | 42.0% | 100.3% |
| Tacoma, WA | $394,000 | 30.5% | -7.5% | -12.6% | 7 | 84.8% | 56.5% | 102.4% |
| Tampa, FL | $218,000 | 32.3% | -1.8% | -29.2% | 9 | 73.2% | 39.5% | 100.2% |
| Tucson, AZ | $180,000 | 24.1% | 0.0% | -9.7% | 33 | 34.7% | 47.3% | 101.1% |
| Urban Honolulu, HI | $493,000 | 5.9% | 8.6% | -19.4% | 54 | 18.8% | 35.8% | 100.0% |
| Virginia Beach, VA | $250,000 | 11.3% | -4.8% | -21.0% | 22 | 57.4% | 44.1% | 100.0% |
| Warren, MI | $205,000 | 19.2% | -11.1% | -22.1% | 13 | 69.6% | 35.4% | 99.8% |
| Washington, DC | $350,000 | 10.2% | -15.1% | -24.9% | 39 | 46.6% | 33.3% | 99.8% |
| West Palm Beach, FL | $235,000 | 23.7% | -3.0% | -43.4% | 43 | 36.8% | 24.5% | 98.2% |
 United States
 Canada