Homes are much less affordable than they were a year ago due to skyrocketing prices and surging mortgage rates–especially in Sun Belt metros like Tampa, Phoenix and Las Vegas.
Homebuyers in nearly every part of the country have felt the impact of surging housing prices since the start of the pandemic—but especially those in the Sun Belt, which has seen costs skyrocket even more than other areas as out-of-towners flock in.
Homebuyers in Tampa, FL need to earn $67,353 annually to afford the metro area’s typical monthly mortgage payment of $1,684. That’s up a staggering $21,791 (47.8%) from $45,562 a year earlier, the biggest percent increase of any major U.S. metro.
It’s followed by 12 other Sun Belt metros. In Phoenix, homebuyers must earn $87,026 to afford the area’s typical monthly mortgage payment of $2,176, up $27,302 (45.7%) from a year earlier, and in Las Vegas, buyers must earn $79,620 to afford the typical payment of $1,990, up $24,923 (45.6%) from a year ago. Next came the following metros, which all saw gains of nearly 40% or more: Orlando, FL, Jacksonville, FL, Nashville, TN, Austin, TX, Fort Worth, TX Anaheim, CA, Dallas, Atlanta, Charlotte, NC and San Diego. In this report, we use the word “homebuyer” to refer to someone who is taking out a loan to finance their home purchase.
Pandemic-fueled remote work is allowing a record share of homebuyers to move from one part of the country to another, and Tampa, Phoenix and Las Vegas are all among the top five most popular destinations. Buyers are attracted to Sun Belt locales partly because they’re relatively affordable compared to pricey coastal job centers, but the resulting rise in home prices may make them less popular in the future.
Across the U.S., buyers need 34% more income to afford a home
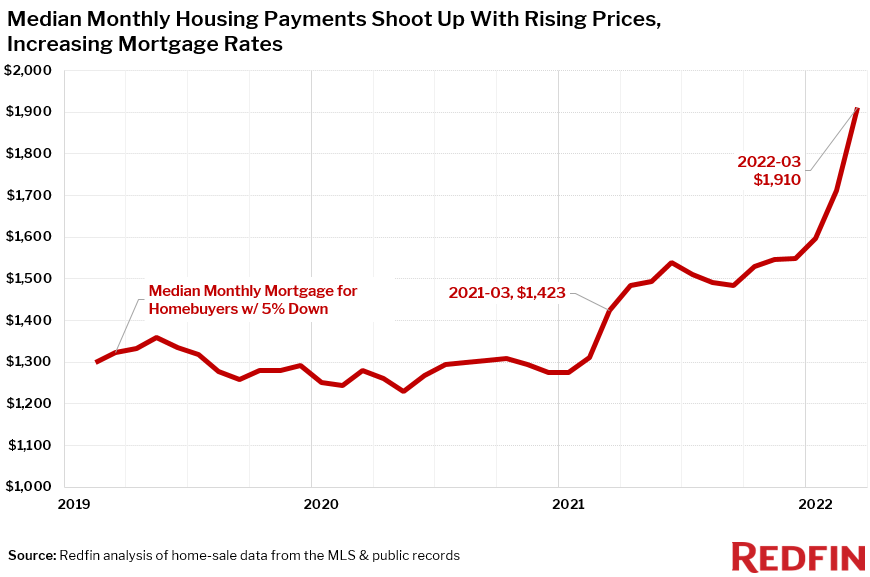
Nationwide, homebuyers need to earn $76,414 annually to afford today’s typical monthly mortgage payment of $1,910. That’s up $19,478 (34.2%) from a year earlier. The income necessary to afford a home has increased by more than 15% year over year in all 50 of the most populous U.S. metros tracked by Redfin. Over the same time period, average hourly wages in the U.S. grew 5.6%.
This is based on a Redfin analysis that compares median home-sale prices in March 2022 and March 2021. A monthly mortgage payment is considered affordable if the homebuyer spends no more than 30% of their income on housing. Monthly median mortgage payments are calculated assuming the buyer made a 5% down payment. The typical mortgage payments noted in this report include principal and interest and exclude taxes and insurance.
The income needed to afford a home began climbing at the start of last year and jumped further this year as soaring demand, limited inventory and increasing mortgage rates led to rapidly rising sale prices. The national median home-sale price was up 17% from a year earlier to a record high of $412,700 in March, and the number of homes for sale was down 13% to an all-time low.
Mortgage rates shot up from about 3% to more than 5% over the last year. The combination of skyrocketing prices and rising mortgage rates caused the typical monthly mortgage payment to reach $1,910 in March 2022, up from $1,423 in March 2021 and $1,280 in March 2020.
“Housing is significantly less affordable than it was a year ago because the surge in housing costs has far outpaced the increase in wages, meaning many Americans are now priced out of homeownership,” said Redfin Deputy Chief Economist Taylor Marr. “The good news is that there’s a positive side to rising mortgage rates, too: They will likely slow price growth and curb competition for homes, providing a reprieve for some prospective buyers.”
“There are a few ways for people to get around rising housing costs,” Marr continued. “The first and easiest is to simply stay put, as monthly mortgage payments typically don’t change much. Buyers can also consider relocating to a more affordable part of the country.”
People who purchased a home before the pandemic or at the beginning of it are benefiting from rising home prices and the increase in equity that comes along with them.
Pittsburgh buyers must earn 16% more to afford a home–the smallest gain in the country
Though homes are less affordable than a year ago in every metro in this analysis, homebuyers in parts of Pennsylvania and the Midwest have seen smaller gains in the income necessary to buy a home than other parts of the country.
Homebuyers in Pittsburgh need to earn $39,532 to afford the area’s median monthly mortgage payment of $988, up 16.3% from a year earlier. It’s followed by Philadelphia ($49,068, up 17.1% year over year) and Chicago ($57,400, +18.2%). Milwaukee ($47,355, +20.4%) and Detroit ($30,737, +21.3%) round out the top five.
California homebuyers need the biggest annual incomes to afford a home
Homebuyers in San Francisco need an annual income of $292,556 (+26.4% YoY) to afford the typical home—the highest of the metros in this analysis. It’s followed by neighboring San Jose, CA, where buyers need $288,852 (+34.7%) and Anaheim ($192,568, +39.8%). Homebuyers need to earn at least $100,000 annually to afford the average home in 14 of the 50 metros in this analysis. Eight of those 14 are in California, and the others are Boston, Denver, Nassau County, NY, New York, Portland, OR, and Seattle.
Detroit is the most affordable metro for homebuyers. Cleveland ($35,181, +30.4% YoY) and Pittsburgh come next, followed by St. Louis ($41,661, +21.7%) and Milwaukee.
| U.S. Metro Area | Annual Income Needed to Afford Median Home for Sale, March 2022 | Annual Income Needed to Afford Median Home for Sale, March 2021 | Year-Over-Year Change in Income Needed to Afford Median Home for Sale, March 2022 | Median Sale Price | Year-Over-Year Change in Median Sale Price | Monthly Mortgage (5% down) | Monthly Mortgage (5% down), March 2021 |
| Anaheim, CA | $192,568 | $137,738 | 39.8% | $1,040,000 | 22.2% | $4,814 | $3,443 |
| Atlanta, GA | $68,140 | $48,919 | 39.3% | $368,000 | 21.8% | $1,703 | $1,223 |
| Austin, TX | $97,210 | $69,116 | 40.6% | $525,000 | 22.9% | $2,430 | $1,728 |
| Baltimore, MD | $62,029 | $50,984 | 21.7% | $335,000 | 6.3% | $1,551 | $1,275 |
| Boston, MA | $118,504 | $93,309 | 27.0% | $640,000 | 11.0% | $2,963 | $2,333 |
| Charlotte, NC | $70,235 | $50,498 | 39.1% | $379,318 | 21.6% | $1,756 | $1,262 |
| Chicago, IL | $57,400 | $48,556 | 18.2% | $310,000 | 3.3% | $1,435 | $1,214 |
| Cincinnati, OH | $45,920 | $36,093 | 27.2% | $248,000 | 11.2% | $1,148 | $902 |
| Cleveland, OH | $35,181 | $26,989 | 30.4% | $190,000 | 13.9% | $880 | $675 |
| Columbus, OH | $53,975 | $41,273 | 30.8% | $291,500 | 14.3% | $1,349 | $1,032 |
| Dallas, TX | $77,768 | $55,741 | 39.5% | $420,000 | 22.0% | $1,944 | $1,394 |
| Denver, CO | $111,213 | $80,161 | 38.7% | $600,625 | 21.3% | $2,780 | $2,004 |
| Detroit, MI | $30,737 | $25,330 | 21.3% | $166,000 | 6.1% | $768 | $633 |
| Fort Lauderdale, FL | $68,510 | $52,028 | 31.7% | $370,000 | 15.1% | $1,713 | $1,301 |
| Fort Worth, TX | $65,177 | $46,452 | 40.3% | $352,000 | 22.6% | $1,629 | $1,161 |
| Houston, TX | $61,103 | $46,700 | 30.8% | $330,000 | 14.4% | $1,528 | $1,167 |
| Indianapolis, IN | $48,142 | $36,417 | 32.2% | $260,000 | 15.6% | $1,204 | $910 |
| Jacksonville, FL | $64,806 | $45,319 | 43.0% | $349,995 | 25.0% | $1,620 | $1,133 |
| Kansas City, MO | $53,697 | $42,406 | 26.6% | $290,000 | 10.7% | $1,342 | $1,060 |
| Las Vegas, NV | $79,620 | $54,697 | 45.6% | $430,000 | 27.2% | $1,990 | $1,367 |
| Los Angeles, CA | $161,554 | $125,437 | 28.8% | $872,500 | 12.6% | $4,039 | $3,136 |
| Miami, FL | $86,285 | $62,961 | 37.0% | $466,000 | 19.8% | $2,157 | $1,574 |
| Milwaukee, WI | $47,355 | $39,330 | 20.4% | $255,750 | 5.2% | $1,184 | $983 |
| Minneapolis, MN | $65,732 | $53,412 | 23.1% | $355,000 | 7.6% | $1,643 | $1,335 |
| Montgomery County, PA | $74,065 | $59,886 | 23.7% | $400,000 | 8.1% | $1,852 | $1,497 |
| Nashville, TN | $79,618 | $56,155 | 41.8% | $429,990 | 23.9% | $1,990 | $1,404 |
| Nassau County, NY | $110,912 | $86,430 | 28.3% | $599,000 | 12.2% | $2,773 | $2,161 |
| National | $76,414 | $56,936 | 34.2% | $412,687 | 17.3% | $1,910 | $1,423 |
| New Brunswick, NJ | $78,694 | $63,123 | 24.7% | $425,000 | 9.0% | $1,967 | $1,578 |
| New York, NY | $125,476 | $101,806 | 23.2% | $677,654 | 7.7% | $3,137 | $2,545 |
| Newark, NJ | $87,026 | $68,788 | 26.5% | $470,000 | 10.6% | $2,176 | $1,720 |
| Oakland, CA | $181,459 | $144,050 | 26.0% | $980,000 | 10.1% | $4,536 | $3,601 |
| Orlando, FL | $69,804 | $48,556 | 43.8% | $376,990 | 25.7% | $1,745 | $1,214 |
| Philadelphia, PA | $49,068 | $41,920 | 17.1% | $265,000 | 2.3% | $1,227 | $1,048 |
| Phoenix, AZ | $87,026 | $59,724 | 45.7% | $470,000 | 27.4% | $2,176 | $1,493 |
| Pittsburgh, PA | $39,532 | $33,989 | 16.3% | $213,500 | 1.7% | $988 | $850 |
| Portland, OR | $101,839 | $77,285 | 31.8% | $550,000 | 15.2% | $2,546 | $1,932 |
| Providence, RI | $71,287 | $54,868 | 29.9% | $385,000 | 13.6% | $1,782 | $1,372 |
| Riverside, CA | $103,691 | $76,071 | 36.3% | $560,000 | 19.1% | $2,592 | $1,902 |
| Sacramento, CA | $112,949 | $84,164 | 34.2% | $610,000 | 17.3% | $2,824 | $2,104 |
| San Antonio, TX | $59,252 | $42,891 | 38.1% | $320,000 | 20.8% | $1,481 | $1,072 |
| San Diego, CA | $157,387 | $113,298 | 38.9% | $850,000 | 21.4% | $3,935 | $2,832 |
| San Francisco, CA | $292,556 | $231,451 | 26.4% | $1,580,000 | 10.5% | $7,314 | $5,786 |
| San Jose, CA | $288,852 | $214,456 | 34.7% | $1,560,000 | 17.7% | $7,221 | $5,361 |
| Seattle, WA | $151,833 | $113,136 | 34.2% | $820,000 | 17.3% | $3,796 | $2,828 |
| St. Louis, MO | $41,661 | $34,233 | 21.7% | $225,000 | 6.4% | $1,042 | $856 |
| Tampa, FL | $67,353 | $45,562 | 47.8% | $363,750 | 29.2% | $1,684 | $1,139 |
| Virginia Beach, VA | $54,818 | $43,053 | 27.3% | $296,055 | 11.3% | $1,370 | $1,076 |
| Warren, MI | $48,512 | $39,565 | 22.6% | $262,000 | 7.2% | $1,213 | $989 |
| Washington, DC | $97,210 | $77,690 | 25.1% | $525,000 | 9.4% | $2,430 | $1,942 |
| West Palm Beach, FL | $77,138 | $55,840 | 38.1% | $416,599 | 20.8% | $1,928 | $1,396 |
 United States
 Canada