Vacation towns and suburbs outside of major coastal cities are on the rise as remote work drives Americans to seek out space, solitude and affordability during the coronavirus pandemic.
Redfin’s 10 hottest neighborhoods of 2021 all have one thing in common: They’re offering American homebuyers respite from crowded, costly cities during the coronavirus pandemic.
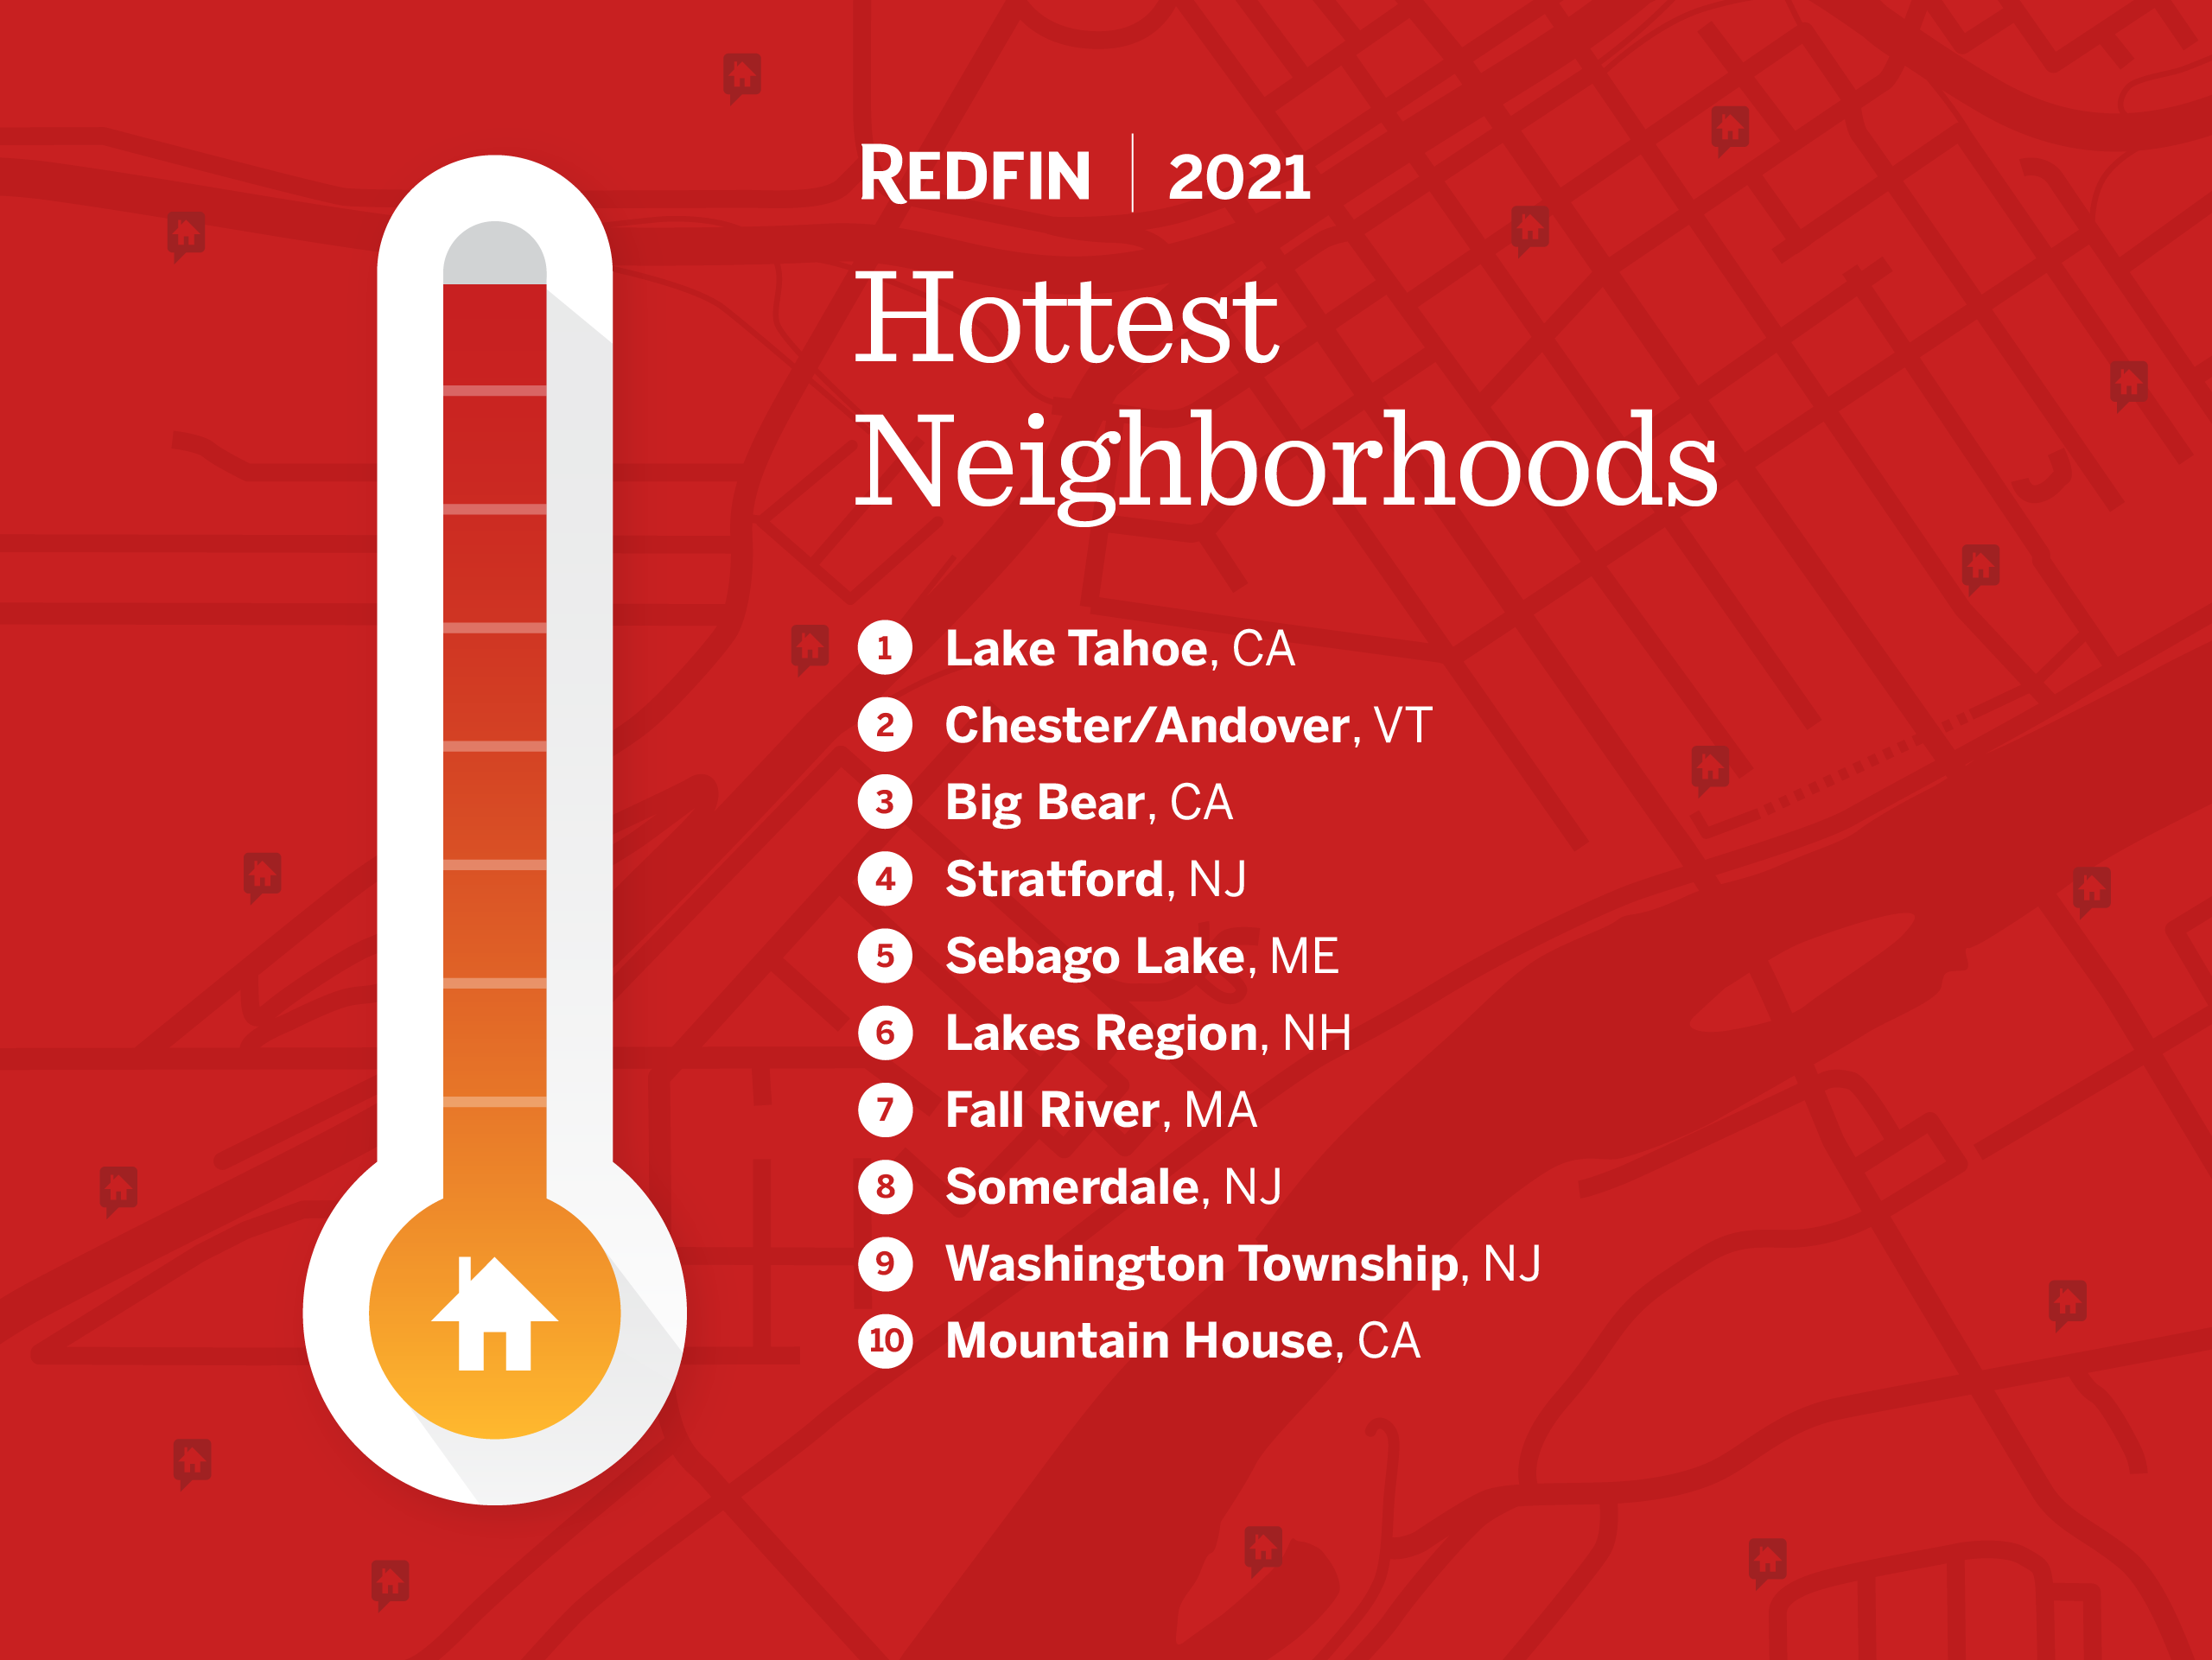
Each place on this year’s list is located outside but within driving distance of at least one of the following coastal hubs: New York City, Boston, Philadelphia, San Francisco or Los Angeles. The majority of the top 10 neighborhoods have seen double-digit growth in home sales and housing values over the past year, and most are relatively affordable, with a median home price below the national level of $336,000.
This is according to a Redfin analysis that ranked U.S. zip codes by year-over-year growth in listing views on Redfin.com and Redfin Compete Score—a measure of how difficult it is to win a home based on factors including days on market, share of homes that sold above their listing prices and sale-to-list price ratio. All data represents October 2020.
A handful of places on the top 10 list, including California’s Lake Tahoe and the Lakes Region of New Hampshire, were already popular vacation getaways that are now attracting affluent city dwellers who are working from home during the pandemic. Other locations in the ranking, such as Mountain House, California and Washington Township, New Jersey, are luring families who want backyards and extra bedrooms while staying relatively close to major metropolitan areas.
“Remote work is allowing Americans to live where they actually want to live. People are no longer tied to the cities where their offices are located,” said Redfin Chief Economist Daryl Fairweather. “Some folks are buying second homes in resort towns while others are moving to family-friendly suburbs where they can get more bang for their buck.”
The pandemic will eventually come to an end, but suburbs and vacation towns will likely remain popular among homebuyers, Fairweather added.
“You can’t put the genie back in the bottle,” Fairweather said. “Many Americans have learned that they can be productive working from home. If their employer asks them to return to the office in the city five days a week, they can find a new employer.”
1. Lake Tahoe, CA
Zip code: 96145
Parent metro area: Sacramento, CA
Median sale price: $945,000 (+28% YoY)
Median sale price of parent metro area: $480,000 (+17% YoY)
Median days on market: 48 (-25 days YoY)
Change in home sales: +87% YoY
Change in median views per listing: +280% YoY
Share of homes that sold above list price: 36%
“The Lake Tahoe housing market is hotter than ever. People are coming from San Francisco in droves and they’re bringing their Bay Area salaries with them—everyone here drives a Tesla now,” said Redfin real estate agent Jaime Moore. “City folks have decided that if they have to work from home and shelter in place, they might as well do it in the mountains. In their mind, Lake Tahoe is affordable because they can buy a second home with three bedrooms and two bathrooms for $750,000. In the Bay Area, they’d be lucky to find a one-bedroom condo for that price.”
Moore continued: “The housing market in Lake Tahoe typically slows down in the winter months and ramps back up in the spring, but this year, we’re still seeing tons of buyers in December. Homes are listing for $500,000 and selling for $700,000. People are just sick of the city. They’re coming here and buying modern homes—not the rustic cabins you might think of when you think of Lake Tahoe. They want the same thing they have in the Bay Area, but in a mountain setting.”
North Lake Tahoe is particularly popular because it’s relatively affordable and has fewer regulations on Airbnb rentals—a major draw for buyers who plan to use their home as an investment property, Moore added.
2. Chester/Andover, VT
Zip code: 05143
Parent metro area: Lebanon, NH
Median sale price: $281,250 (+34% YoY)
Median sale price of parent metro area: $278,475 (+30% YoY)
Median days on market: 83 (-42 days YoY)
Change in home sales: +60% YoY
Change in median views per listing: +267% YoY
Share of homes that sold above list price: 15%
Founded in 1761, Chester is a quaint village nestled in the mountains of southern Vermont. It’s home to 3,144 residents, while the neighboring, rural village of Andover has a population of about 500. The area is surrounded by seven major ski resorts and offers access to dozens of hiking, biking and snowmobiling trails. Chester’s historic buildings are one of the village’s main attractions, according to Town Manager Julie Hance, who said that Chester has seen an influx of new residents since the pandemic began.
“Young families are buying homes and moving here because parents can work remotely and it’s just safer than the city. … Our kids still ride their bikes to school without their parents,” said Hance, who noted that Chester tends to attract homebuyers from New York and Connecticut. “People are buying properties sight-unseen right now, which is not usually the case here.”
Chester recently launched a new marketing campaign focused on permanent residents, Hance added.
“The pandemic hit, and that’s when it was kind of like, ‘You know what? Now really is the time to market ourselves, and not just to tourists,’” she said. “We should market ourselves as a place where you can settle down with your family.”
3. Big Bear, CA
Zip code: 92386
Parent metro area: Riverside, CA
Median sale price: $220,000 (+9% YoY)
Median sale price of parent metro area: $439,000 (+14% YoY)
Median days on market: 35 (-34 days YoY)
Change in home sales: +79% YoY
Change in median views per listing: +255% YoY
Share of homes that sold above list price: 50%
“Big Bear is a sleepy mountain town about two hours east of Los Angeles. It has a lot of biker bars, quaint shops, little restaurants and log cabins,” said Redfin agent Tara Huston. “It’s a fun place to rent an Airbnb, have a family get together and play in the snow. There’s also a lake, which attracts vacationers in the summer.”
Huston continued: “One of my clients recently bought a cabin in the area because he no longer needs to commute into his IT job in Redlands. He grew up visiting Big Bear with his family and has fond memories of inner tubing and swimming in the lake there as a kid. He plans to live in the cabin during the off season and rent it out as a vacation home during the holidays.”
4. Stratford, NJ
Zip code: 08084
Parent metro area: Camden, NJ
Median sale price: $200,500 (+8% YoY)
Median sale price of parent metro area: $235,000 (+21% YoY)
Median days on market: 19 (-35 days YoY)
Change in home sales: +17% YoY
Change in median views per listing: +254% YoY
Share of homes that sold above list price: 41%
“Stratford is a cute little area bordering Gloucester Township, which is a half-hour drive to Philly and minutes from the Atlantic City Expressway that goes to the Jersey Shore,” said Redfin agent Jackie Imperato. “The neighborhood is full of affordable homes that are great for first-time buyers. Flippers have been buying up Stratford’s outdated houses and rehabilitating them, so young couples are getting 90-year-old homes that feel brand new for less than what they were paying for rent in the city.”
5. Sebago Lake, ME
Zip code: 04084
Parent metro area: Portland, ME
Median sale price: $324,895 (+18% YoY)
Median sale price of parent metro area: $370,000 (+26% YoY)
Median days on market: 8 (-21 days YoY)
Change in home sales: +32% YoY
Change in median views per listing: +254% YoY
Share of homes that sold above list price: 44%
“Sebago Lake is quintessential, beautiful New England. There’s gorgeous hiking and foliage, and mountains all around the lake. In the winter, people ice fish,” said Redfin agent Megan McShane. “Out-of-state money is pouring in. I’m seeing a lot of buyers from Boston, New York and Connecticut. These are folks who always liked the idea of having a second home, but it wasn’t feasible until now because they were always tied to the office. Sebago Lake typically quiets down when it gets cold, but this year, people are staying for the winter.”
McShane continued: “I’ve never seen the market for lake houses this competitive. One of my clients missed out on two homes with five other bids after offering $50,000 over the asking price and waiving the appraisal and inspection contingencies. Another client went under contract for a $620,000 home that the owners had purchased for $400,000 in January and put no additional work into. Sellers are price gouging because buyers are paying. Buyers know the homes are overpriced, but they just want one so bad.”
6. Lakes Region, NH
Zip code: 03253
Parent metro area: Laconia, NH
Median sale price: $500,000 (+33% YoY)
Median sale price of parent metro area: $325,000 (+25% YoY)
Median days on market: 49 (-36 days YoY)
Change in home sales: +11% YoY
Change in median views per listing: +234% YoY
Share of homes that sold above list price: 44%
“Normally, a lot of New England families leave the area when they go on vacation. This year, they’re sticking around and vacationing in the Lakes Region instead. They’ll spend a week at Lake Winnipesaukee and love it so much that they’ll put in an offer on a home,” said Redfin agent Julia Martinage. “The Lakes Region has always been a hotspot, but it’s even hotter this year because no one can travel far. There are a lot of really quaint towns with cute ice cream shops and proximity to ski resorts. And in the summer, there’s hiking, paddleboarding, boating and kayaking.”
Martinage continued: “Folks from Boston, New Jersey and New York are also buying second homes in the Lakes Region so they can escape the city for the weekend and eventually retire here. But there’s very little inventory, especially for lake homes. If you’re looking for water frontage, it will likely cost you at least $1 million, unless it’s a condo. And million-dollar homes are getting multiple offers—sometimes as many as six or more. Most successful buyers are waiving every contingency.”
7. Fall River, MA
Zip code: 02723
Parent metro area: Providence, RI
Median sale price: $315,000 (+17% YoY)
Median sale price of parent metro area: $335,000 (+16% YoY)
Median days on market: 23 (-32 days YoY)
Change in home sales: +6% YoY
Change in median views per listing: +242% YoY
Share of homes that sold above list price: 67%
“Fall River is definitely an up-and-coming city. A lot of investors are buying homes here because the local transportation authority is building a train line that will go directly into Boston,” said Redfin agent Alysandra Nemeth. “The area is full of big, old, colonial homes that have been converted into three-unit apartments. Oftentimes, owners will live in one of the units and rent out the other two to help pay their mortgage.”
Nemeth continued: “Almost all of my buyers are coming from Boston. Everyone is trying to get out of the city, and they can get more for their money in Fall River. Each offer I write for a client competes with a minimum of three other bids, and homes are selling for at least the asking price, if not a little more. This is partly because inventory is so low—there are way more buyers than listings.”
8. Somerdale, NJ
Zip code: 08083
Parent metro area: Camden, NJ
Median sale price: $220,000 (+25% YoY)
Median sale price of parent metro area: $235,000 (+21% YoY)
Median days on market: 18 (-37 days YoY)
Change in home sales: +24% YoY
Change in median views per listing: +244% YoY
Share of homes that sold above list price: 52%
“Somerdale, like Stratford, borders Gloucester Township. People come to this area because they can get a lot of bang for their buck—$300,000 will buy a beautiful 4-bedroom, 2.5-bathroom home with a basement. The area has shopping, restaurants, decent schools, and proximity to Philly and the Jersey Shore,” said Redfin agent Jackie Imperato. “I’m seeing buyers move here from Philly because they’re tired of not being able to find parking and paying $400,000 for a tiny two-by-four apartment. They’re looking for an affordable spot that’s no more than 20 minutes from the city in case they need to start commuting to work again. And then you have the locals who grew up here, love being in New Jersey and have parents here, so they’re buying houses here too.”
In the past, the area’s relatively high taxes scared off some buyers and led homes to linger on the market in both Somerdale and Stratford, but with interest rates at record lows, the tax rate is no longer as big of an issue, Imperato said.
9. Washington Township, NJ
Zip code: 08012
Parent metro area: Camden, NJ
Median sale price: $215,000 (+14% YoY)
Median sale price of parent metro area: $235,000 (+21% YoY)
Median days on market: 20 (-42 days YoY)
Change in home sales: +14% YoY
Change in median views per listing: +241% YoY
Share of homes that sold above list price: 51%
“Any home that goes on the market in Washington Township is getting seven to 10 offers within hours. We’re seeing such an influx of people coming from North Jersey and Philadelphia,” said Redfin agent Jackie Imperato. “It’s a very friendly, affordable suburb with great school districts. It’s also home to the Jefferson Washington Township Hospital, a major employer in the area that’s continuing to expand and bring on more doctors and nurses.”
10. Mountain House, CA
Zip code: 95391
Parent metro area: Oakland, CA
Median sale price: $712,500 (+23% YoY)
Median sale price of parent metro area: $821,000 (+10% YoY)
Median days on market: 6 (-42 days YoY)
Change in home sales: -15% YoY
Change in median views per listing: +265% YoY
Share of homes that sold above list price: 79%
Mountain House is a planned community in California’s Central Valley, roughly 60 miles east of San Francisco. It’s divided into a dozen “villages” that have their own K-8 schools and unique architectural styles. The school district, known as one of the most highly rated in the area, is the main draw for most families, according to Redfin agent Ali Schneider.
“Mountain House was hot before the pandemic, and now it’s even hotter,” she said. “People were already moving out here because of the highly rated schools, and now we’re seeing even more families relocate to the area because Silicon Valley is shut down. They want more space and a backyard, and Mountain House offers that for a much better price. Plus, everything is new and modern; the local high school looks like a college.”
Schneider continued: “The market is very competitive, in part because inventory is extremely scarce. To win a home in Mountain House, you basically have to remove all contingencies and offer $50,000 to $75,000 over the listing price. We had bidding wars before the pandemic, but buyers certainly didn’t need to offer that much over asking to win.”
The Hottest Neighborhoods In Your Metro Area
Take a look at the list below to see the hottest neighborhoods in your region. We included the three hottest zip codes in each of the 50 most populous U.S. metropolitan areas.
Hottest Neighborhoods by Metro Area, October 2020
| Parent metro area | Neighbor-hood (zip code) | Median sale price | Median sale price, YoY change | Parent metro median sale price | Homes sold, YoY change | Median days on market | Share of homes that sold above list price | Median views per listing, YoY change |
|---|---|---|---|---|---|---|---|---|
| Anaheim, CA | 92692 | $803,000 | 24% | $795,000 | 21% | 36 | 42% | 188% |
| Anaheim, CA | 92868 | $615,500 | 2% | $795,000 | -8% | 34 | 60% | 186% |
| Anaheim, CA | 90631 | $670,000 | 11% | $795,000 | 7% | 37 | 57% | 182% |
| Atlanta, GA | 30296 | $161,000 | 8% | $285,000 | -3% | 21 | 41% | 203% |
| Atlanta, GA | 30045 | $275,000 | 8% | $285,000 | 24% | 16 | 42% | 187% |
| Atlanta, GA | 30274 | $138,500 | 14% | $285,000 | -2% | 17 | 40% | 210% |
| Austin, TX | 78754 | $285,584 | 5% | $368,000 | -21% | 10 | 54% | 280% |
| Austin, TX | 78665 | $320,000 | 7% | $368,000 | 21% | 31 | 37% | 218% |
| Austin, TX | 78641 | $332,979 | 15% | $368,000 | 28% | 35 | 32% | 215% |
| Baltimore, MD | 20714 | $330,250 | 6% | $320,000 | 50% | 32 | 39% | 204% |
| Baltimore, MD | 21102 | $390,000 | 16% | $320,000 | 53% | 24 | 39% | 203% |
| Baltimore, MD | 21117 | $282,000 | 15% | $320,000 | 14% | 13 | 42% | 195% |
| Boston, MA | 01930 | $510,500 | 16% | $550,000 | 17% | 24 | 39% | 190% |
| Boston, MA | 02571 | $320,526 | 7% | $550,000 | -8% | 21 | 45% | 196% |
| Boston, MA | 02019 | $365,000 | 14% | $550,000 | 23% | 19 | 71% | 201% |
| Charlotte, NC | 28075 | $340,000 | 5% | $297,000 | 30% | 38 | 36% | 167% |
| Charlotte, NC | 28270 | $383,000 | 7% | $297,000 | 5% | 41 | 43% | 152% |
| Charlotte, NC | 28278 | $349,891 | 12% | $297,000 | -8% | 45 | 33% | 157% |
| Chicago, IL | 60192 | $356,000 | 14% | $275,000 | 25% | 19 | 9% | 179% |
| Chicago, IL | 60171 | $222,000 | 5% | $275,000 | -20% | 13 | 41% | 191% |
| Chicago, IL | 60633 | $147,000 | 3% | $275,000 | 18% | 25 | 36% | 229% |
| Cincinnati, OH | 45229 | $173,393 | 3% | $216,000 | 39% | 57 | 31% | 195% |
| Cincinnati, OH | 45230 | $198,294 | 19% | $216,000 | 36% | 45 | 38% | 195% |
| Cincinnati, OH | 45213 | $240,000 | 27% | $216,000 | 18% | 41 | 47% | 224% |
| Cleveland, OH | 44121 | $129,950 | 37% | $177,000 | 17% | 28 | 48% | 195% |
| Cleveland, OH | 44109 | $105,000 | 28% | $177,000 | 26% | 20 | 44% | 186% |
| Cleveland, OH | 44133 | $243,500 | 29% | $177,000 | 10% | 26 | 35% | 182% |
| Columbus, OH | 43211 | $73,000 | 40% | $250,000 | 41% | 39 | 31% | 173% |
| Columbus, OH | 43054 | $416,500 | 10% | $250,000 | 13% | 45 | 42% | 150% |
| Columbus, OH | 43219 | $141,500 | 21% | $250,000 | 21% | 37 | 54% | 191% |
| Dallas, TX | 75010 | $363,750 | 5% | $324,900 | -20% | 31 | 28% | 209% |
| Dallas, TX | 75025 | $376,000 | -1% | $324,900 | 26% | 27 | 38% | 198% |
| Dallas, TX | 75094 | $411,000 | 14% | $324,900 | 32% | 30 | 29% | 186% |
| Denver, CO | 80125 | $625,000 | 14% | $470,000 | 58% | 21 | 32% | 189% |
| Denver, CO | 80421 | $445,000 | 11% | $470,000 | 49% | 11 | 35% | 182% |
| Denver, CO | 80439 | $725,000 | 18% | $470,000 | 49% | 13 | 36% | 166% |
| Detroit, MI | 48150 | $205,000 | 13% | $160,000 | 10% | 8 | 57% | 175% |
| Detroit, MI | 48202 | $185,000 | -1% | $160,000 | 26% | 59 | 16% | 176% |
| Detroit, MI | 48154 | $260,000 | 12% | $160,000 | 8% | 10 | 48% | 141% |
| Fort Lauderdale, FL | 33073 | $375,000 | 6% | $305,000 | 18% | 44 | 23% | 184% |
| Fort Lauderdale, FL | 33028 | $460,000 | 12% | $305,000 | 34% | 49 | 21% | 177% |
| Fort Lauderdale, FL | 33071 | $432,500 | 12% | $305,000 | -7% | 49 | 30% | 174% |
| Fort Worth, TX | 75054 | $362,900 | -5% | $273,000 | -1% | 33 | 31% | 159% |
| Fort Worth, TX | 76092 | $825,000 | 9% | $273,000 | 15% | 36 | 22% | 171% |
| Fort Worth, TX | 76140 | $205,000 | 15% | $273,000 | 39% | 16 | 43% | 169% |
| Houston, TX | 77450 | $282,500 | 9% | $266,069 | 24% | 15 | 25% | 191% |
| Houston, TX | 77388 | $232,750 | 7% | $266,069 | 10% | 12 | 29% | 182% |
| Houston, TX | 77380 | $302,500 | 24% | $266,069 | 64% | 31 | 14% | 185% |
| Indianapolis, IN | 46226 | $113,500 | 15% | $220,000 | -4% | 5 | 38% | 183% |
| Indianapolis, IN | 46224 | $149,000 | 5% | $220,000 | 11% | 6 | 40% | 162% |
| Indianapolis, IN | 46208 | $145,000 | 39% | $220,000 | 31% | 18 | 14% | 180% |
| Jacksonville, FL | 32223 | $299,950 | 7% | $264,000 | -4% | 35 | 22% | 177% |
| Jacksonville, FL | 32257 | $250,000 | 14% | $264,000 | 12% | 35 | 24% | 162% |
| Jacksonville, FL | 32204 | $270,000 | 8% | $264,000 | 41% | 46 | 29% | 152% |
| Kansas City, MO | 64109 | $253,750 | 52% | $250,000 | 50% | 30 | N/A | 182% |
| Kansas City, MO | 64137 | $170,000 | 29% | $250,000 | 10% | 6 | N/A | 150% |
| Kansas City, MO | 66206 | $530,000 | 20% | $250,000 | 20% | 27 | N/A | 147% |
| Las Vegas, NV | 89143 | $325,000 | 7% | $317,000 | -10% | 14 | 32% | 204% |
| Las Vegas, NV | 89101 | $233,000 | 4% | $317,000 | 5% | 71 | 26% | 179% |
| Las Vegas, NV | 89129 | $315,000 | 6% | $317,000 | 0% | 30 | 24% | 190% |
| Los Angeles, CA | 93543 | $351,750 | 17% | $735,000 | -13% | 21 | 50% | 298% |
| Los Angeles, CA | 93551 | $472,500 | 15% | $735,000 | 6% | 13 | 55% | 242% |
| Los Angeles, CA | 93536 | $410,000 | 11% | $735,000 | 19% | 10 | 57% | 232% |
| Miami, FL | 33174 | $314,000 | -7% | $350,000 | 22% | 37 | 11% | 174% |
| Miami, FL | 33133 | $605,000 | 9% | $350,000 | 14% | 97 | 4% | 175% |
| Miami, FL | 33186 | $340,000 | 9% | $350,000 | 11% | 40 | 23% | 215% |
| Milwaukee, WI | 53218 | $112,000 | 24% | $245,000 | 22% | 48 | 47% | 210% |
| Milwaukee, WI | 53208 | $175,000 | 6% | $245,000 | 2% | 45 | 46% | 203% |
| Milwaukee, WI | 53226 | $290,000 | 17% | $245,000 | 21% | 43 | 51% | 221% |
| Minneapolis, MN | 55115 | $440,000 | 13% | $315,000 | 74% | 24 | 45% | 200% |
| Minneapolis, MN | 55346 | $380,000 | 12% | $315,000 | -1% | 13 | 66% | 188% |
| Minneapolis, MN | 55441 | $372,825 | 6% | $315,000 | 14% | 12 | 55% | 168% |
| Montgomery County, PA | 18951 | $260,000 | 11% | $365,000 | 12% | 11 | 40% | 173% |
| Montgomery County, PA | 19040 | $340,450 | 10% | $365,000 | 27% | 20 | 43% | 182% |
| Montgomery County, PA | 18964 | $323,000 | 20% | $365,000 | 42% | 19 | 51% | 171% |
| Nashville, TN | 37015 | $239,900 | 4% | $336,130 | 22% | 41 | 25% | 214% |
| Nashville, TN | 37220 | $614,500 | 10% | $336,130 | 11% | 32 | 30% | 173% |
| Nashville, TN | 37069 | $667,000 | 36% | $336,130 | 42% | 33 | 34% | 159% |
| Nassau County, NY | 11792 | $504,995 | 11% | $530,000 | 82% | 47 | 26% | 209% |
| Nassau County, NY | 11741 | $425,000 | 6% | $530,000 | -11% | 22 | 50% | 183% |
| Nassau County, NY | 11762 | $550,000 | 10% | $530,000 | -16% | 34 | 39% | 178% |
| New Brunswick, NJ | 07001 | $300,000 | 9% | $383,000 | 23% | 29 | 51% | 241% |
| New Brunswick, NJ | 08902 | $342,500 | 6% | $383,000 | 2% | 36 | 40% | 255% |
| New Brunswick, NJ | 07716 | $557,500 | 55% | $383,000 | 39% | 23 | 46% | 208% |
| New York, NY | 07670 | $1,035,000 | 25% | $550,000 | 67% | 93 | 19% | 195% |
| New York, NY | 10504 | $1,127,000 | 13% | $550,000 | 104% | 46 | 25% | 188% |
| New York, NY | 10576 | $980,000 | 11% | $550,000 | 207% | 98 | 28% | 254% |
| Newark, NJ | 07090 | $812,000 | 16% | $432,250 | 55% | 22 | 41% | 227% |
| Newark, NJ | 07009 | $529,900 | 7% | $432,250 | 44% | 22 | 64% | 205% |
| Newark, NJ | 07065 | $350,000 | 14% | $432,250 | 0% | 19 | 55% | 231% |
| Oakland, CA | 95391 | $712,500 | 23% | $821,000 | -15% | 6 | 79% | 265% |
| Oakland, CA | 94582 | $1,170,000 | 8% | $821,000 | 57% | 10 | 60% | 218% |
| Oakland, CA | 94507 | $2,025,000 | 13% | $821,000 | 38% | 13 | 53% | 214% |
| Orlando, FL | 32814 | $490,000 | -3% | $284,000 | -2% | 28 | 5% | 164% |
| Orlando, FL | 32779 | $375,000 | 7% | $284,000 | 36% | 19 | 16% | 175% |
| Orlando, FL | 32750 | $298,250 | 13% | $284,000 | 5% | 9 | 29% | 158% |
| Philadelphia, PA | 19140 | $69,501 | 2% | $242,000 | 21% | 29 | 25% | 200% |
| Philadelphia, PA | 19023 | $96,000 | 32% | $242,000 | 39% | 31 | 30% | 215% |
| Philadelphia, PA | 19032 | $143,000 | 19% | $242,000 | 6% | 22 | 43% | 212% |
| Phoenix, AZ | 85028 | $474,325 | 18% | $339,000 | -14% | 34 | 24% | 195% |
| Phoenix, AZ | 85238 | $260,000 | 15% | $339,000 | 3% | 32 | 44% | 188% |
| Phoenix, AZ | 85087 | $449,500 | 18% | $339,000 | 12% | 37 | 19% | 179% |
| Pittsburgh, PA | 15235 | $129,700 | 18% | $200,000 | 27% | 57 | 42% | 186% |
| Pittsburgh, PA | 15024 | $168,000 | 2% | $200,000 | 27% | 50 | 45% | 177% |
| Pittsburgh, PA | 15146 | $181,900 | 21% | $200,000 | 41% | 51 | 48% | 187% |
| Portland, OR | 97038 | $390,000 | 13% | $450,000 | -3% | 11 | 52% | 217% |
| Portland, OR | 98686 | $489,900 | 18% | $450,000 | -6% | 12 | 53% | 195% |
| Portland, OR | 97218 | $430,000 | 11% | $450,000 | 51% | 8 | 59% | 190% |
| Providence, RI | 02723 | $315,000 | 17% | $335,000 | 6% | 23 | 67% | 242% |
| Providence, RI | 02777 | $370,000 | 16% | $335,000 | 11% | 21 | 49% | 227% |
| Providence, RI | 02720 | $297,500 | 9% | $335,000 | 12% | 23 | 57% | 233% |
| Riverside, CA | 92386 | $220,000 | 9% | $439,000 | 79% | 35 | 50% | 255% |
| Riverside, CA | 92308 | $283,500 | 1% | $439,000 | 26% | 37 | 56% | 244% |
| Riverside, CA | 92505 | $435,000 | 5% | $439,000 | -10% | 21 | 66% | 228% |
| Sacramento, CA | 96145 | $945,000 | 28% | $480,000 | 87% | 48 | 36% | 280% |
| Sacramento, CA | 96140 | $786,000 | 30% | $480,000 | 86% | 45 | 41% | 241% |
| Sacramento, CA | 96142 | $655,000 | 1% | $480,000 | 39% | 42 | 64% | 399% |
| San Antonio, TX | 78623 | $334,500 | 22% | $260,000 | 57% | 34 | 33% | 184% |
| San Antonio, TX | 78256 | $405,000 | -6% | $260,000 | -13% | 39 | 30% | 165% |
| San Antonio, TX | 78260 | $375,000 | 2% | $260,000 | 2% | 34 | 26% | 161% |
| San Diego, CA | 92078 | $697,000 | 13% | $660,000 | 18% | 11 | 49% | 199% |
| San Diego, CA | 92029 | $789,000 | 7% | $660,000 | 22% | 14 | 41% | 200% |
| San Diego, CA | 92011 | $1,050,000 | 19% | $660,000 | 80% | 20 | 39% | 182% |
| San Francisco, CA | 94019 | $1,551,000 | 29% | $1,425,000 | 71% | 27 | 53% | 206% |
| San Francisco, CA | 94002 | $1,925,000 | 13% | $1,425,000 | 25% | 12 | 68% | 161% |
| San Francisco, CA | 94062 | $2,125,000 | 11% | $1,425,000 | 50% | 26 | 50% | 152% |
| San Jose, CA | 95037 | $997,500 | 6% | $1,238,000 | 39% | 28 | 58% | 208% |
| San Jose, CA | 95120 | $1,600,000 | 7% | $1,238,000 | 68% | 14 | 61% | 188% |
| San Jose, CA | 95030 | $2,849,000 | -3% | $1,238,000 | 68% | 34 | 40% | 177% |
| Seattle, WA | 98072 | $872,500 | 17% | $635,000 | 4% | 7 | 54% | 212% |
| Seattle, WA | 98021 | $750,000 | 0% | $635,000 | 16% | 6 | 61% | 207% |
| Seattle, WA | 98011 | $739,400 | 7% | $635,000 | 36% | 7 | 42% | 204% |
| St. Louis, MO | 63126 | $256,000 | 12% | $212,250 | 49% | 8 | 54% | 180% |
| St. Louis, MO | 63304 | $275,000 | 8% | $212,250 | 13% | 8 | 44% | 190% |
| St. Louis, MO | 63132 | $330,000 | 15% | $212,250 | 2% | 27 | 36% | 167% |
| Tampa, FL | 33776 | $352,750 | 1% | $269,900 | 5% | 7 | 28% | 179% |
| Tampa, FL | 33773 | $241,500 | 15% | $269,900 | -20% | 8 | 33% | 195% |
| Tampa, FL | 33544 | $310,000 | 24% | $269,900 | 20% | 11 | 27% | 174% |
| Virginia Beach, VA | 23455 | $335,000 | 17% | $265,000 | 19% | 26 | 29% | 210% |
| Virginia Beach, VA | 23508 | $325,000 | 8% | $265,000 | 8% | 27 | 22% | 200% |
| Virginia Beach, VA | 23454 | $320,100 | 14% | $265,000 | 14% | 26 | 35% | 213% |
| Warren, MI | 48324 | $375,000 | 18% | $245,000 | 13% | 25 | 36% | 180% |
| Warren, MI | 48237 | $175,000 | 17% | $245,000 | 1% | 12 | 53% | 171% |
| Warren, MI | 48335 | $303,500 | 4% | $245,000 | 5% | 17 | 43% | 181% |
| Washington, DC | 20607 | $450,000 | 24% | $457,730 | 21% | 29 | 51% | 221% |
| Washington, DC | 22701 | $332,150 | 12% | $457,730 | 20% | 30 | 41% | 196% |
| Washington, DC | 22406 | $400,000 | 5% | $457,730 | 30% | 22 | 47% | 188% |
| West Palm Beach, FL | 33414 | $419,900 | 11% | $334,000 | 36% | 59 | 15% | 170% |
| West Palm Beach, FL | 33436 | $300,000 | 15% | $334,000 | 17% | 55 | 12% | 173% |
| West Palm Beach, FL | 33496 | $465,000 | 39% | $334,000 | 23% | 80 | 8% | 182% |
Methodology
Redfin’s hottest neighborhoods algorithm is a prediction of the most competitive U.S. zip codes based on year-over-year growth in median views per listing on Redfin.com and year-over-year growth in Redfin Compete Score. Redfin Compete Score rates how difficult it is to win a home in an area using a combination of proprietary Redfin data and data from local multiple listing services. It is primarily calculated based on the following inputs: days on market, share of homes that sold above their listing prices and sale-to-list price ratio.
“Year over year” means that we compared October 2020 values with October 2019 values. To make it into the top 10 list or the table above, zip codes had to have at least 40 home sales in October 2020 and at least 20 median views per listing in 2019.
 United States
 Canada