Homebuyers and sellers are unlikely to face another large mortgage rate jump after the Federal Reserve indicated it intends to pause interest rate increases following a year of aggressive hikes.
Elevated mortgage rates are prompting many homeowners to stay put, resulting in bidding wars as buyers compete for a small pool of homes. But buyers and sellers can at least take a little comfort in knowing the Federal Reserve probably won’t raise interest rates again anytime soon.
“While a pause in Fed rate hikes doesn’t mean a significant drop in mortgage rates is coming, it does at least alleviate one layer of uncertainty in the housing market,” said Redfin Economics Research Lead Chen Zhao. “Unexpectedly bad inflation data, more banking turmoil or failure to raise the U.S. debt ceiling could throw a wrench in the Fed’s plans, but homebuyers and sellers can feel a little more confident that mortgage rates won’t skyrocket again.”
For now, homes are getting snatched up quickly as a shortage of listings sparks bidding wars between the buyers who remain in the market despite elevated mortgage rates.
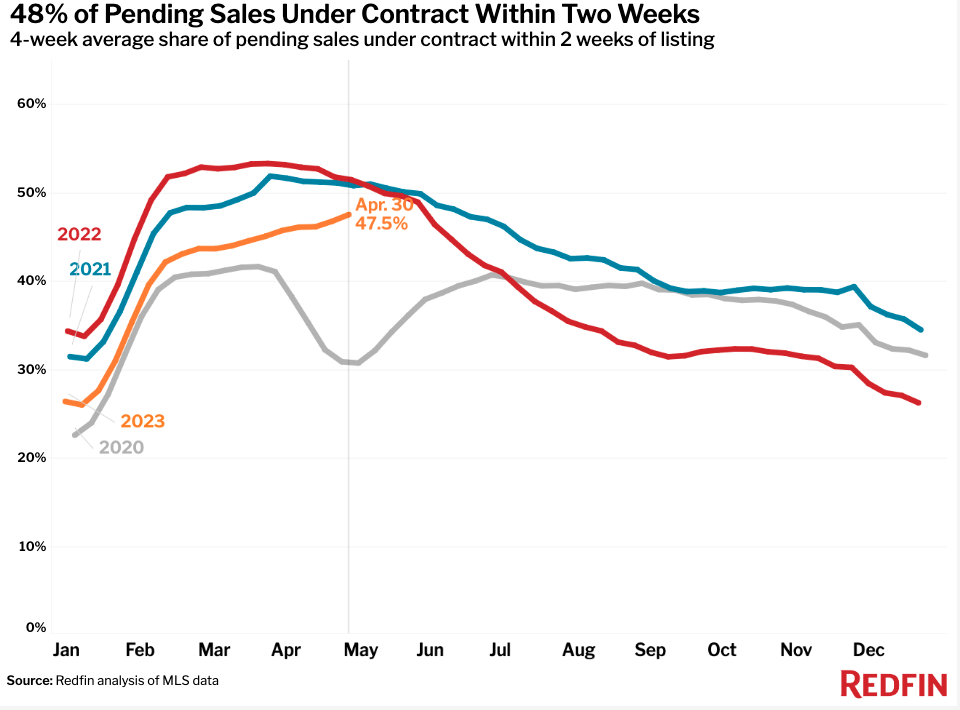
Nearly half (48%) of homes that sold during the four weeks ending April 30 went under contract within two weeks, down from 51% a year earlier but up from 46% a month earlier. While that jump may seem small, it’s notable because the share of homes selling in two weeks typically falls in April after peaking in March. We haven’t yet seen signs of a peak this year.
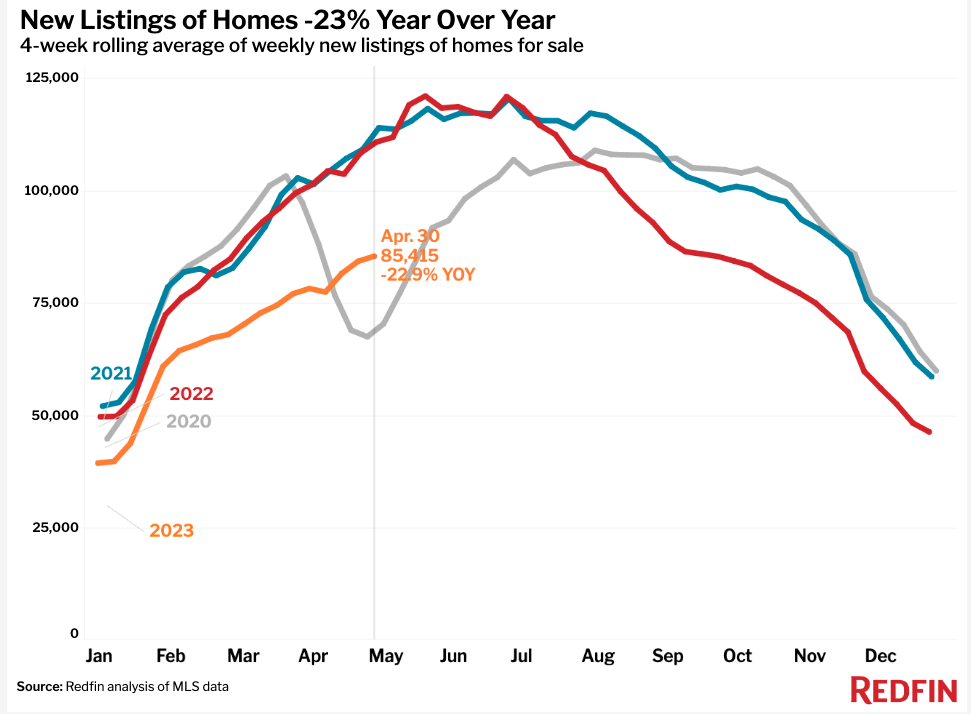
Redfin agents say reasonably priced homes in desirable areas are selling especially quickly as buyers compete for a limited number of homes for sale. New listings in April were down 23% from a year earlier, the second biggest decline since the start of the pandemic. That outpaced the 17% year-over-year decline in pending sales, a gauge of how many buyers are in the market.
“I received five offers on a house that I listed on Thursday,” said Lindsay Katz, a Redfin Premier real estate agent in Los Angeles. “One of my other sellers got a full-price offer on her $1.15 million home, but had to cancel the listing because with prices and rates so high and inventory so low, she couldn’t find another home she could afford. She wouldn’t even qualify to buy her own home anymore.”
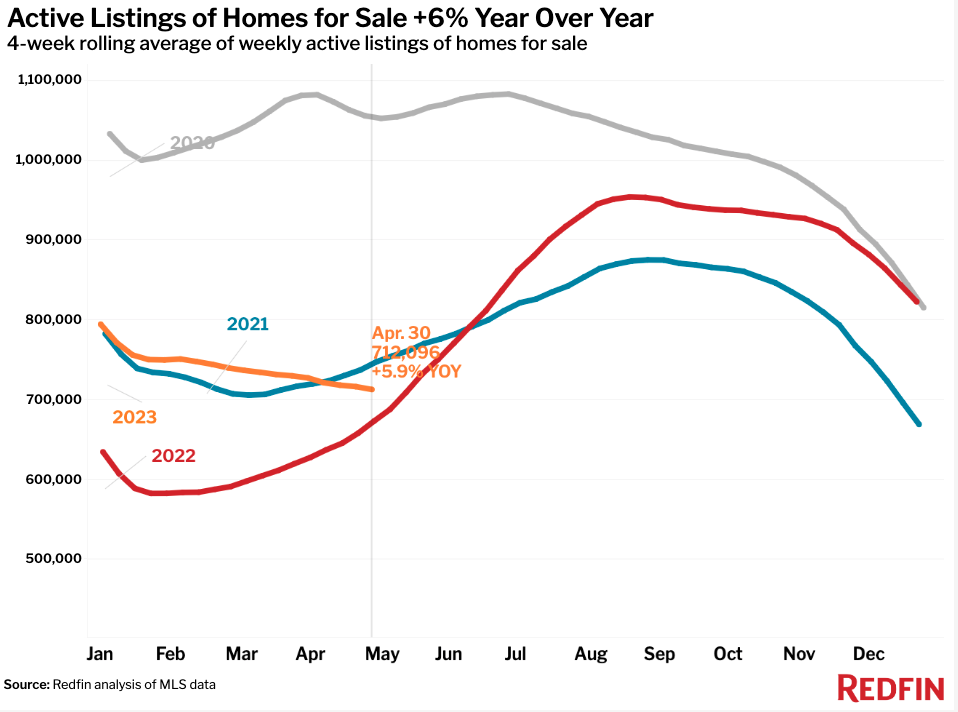
The total number of homes for sale has steadily declined over the last month, going against the typical spring inventory bump. That’s because buyers are draining the supply of homes for sale faster than sellers are filling the sink with new listings. New listings and pending sales did both rise on a month-over-month basis in April, which is typical for springtime.
“A lot of homeowners are just now expressing interest in selling, whereas in a typical year that would have happened a month or two ago,” said Steve Centrella, a Redfin Premier agent in Washington, D.C. “Some sellers are coming forward because they’re noticing there are buyers out there, in spite of high rates. A lot of them are sellers who aren’t also buyers, like people listing a second home or rental property. They’re not as hesitant to give up a low mortgage rate because they’re not turning around and taking on a higher one.”
Leading indicators of homebuying activity:
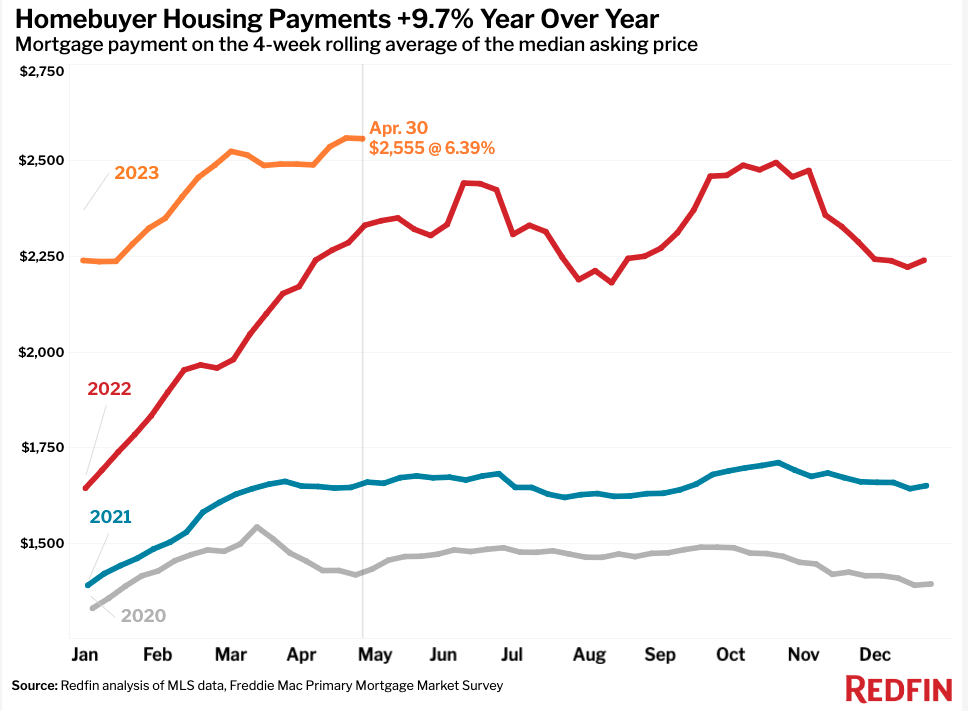
- For the week ending May 4, the average 30-year fixed mortgage rate was 6.39%, down slightly from 6.43% the week before. The daily average was 6.45% on May 4.
- Mortgage-purchase applications during the week ending April 28 decreased 2% from a week earlier, seasonally adjusted. Purchase applications were down 32% from a year earlier.
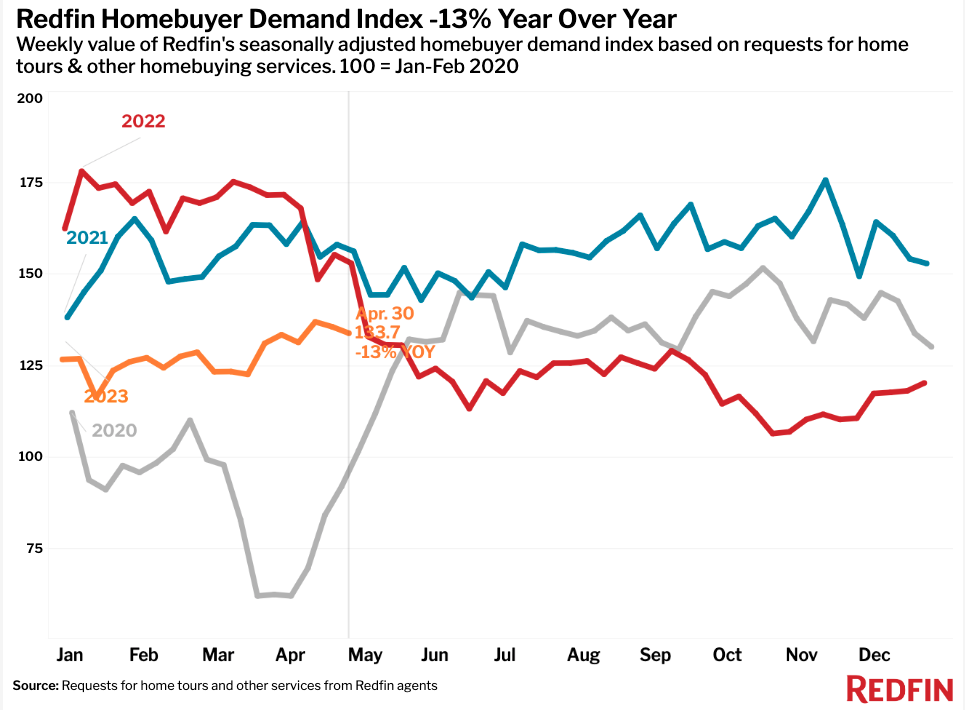
- The seasonally adjusted Redfin Homebuyer Demand Index–a measure of requests for home tours and other homebuying services from Redfin agents–was little changed from a month earlier during the week ending April 30, and down 13% from a year earlier.
- Google searches for “homes for sale” were little changed from a month earlier during the week ending April 29, and down about 13% from a year earlier.
- Touring activity as of May 3 was up 27.3% from the start of the year, compared with an 18.9% increase at the same time last year, according to home tour technology company ShowingTime.
Key housing market takeaways for 400+ U.S. metro areas:
Unless otherwise noted, the data in this report covers the four-week period ending April 30. Redfin’s weekly housing market data goes back through 2015.
Data based on homes listed and/or sold during the period:
For bullets that include metro-level breakdowns, Redfin analyzed the 50 most populous U.S. metros. Select metros may be excluded from time to time to ensure data accuracy.
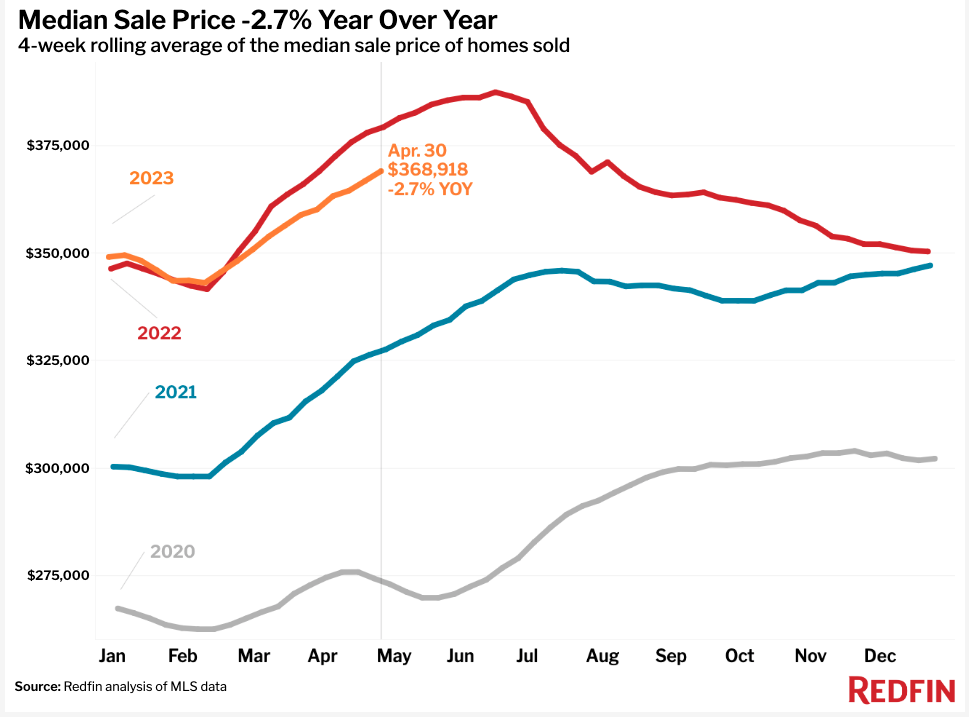
- The median home sale price was $368,918, down 2.7% from a year earlier. That’s the 10th-straight four-week period of declines.
- Home-sale prices declined in 32 metros, with the biggest drops Oakland, CA (-15.6% YoY), Austin, TX (-15.2%), San Francisco (-13.3%), Anaheim, CA (-10.2%) and Sacramento, CA (-9.6%).
- Sale prices increased most in Fort Lauderdale, FL (10.6% YoY), Miami (7.8%), Milwaukee (7.8%) , Cincinnati (7.6%) and Newark, NJ (6.4%).
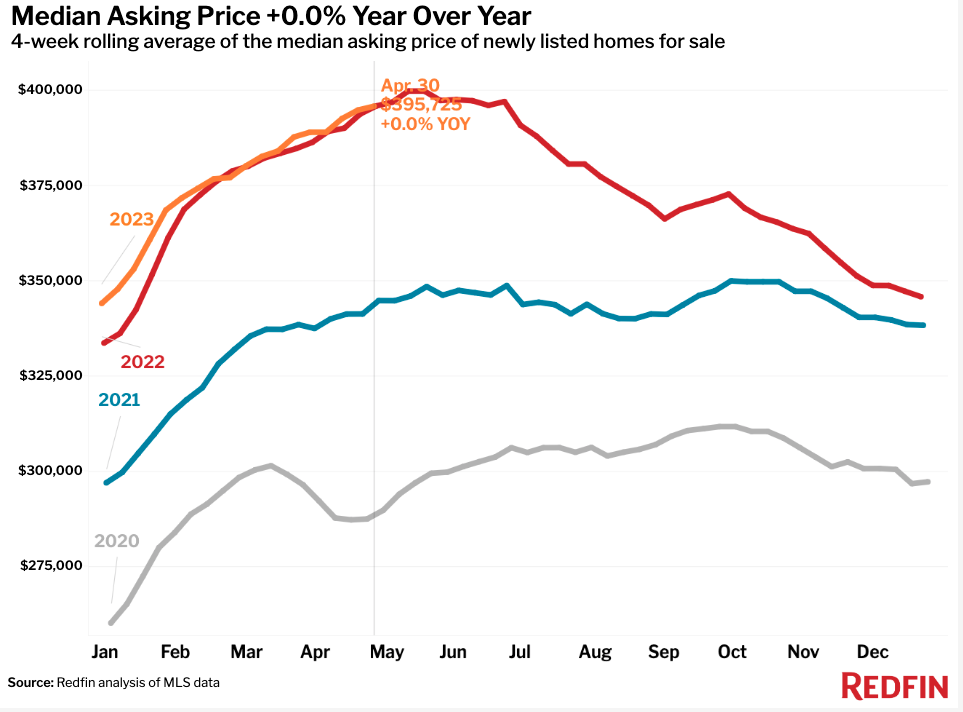
- The median asking price of newly listed homes was $395,725, unchanged from a year earlier.
- The monthly mortgage payment on the median-asking-price home was $2,555 at a 6.39% mortgage rate, the current weekly average. That’s just shy of the $2,557 record hit during the prior week and is up 9.7% ($225) from a year earlier.
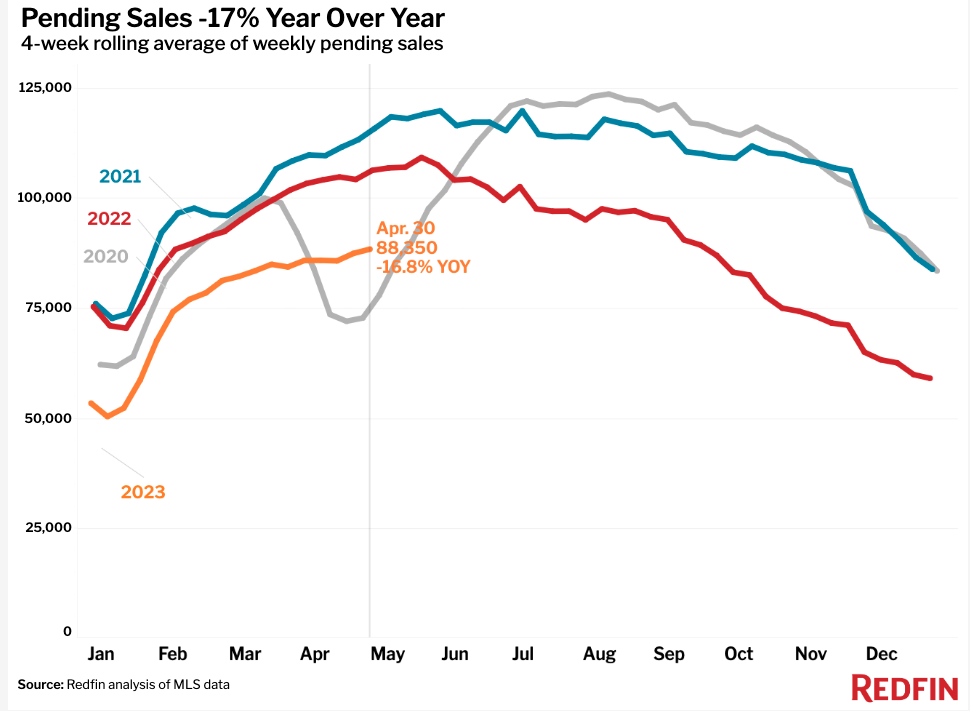
- Pending home sales were down 16.8% year over year. They rose 3% on a month-over-month basis—typical for this time of year.
- Pending home sales fell in all metros Redfin analyzed. They declined most in Seattle (-35.5% YoY), San Francisco (-33.2%), Oakland (-32.9%), Portland, OR ( -32.6%) and New York (-31%).
- New listings of homes for sale fell 22.9% year over year, the second-biggest decline since May 2020 (the biggest was during the four weeks ending April 9, which included the Easter holiday). They rose 9.2% on a month-over-month basis—typical for this time of year.
- New listings declined in all metros Redfin analyzed. They dropped most in San Diego (-41.7% YoY), Seattle (-41.6%), Oakland (-39.2%), Sacramento (-38.8%) and Riverside, CA (-38.7%).
- Active listings (the number of homes listed for sale at any point during the period) were up 5.9% from a year earlier, the smallest increase since summer. Active listings fell 2% from a month earlier; typically, they post month-over-month increases at this time of year.
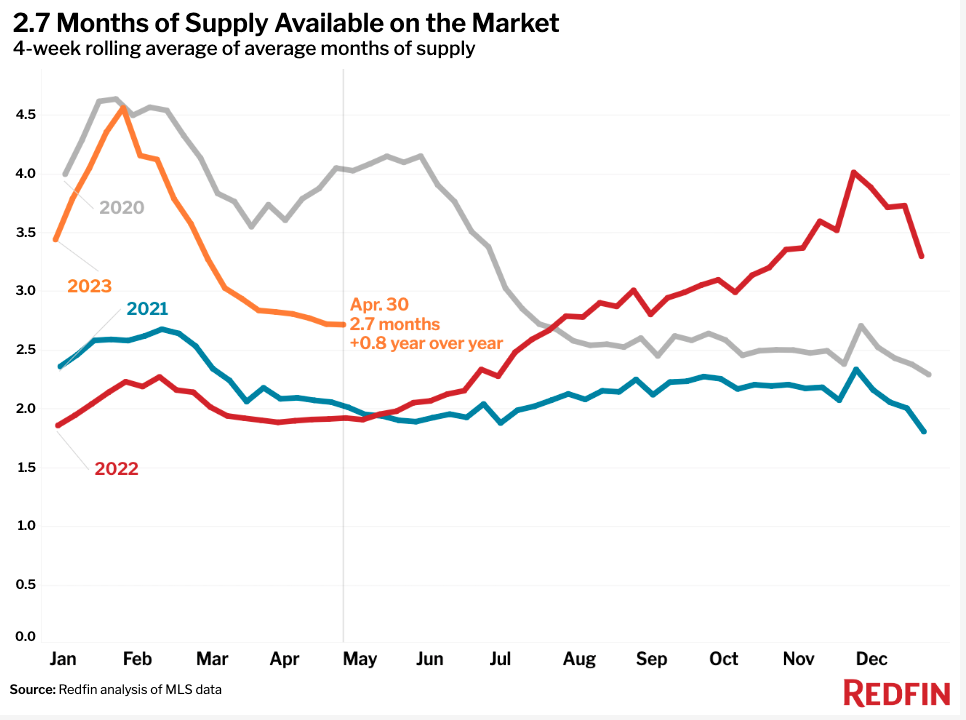
- Months of supply—a measure of the balance between supply and demand, calculated by the number of months it would take for the current inventory to sell at the current sales pace—was 2.7 months, up from 1.9 months a year earlier. Four to five months of supply is considered balanced, with a lower number indicating seller’s market conditions.
- 47.5% of homes that went under contract had an accepted offer within the first two weeks on the market, down from 51.5% a year earlier but up from 45.7% a month earlier. Typically, we see month-over-month declines at this time of year; in all but two of the last eight years, this metric peaked in March.
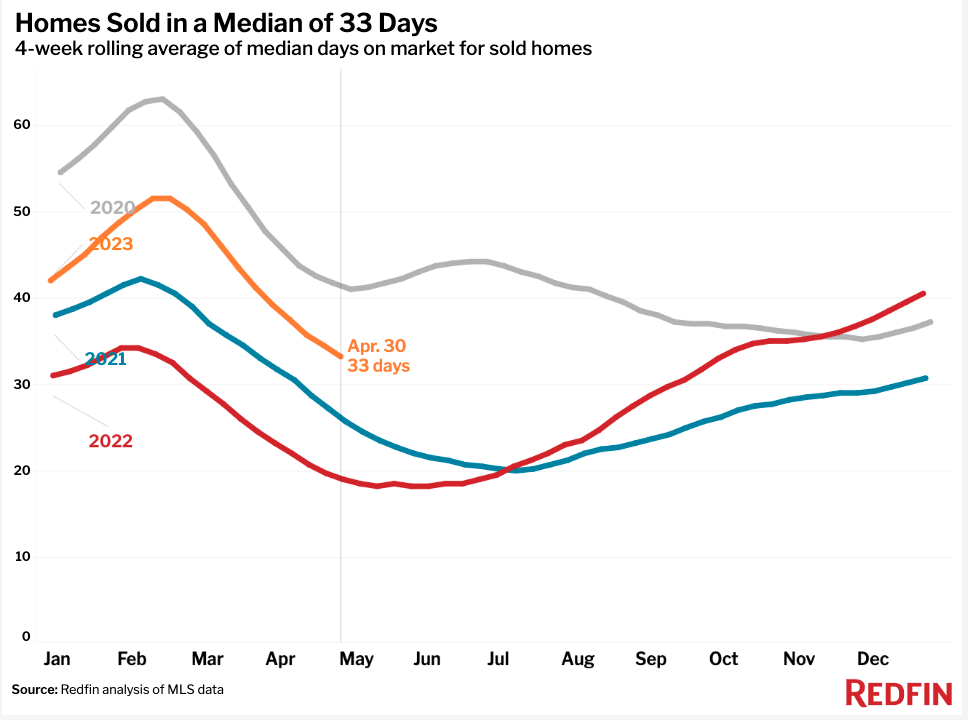
- Homes that sold were on the market for a median of 33 days, the shortest span since October. That’s up from 19 days a year earlier, which was close to the record low.
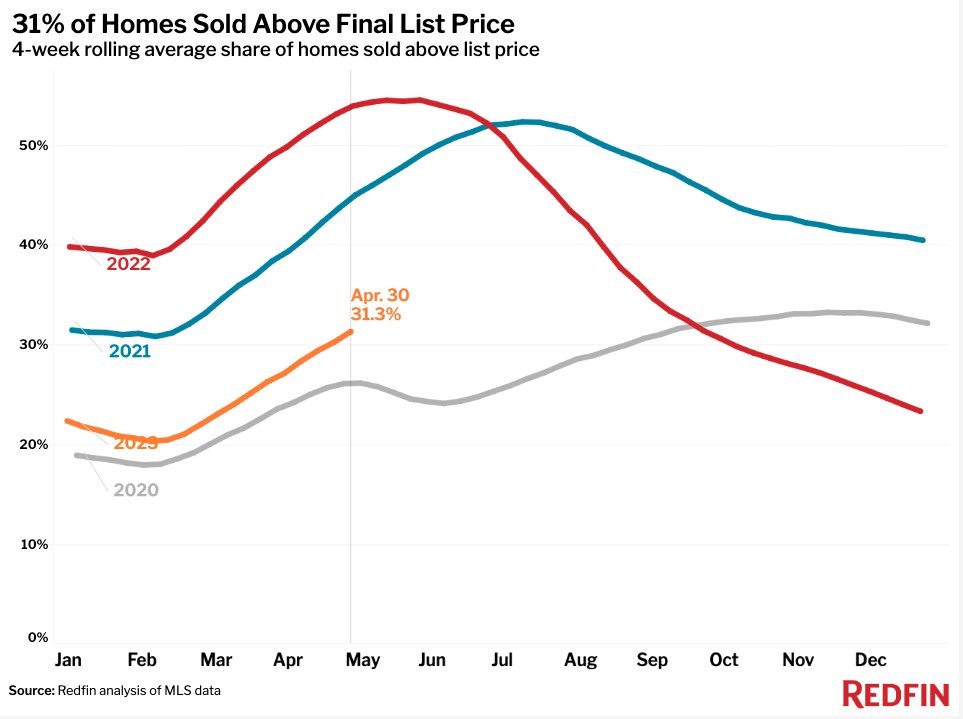
- 31.3% of homes sold above their final list price. That’s the highest share since September but is down from 53.9% a year earlier.
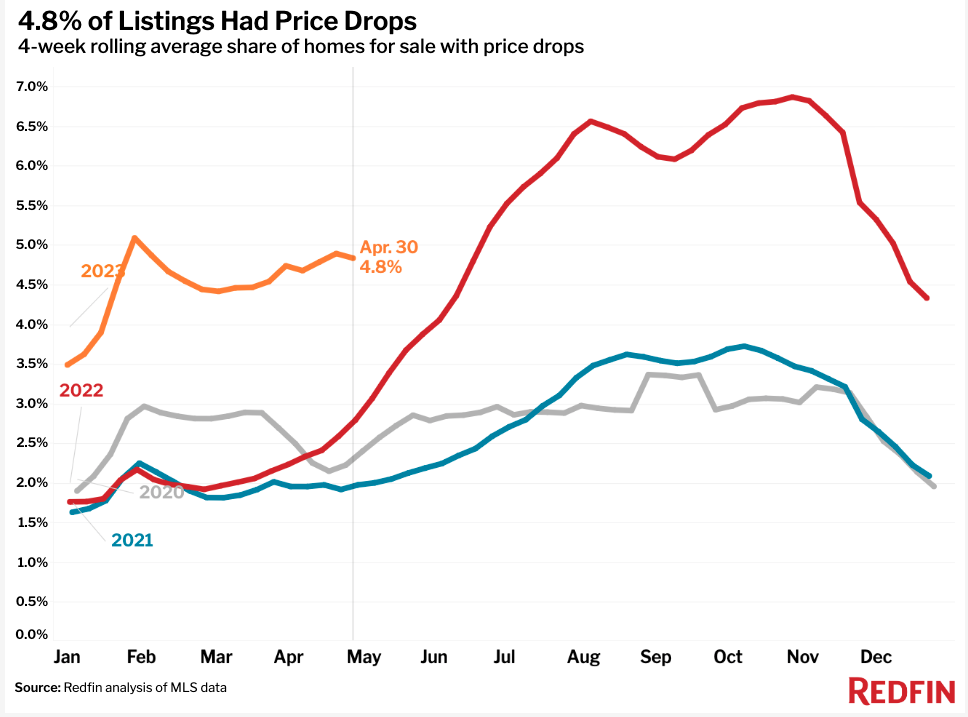
- On average, 4.8% of homes for sale each week had a price drop, up from 2.8% a year earlier.
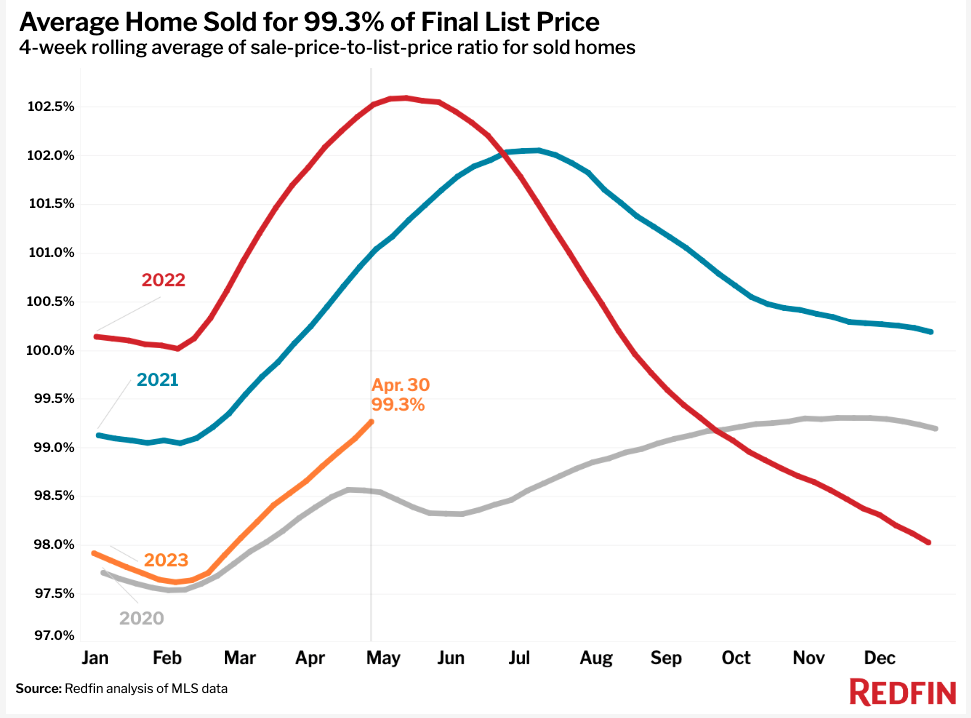
- The average sale-to-list price ratio, which measures how close homes are selling to their final asking prices, was 99.3%. That’s the highest level since September but is down from 102.5% a year earlier.
Refer to our metrics definition page for explanations of all the metrics used in this report.
 United States
 Canada