Whether more buyers return to the market depends largely on how the Fed reacts to unrest in the banking industry alongside persistent inflation. If the Fed presses pause on interest-rate hikes next week or announces just a small increase, mortgage rates will drop.
Some homebuyers are returning to the market as mortgage rates decline from the four-month high they reached last week. Daily average mortgage rates dropped from 7% to about 6.5% over the weekend in the wake of Silicon Valley Bank’s collapse. U.S. home prices also fell, dropping 1.8% year over year during the four weeks ending March 12, the biggest decline in over a decade.
Sidelined buyers reacted quickly: Bay Equity, Redfin’s mortgage-lending company, locked a rate on more loans this past Friday (March 10) than any other day so far this year. Overall, U.S. mortgage-purchase applications increased 7% from the week before during the week ending March 10.
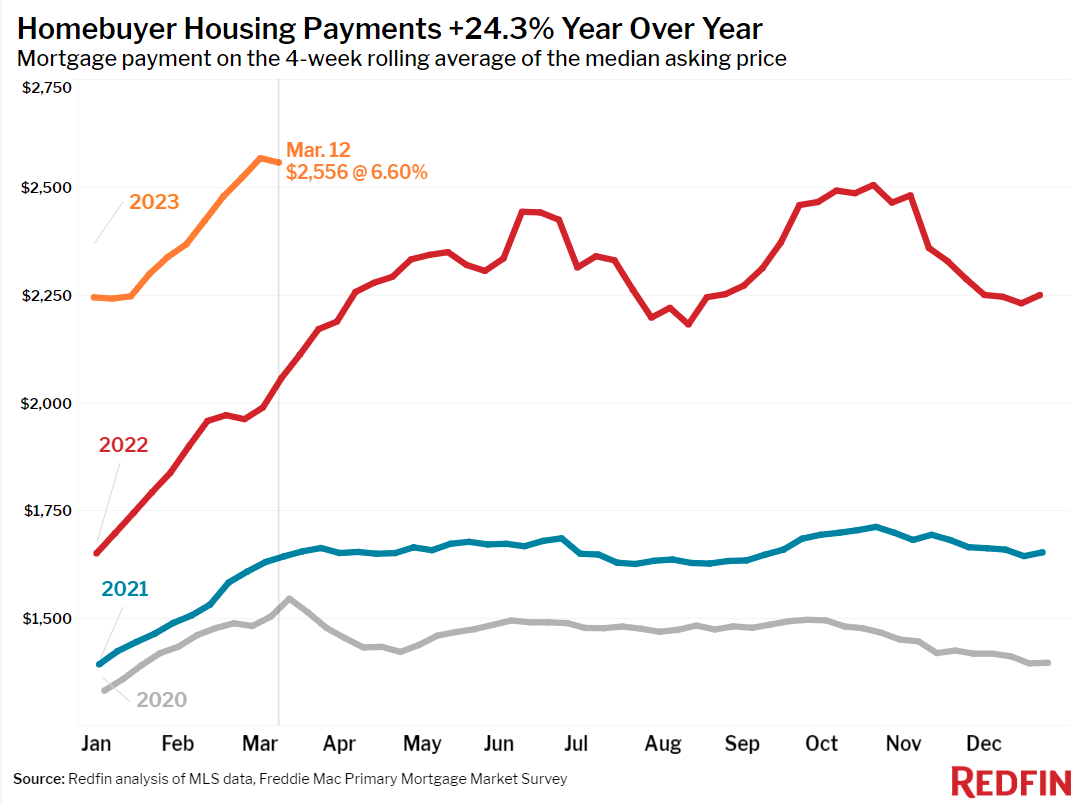
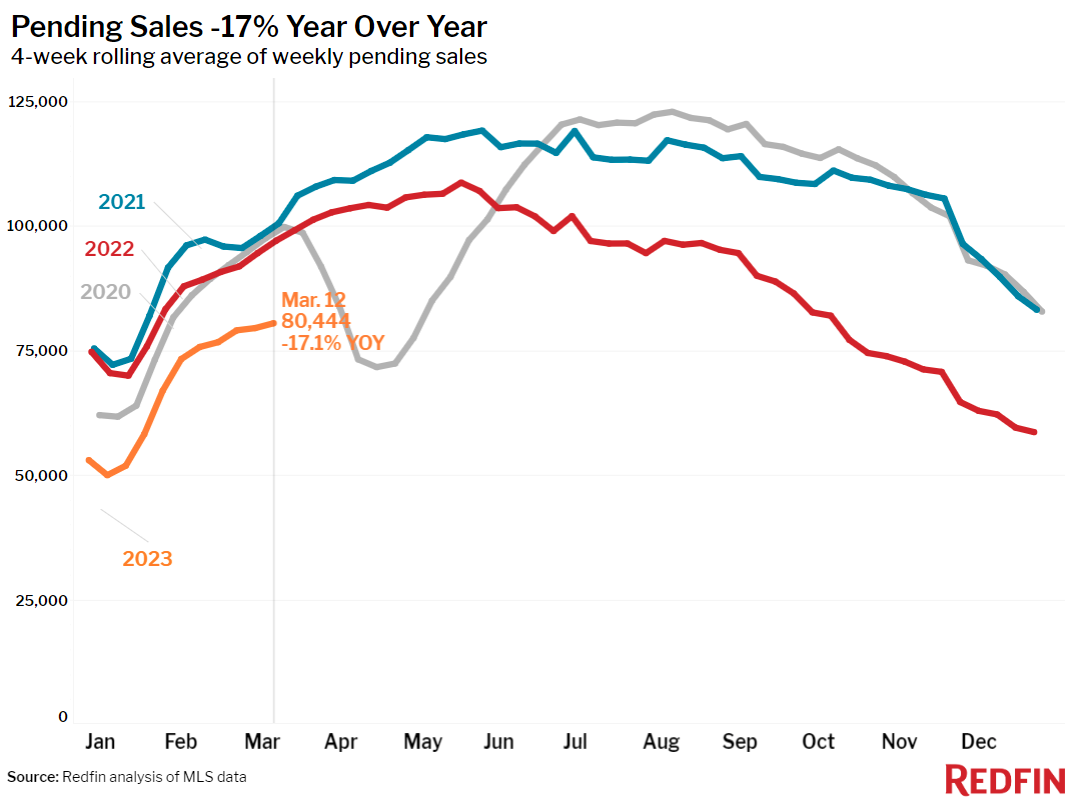
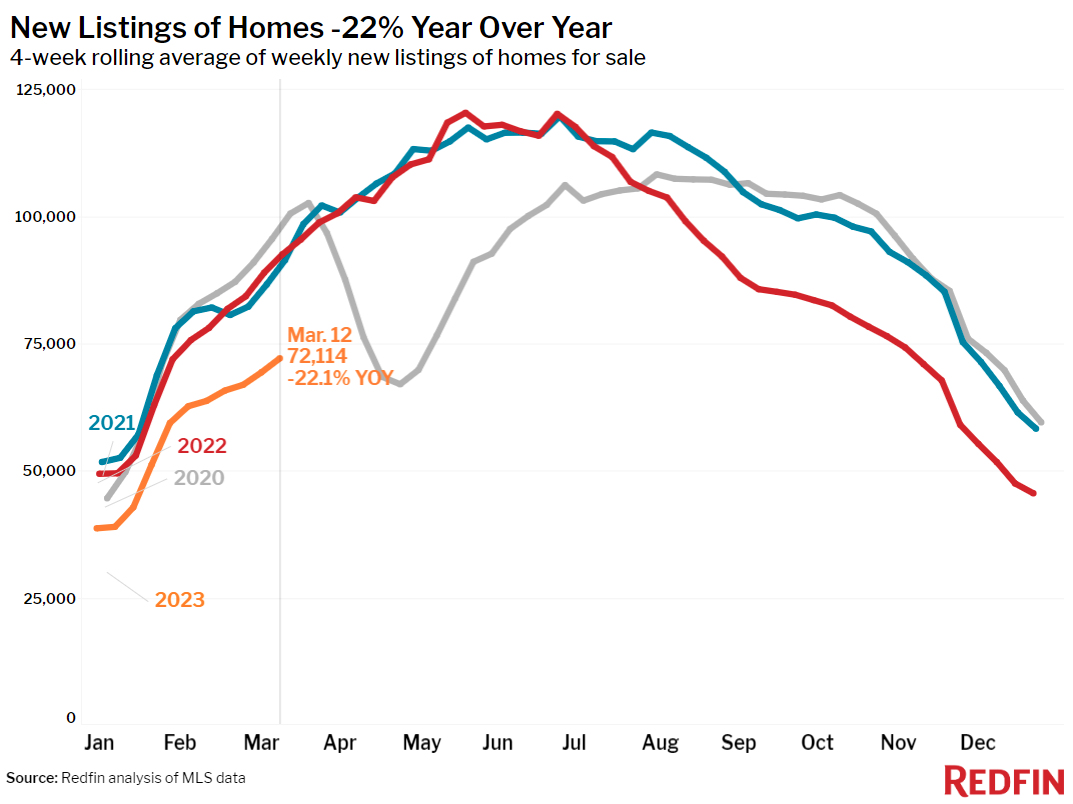
But overall homebuying demand remains tepid, especially compared with the same period last year. That’s largely because housing payments are still near historic highs: The typical homebuyer’s monthly mortgage payment is $2,556, down marginally from last week’s record high but up 24% from a year ago. Pending home sales are down 17% year over year, the biggest decline in six weeks. Demand is also limited by low supply; new listings of homes for sale posted their biggest annual drop in nearly three months.
“Buyers pounced when rates fell because they’re so volatile right now, which shows that there are plenty of people waiting in the wings for the right time to enter the market. Where mortgage rates go from here largely depends on how the Fed reacts to chaos in the banking industry in the U.S. and abroad, alongside stubbornly high inflation,” said Redfin Economics Research Lead Chen Zhao. “The Fed’s goal at its meeting next week is to achieve a balancing act: Fight inflation while keeping the banking system intact. Even though the European Central Bank hiked interest rates more than expected this morning, it’s unlikely the Fed will follow suit. Instead, we expect them to either raise rates modestly or press pause for the time being, the latter of which would send mortgage rates down and bring back many sidelined buyers and sellers.”
While the unrest in the banking system may lower rates and bring back some buyers in most of the country, it’s likely to further spook buyers in certain areas. Housing markets in the Bay Area and New York, home to the three regional banks that have tumbled over the last week–along with many tech workers who have either been laid off or are worried about being laid off–are already feeling the pain.
“Some buyers are canceling their contracts or bowing out of their home search because they work in tech and they’re worried about losing their jobs,” said Bay Area Redfin manager Shelley Rocha. “The surge in tech layoffs was already causing jitters, and now the bank failures are adding to buyers’ nerves.”
Leading indicators of homebuying activity:
- For the week ending March 16, average 30-year fixed mortgage rates dropped to 6.6%, the first decline after five straight weeks of increases. The daily average was 6.54% on March 16.
- Mortgage-purchase applications during the week ending March 10 increased 7% from a week earlier, seasonally adjusted. Purchase applications were down 38% from a year earlier.
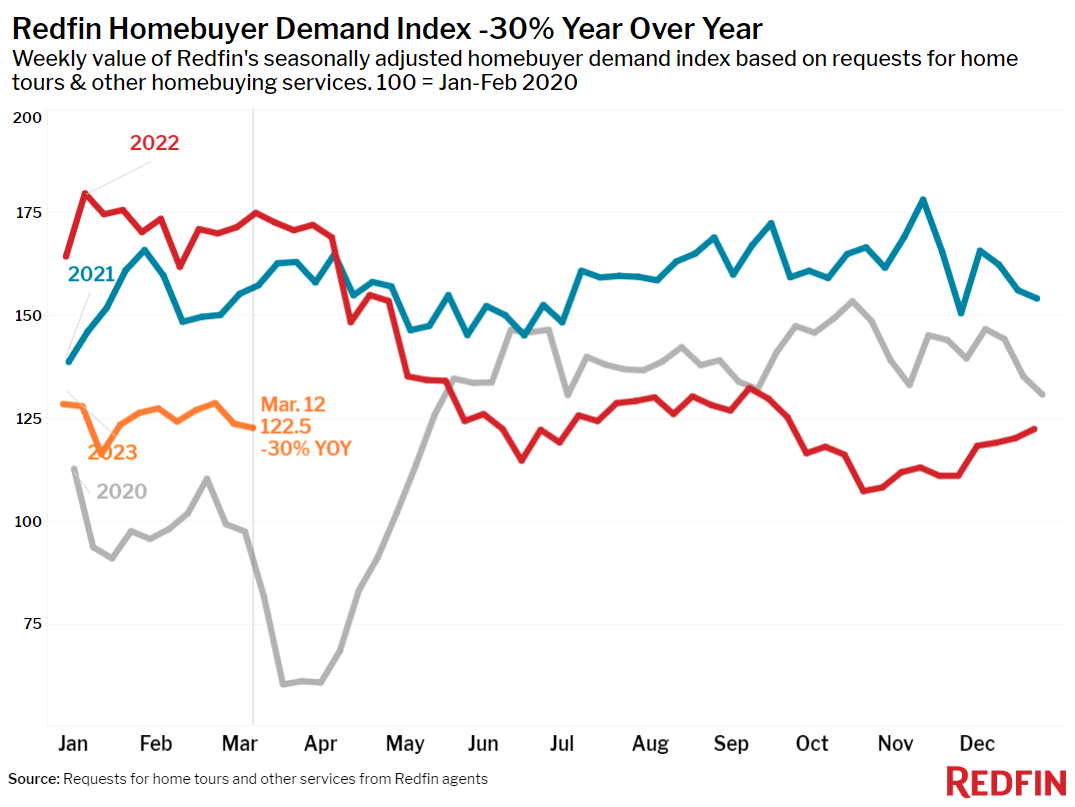
- The seasonally adjusted Redfin Homebuyer Demand Index–a measure of requests for home tours and other homebuying services from Redfin agents–was essentially flat from a week earlier (down -0.8%) during the week ending March 12. It was down 30% from a year earlier.
- Google searches for “homes for sale” were up about 40% from the trough they hit in December during the week ending March 11, but down about 14% from a year earlier.
- Touring activity as of March 11 was up about 19% from the start of the year, compared with a 22% increase at the same time last year, according to home tour technology company ShowingTime.
Key housing market takeaways for 400+ U.S. metro areas:
Unless otherwise noted, the data in this report covers the four-week period ending March 12. Redfin’s weekly housing market data goes back through 2015.
Data based on homes listed and/or sold during the period:
- The median home sale price was $355,668, down 1.8% from a year earlier. That’s the biggest decline in at least a decade, according to Redfin’s monthly dataset, which goes back through 2012.
- Median sale prices fell in 24 of the 50 most populous U.S. metros, with the biggest drops in northern California. San Jose, CA (-17.2% YoY) experienced the biggest decline, followed by Austin, TX (-13%), San Francisco (-11%), Oakland, CA (-10.9%) and Sacramento, CA (-8.6%). That’s the biggest sale-price drop since at least 2015 for San Jose, Austin and Sacramento.
- Sale prices increased most in West Palm Beach, FL (12.7%), Milwaukee (9%), Fort Lauderdale, FL (7.2%), Virginia Beach, VA (6.9%) and Miami (6.8%).
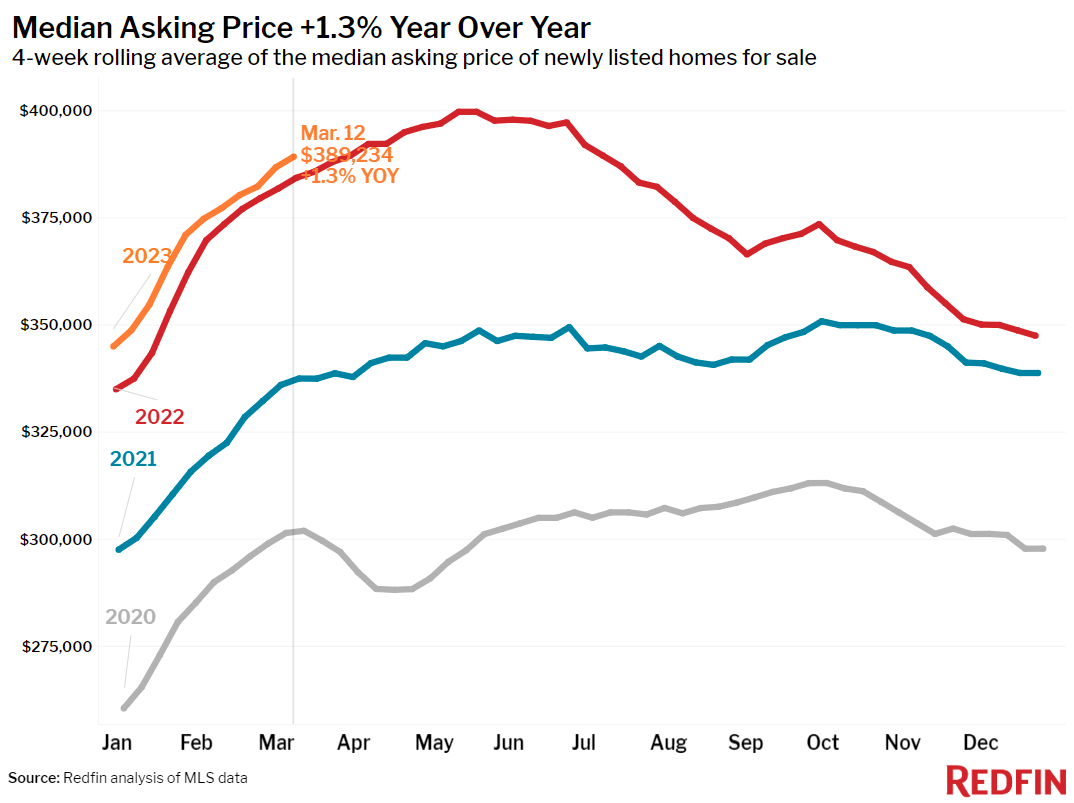
- The median asking price of newly listed homes was $389,234, up 1.3% year over year.
- The monthly mortgage payment on the median-asking-price home was $2556 at a 6.6% mortgage rate, the current weekly average. Monthly mortgage payments are up 24% ($499) from a year ago.
- Pending home sales were down 17.1% year over year.
- Pending home sales fell in all 50 of the most populous U.S. metros. They fell most in Las Vegas (-53.5% YoY), Portland, OR (-48%), Sacramento (-47.8%), Riverside, CA (-45.9%), and Seattle (-44.1%).
- New listings of homes for sale fell 22.1% year over year, the biggest decline in nearly three months.
- New listings declined in all but one of the 50 of the most populous U.S. metros, with the biggest declines in Milwaukee (-65% YoY), Sacramento (-48.1%), Oakland (-45.9%), San Francisco (-42.6%) and San Jose (-41.8%). They increased 2.6% in Nashville.
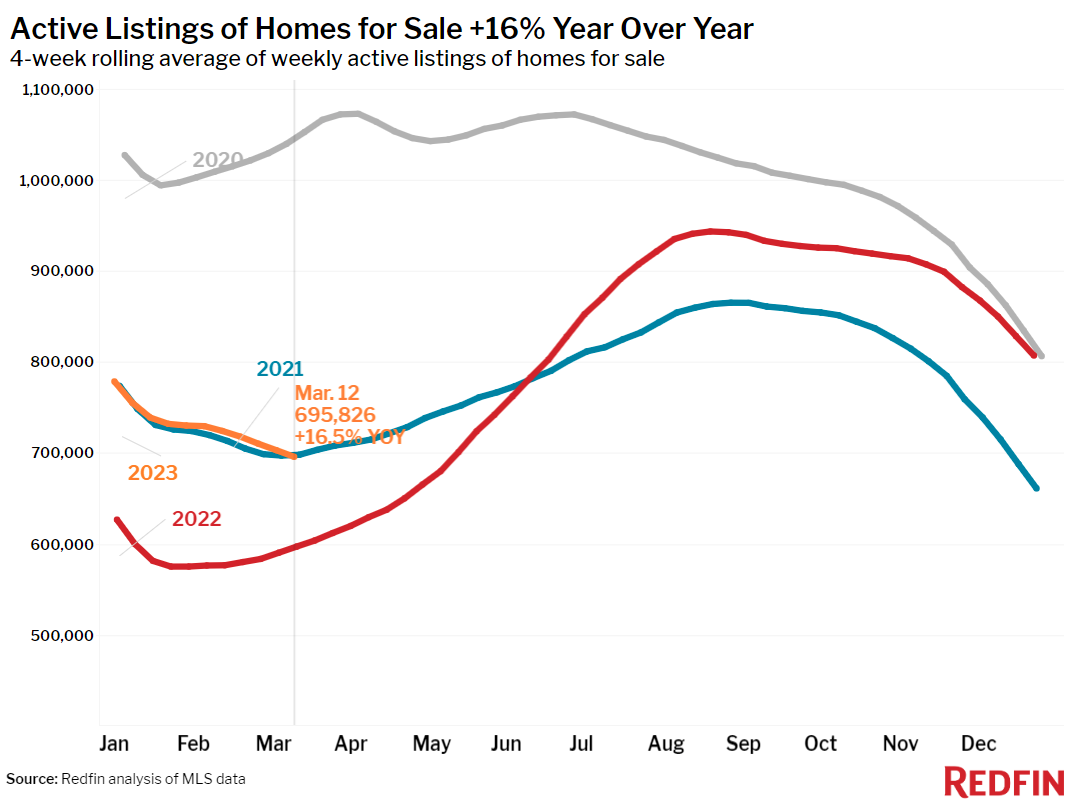
- Active listings (the number of homes listed for sale at any point during the period) were up 16.5% from a year earlier, the smallest increase in more than three months.
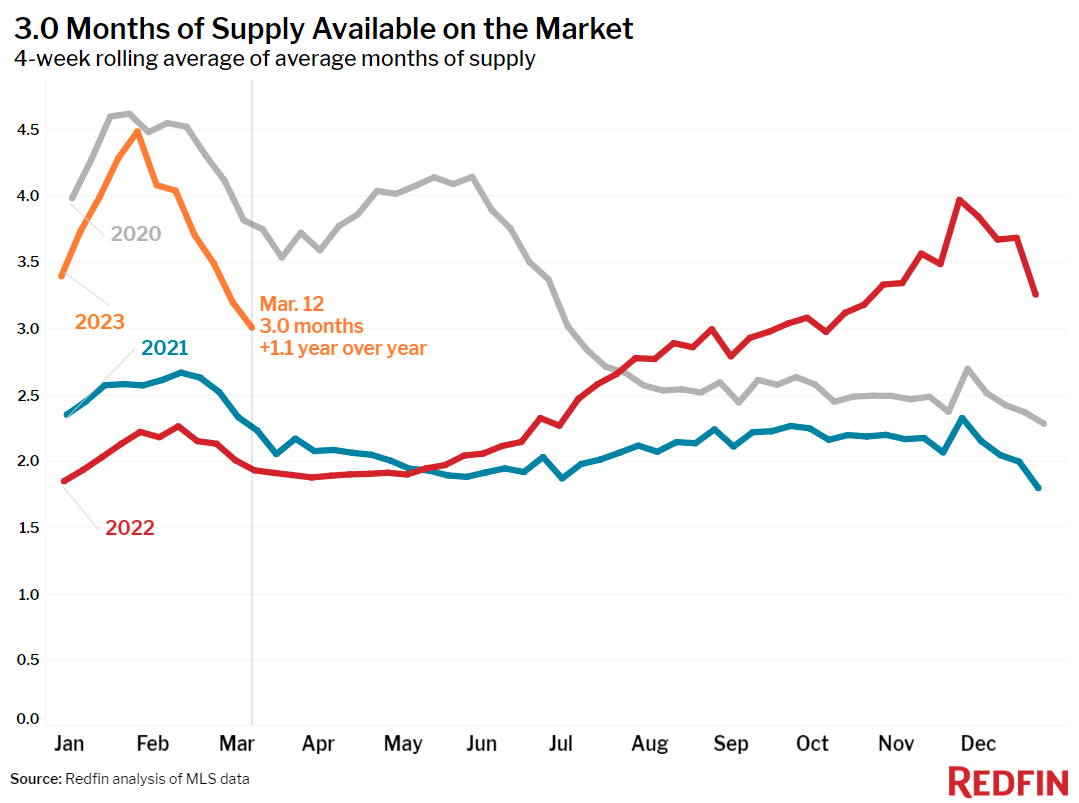
- Months of supply—a measure of the balance between supply and demand, calculated by the number of months it would take for the current inventory to sell at the current sales pace—was 3 months, down from 4 months a month earlier and up from 1.9 months a year earlier.
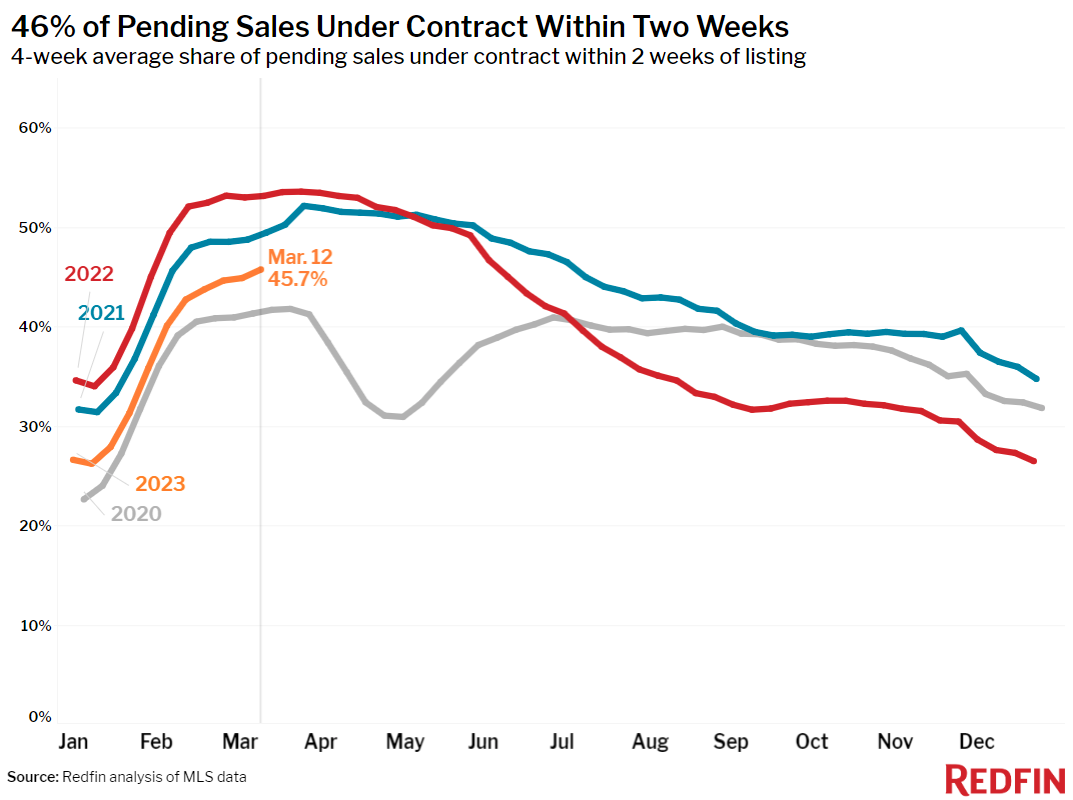
- 46% of homes that went under contract had an accepted offer within the first two weeks on the market, the highest level since June, but down from 53% a year earlier.
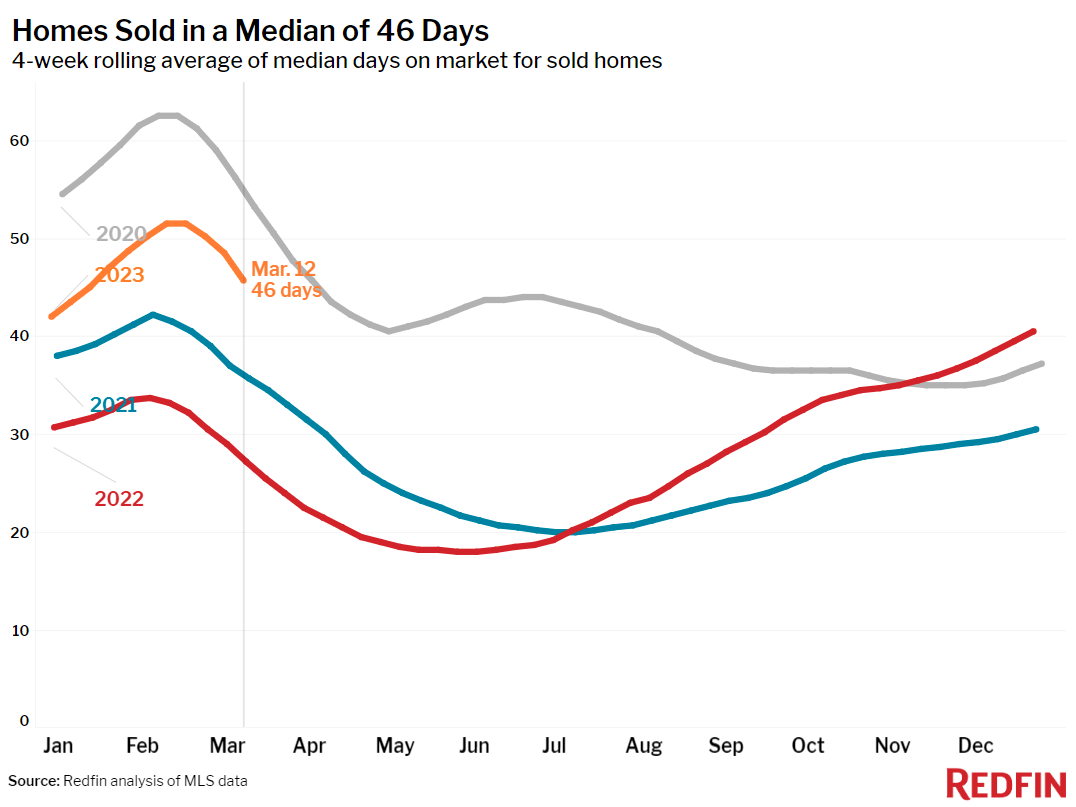
- Homes that sold were on the market for a median of 46 days. That’s up from 27 days a year earlier and the record low of 18 days set in May.
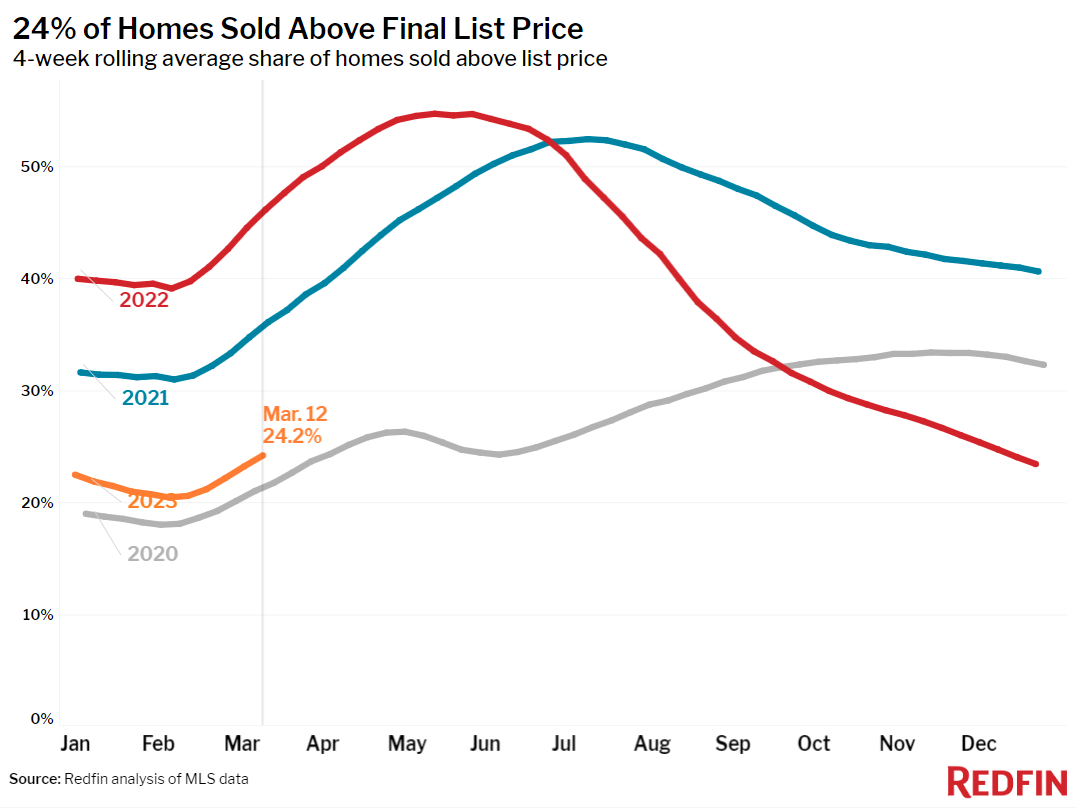
- 24% of homes sold above their final list price, down from 45% a year earlier.
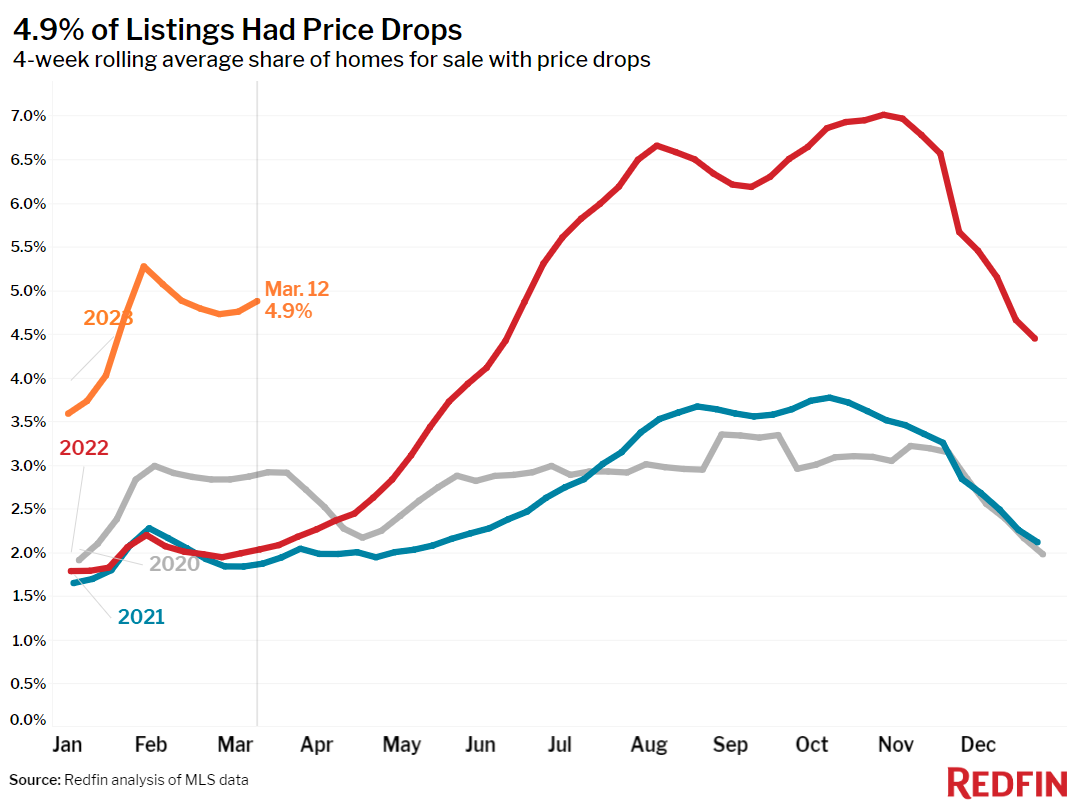
- On average, 4.9% of homes for sale each week had a price drop, up from 2% a year earlier.
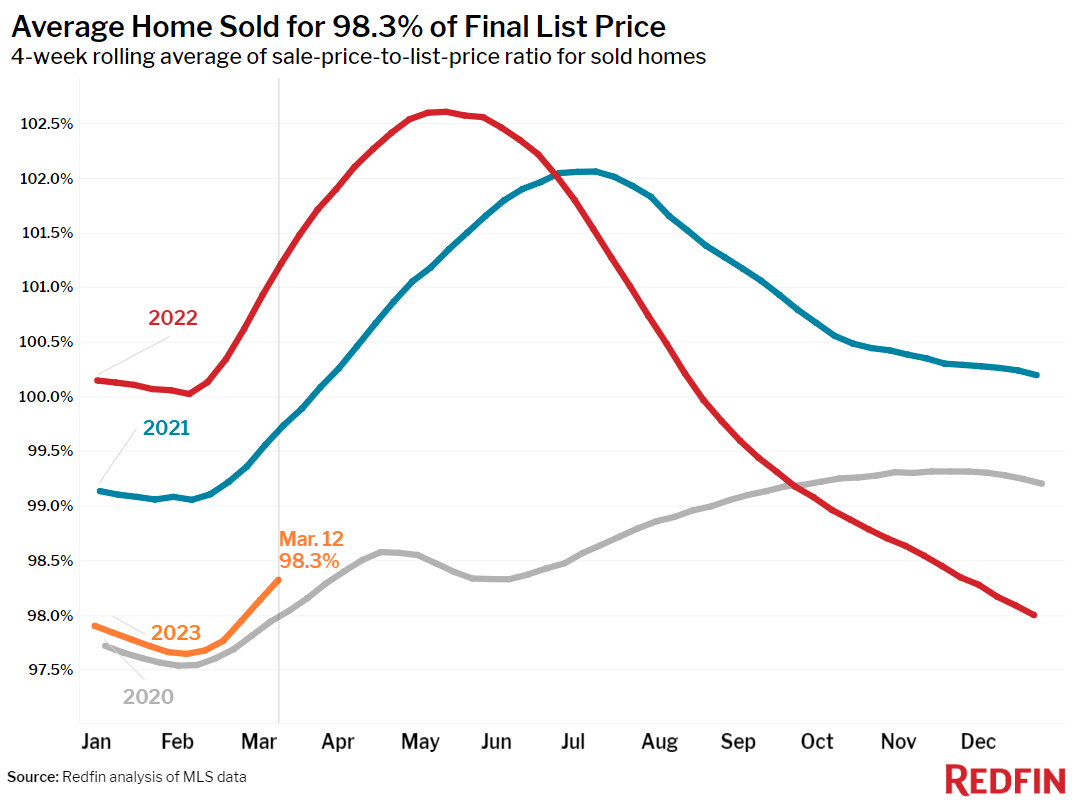
- The average sale-to-list price ratio, which measures how close homes are selling to their final asking prices, was 98.3%, the highest level in more than three months but down from 101.2% a year earlier.
Refer to our metrics definition page for explanations of all the metrics used in this report.

 United States
 Canada