January is shaping up to be the most competitive month in housing history.
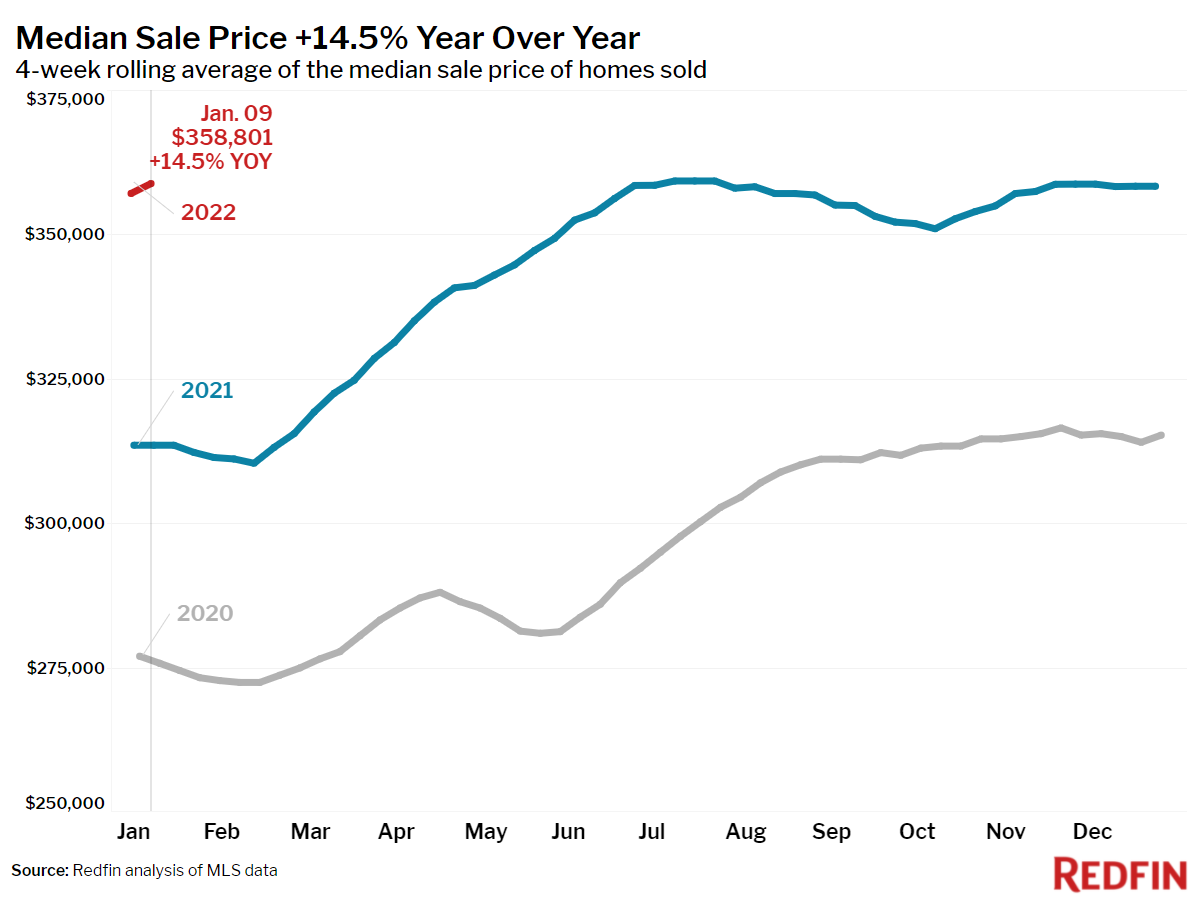
The median home sale price surged 16% year over year during the week ending January 9 to an all-time high of $365,000. Prices keep climbing because the supply drought keeps deepening while demand increases. The number of homes for sale fell to a new low as listings hit the market at a slower rate than they did early last year. Yet homebuyer activity–as measured by the Redfin Homebuyer Demand Index–jumped 9%. Mortgage rates rose to 3.45% during the seven days ending January 13, making homebuying more expensive as overall inflation hit a 40-year high.
“The stage is now set for the most competitive January housing market in recorded history,” said Redfin Chief Economist Daryl Fairweather. “Buyers are pouring into the market to claim a home before mortgage rates rise further as new listings slow to a trickle. The conditions are becoming increasingly challenging for first-time homebuyers, who will have to compete against more experienced buyers who are willing to do whatever it takes to win. But I expect that by the time mortgage rates increase to 3.6%, competition will settle down quickly to levels similar to late-2018.”
“Homebuyers are touring nearly every home that comes on the market, waiving every contingency, offering $100,000 over asking price, and still losing out to 9+ other offers,” said Portland Redfin real estate agent Jennifer Ciacci. “As competitive as the market is right now, I advise buyers not to write an offer on a home they don’t really like. The home needs to work for what they want and need, and if it checks off those boxes, that’s when you go all-in and take your best shot. But protect your heart; this isn’t an easy market.”
Key housing market takeaways for 400+ U.S. metro areas:
Unless otherwise noted, the data in this report covers the four-week period ending January 9. Redfin’s housing market data goes back through 2012.
Data based on homes listed and/or sold during the period:
- The median home-sale price increased 14% year over year to $358,801. For the seven-day period ending January 9, the median price hit $365,000, up 16% from a year earlier and an all-time high.
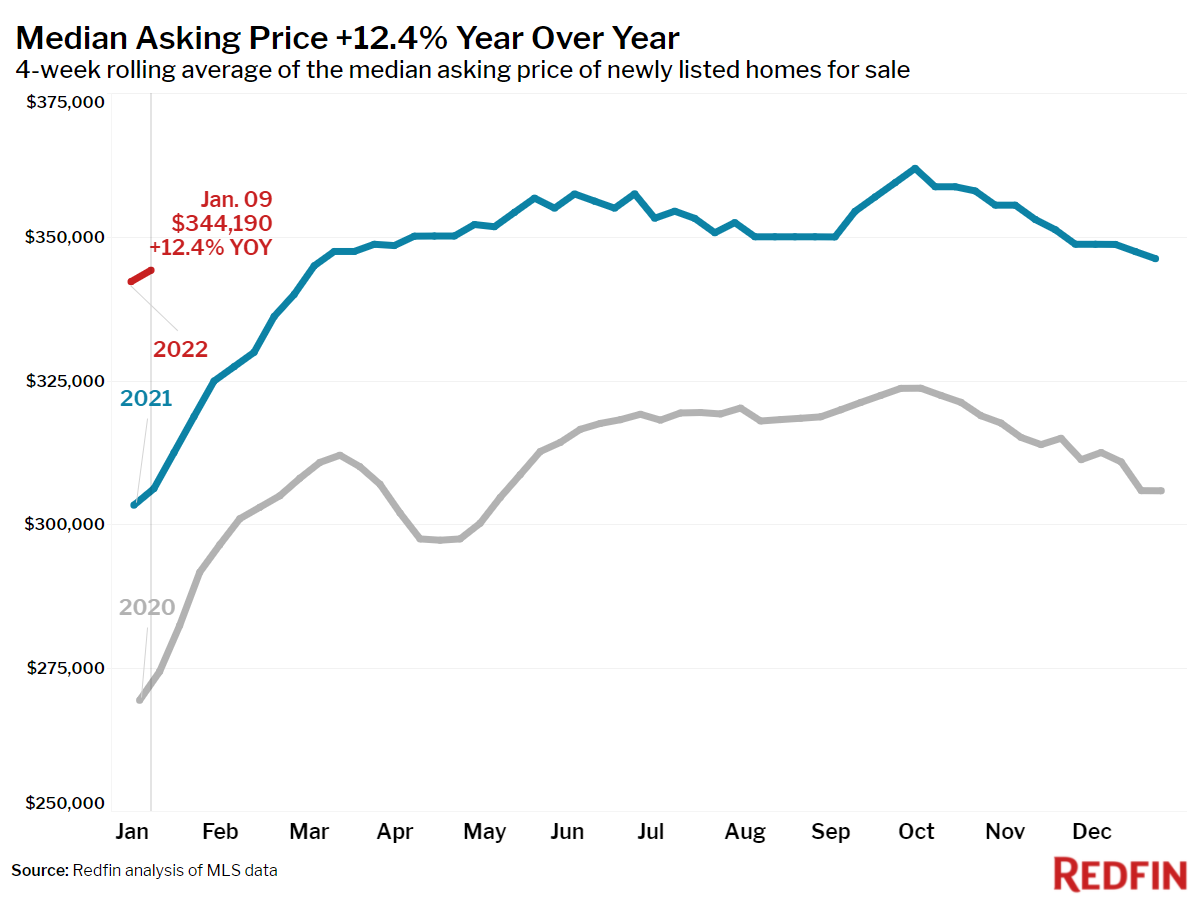
- The median asking price of newly listed homes increased 12% year over year to $344,190.
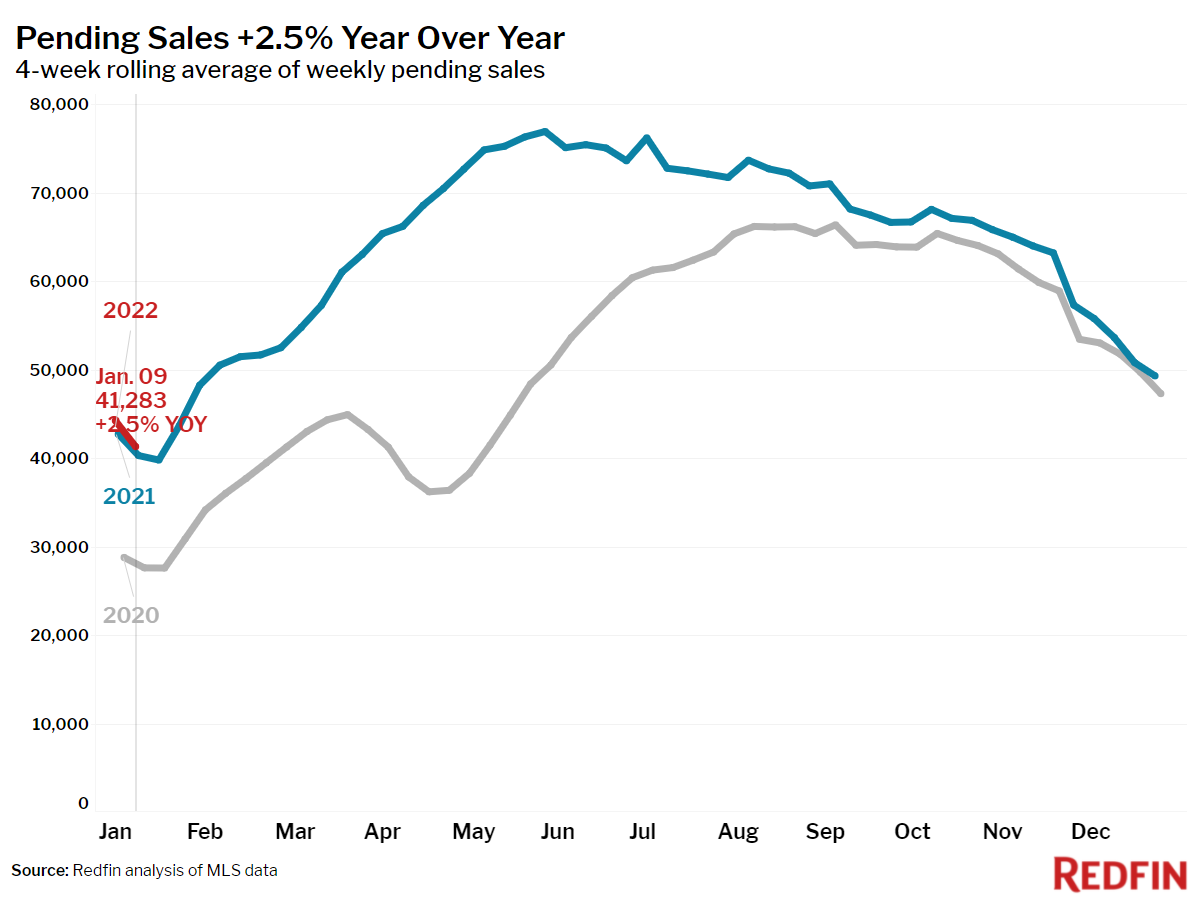
- Pending home sales were up 2.5% year over year.
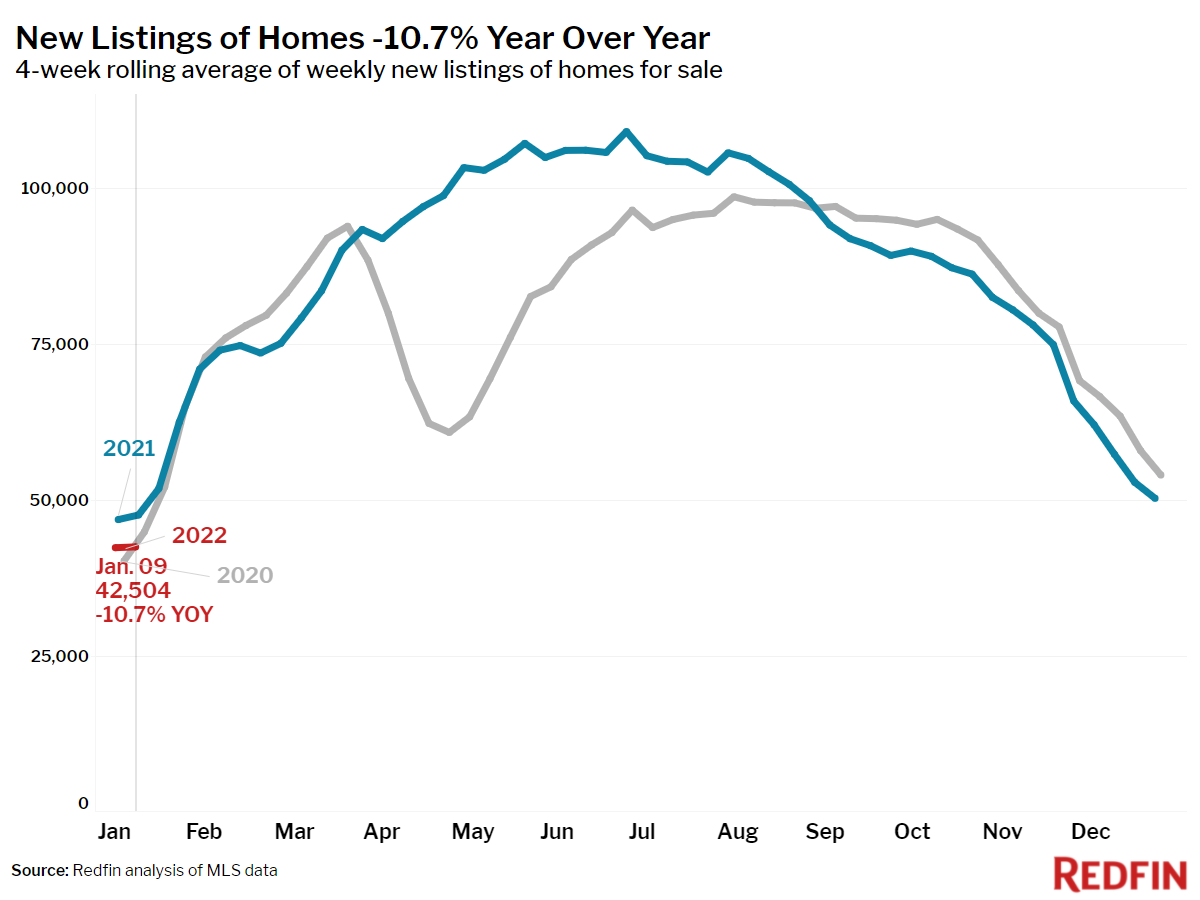
- New listings of homes for sale were down 11% from a year earlier.
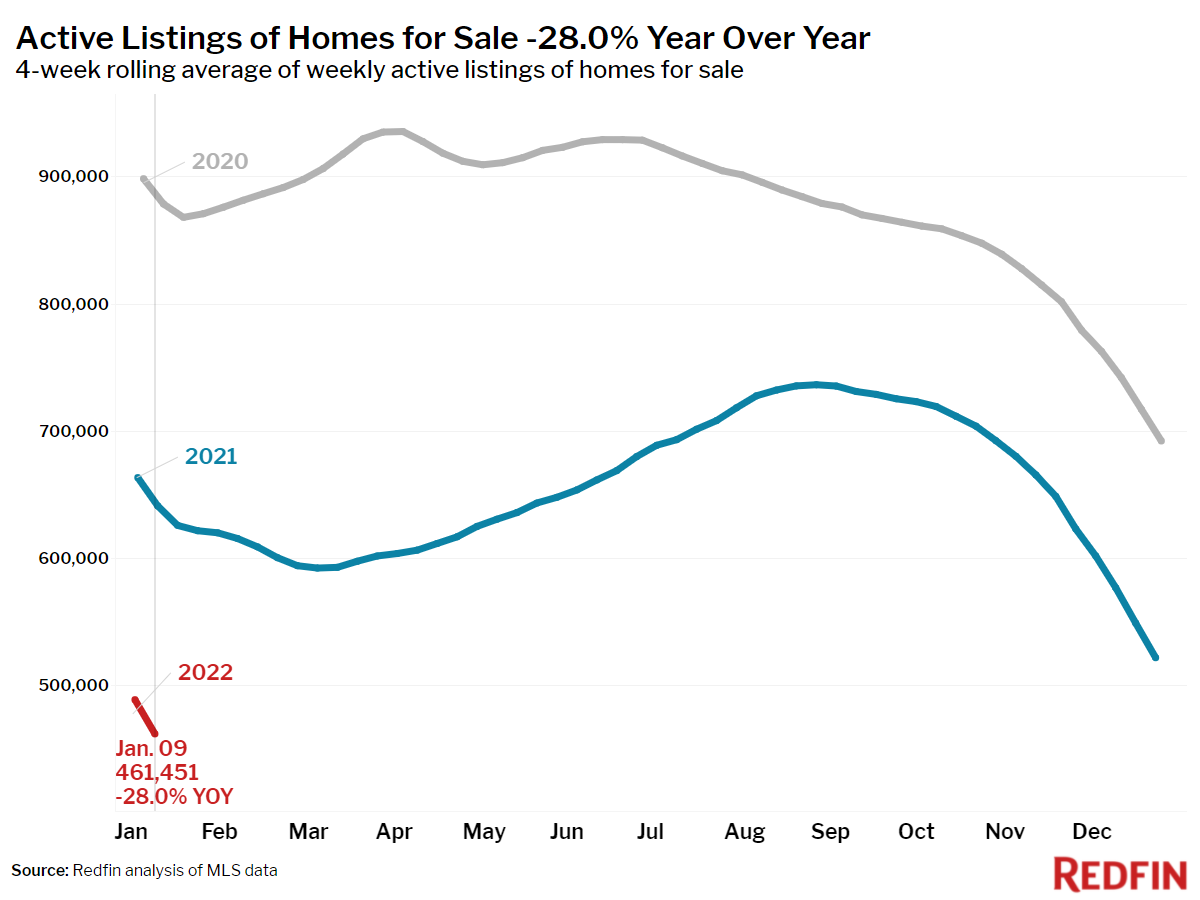
- Active listings (the number of homes listed for sale at any point during the period) fell 28% year over year, dropping to an all-time low of 461,000.
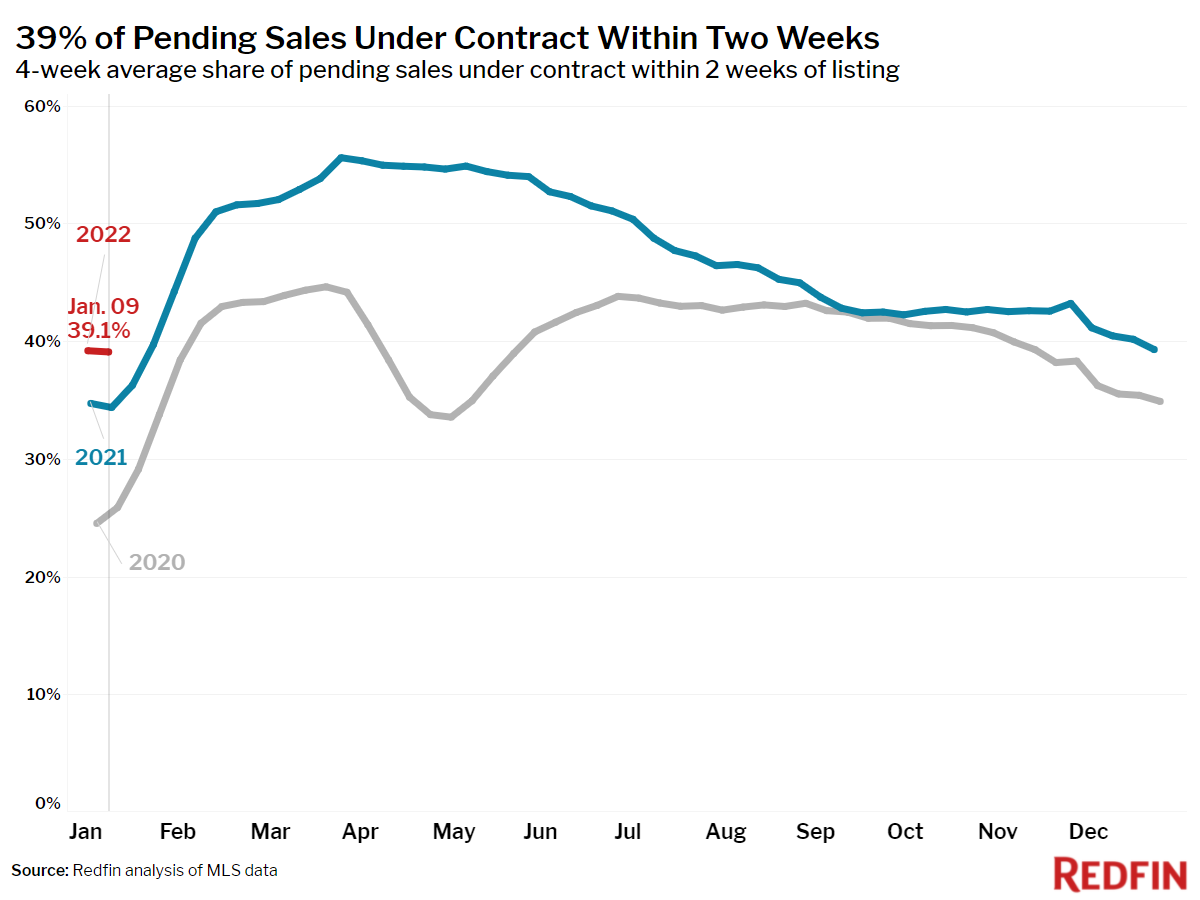
- The share of homes that went under contract that had an accepted offer within the first two weeks on the market was 39%, above the 34% rate of a year earlier.
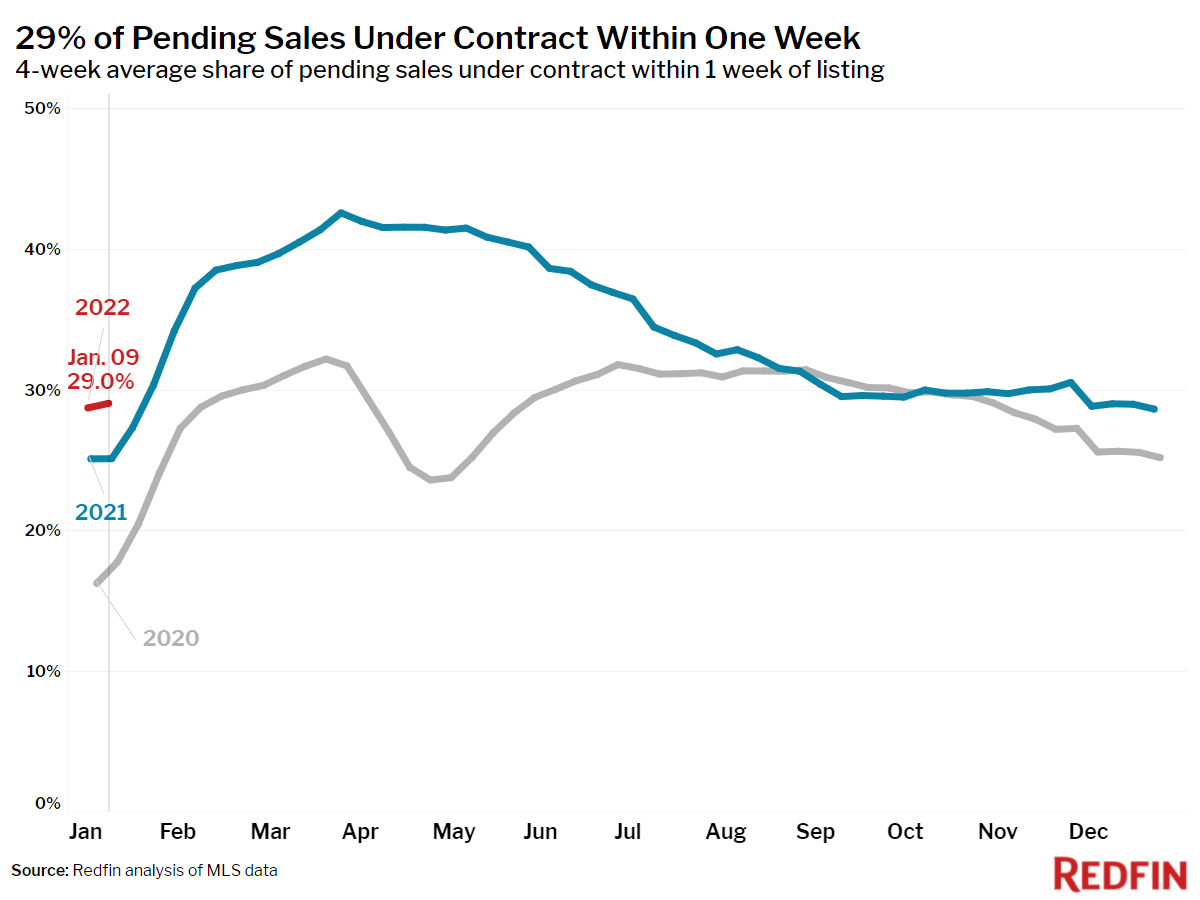
- 29% of homes that went under contract had an accepted offer within one week of hitting the market, up from 25% during the same period a year earlier.
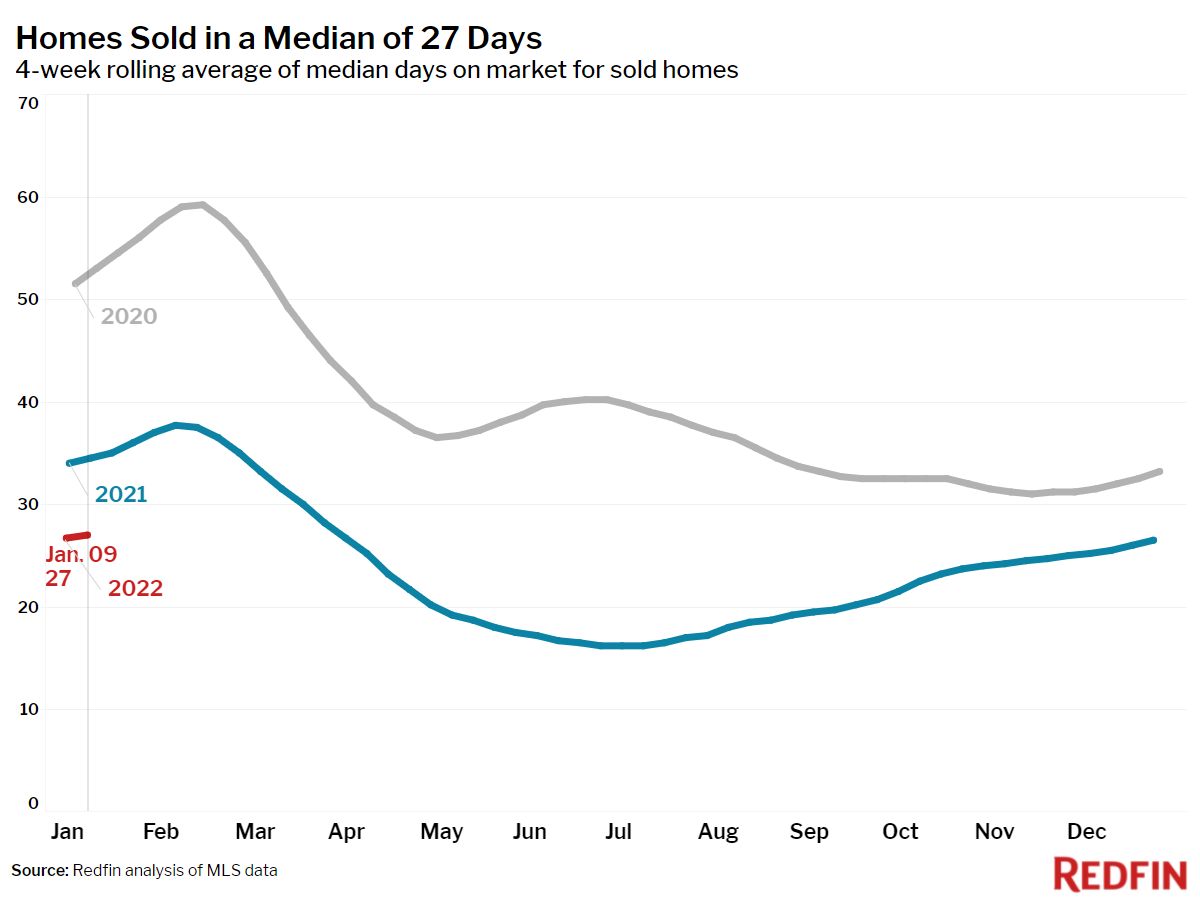
- Homes that sold were on the market for a median of 27 days, down from 35 days a year earlier.
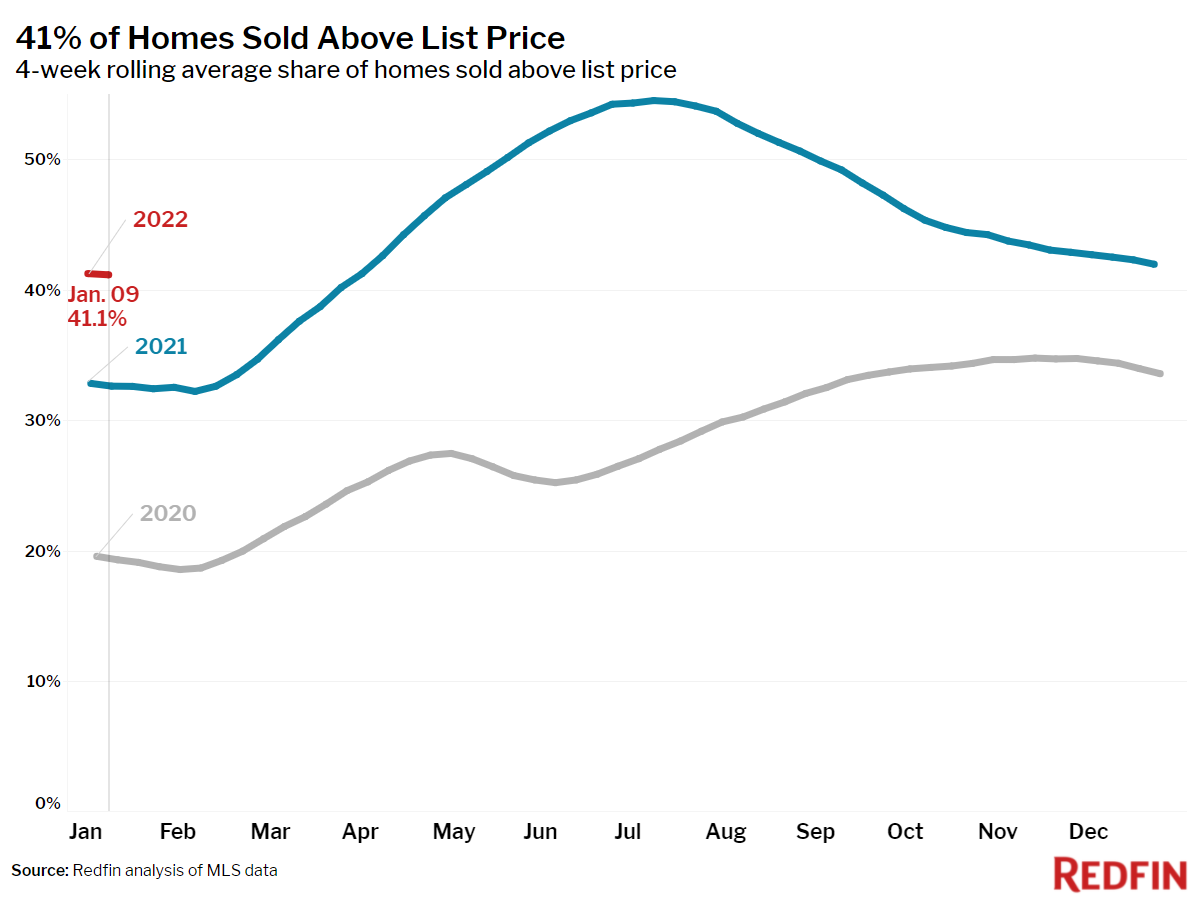
- 41% of homes sold above list price, up from 33% a year earlier.
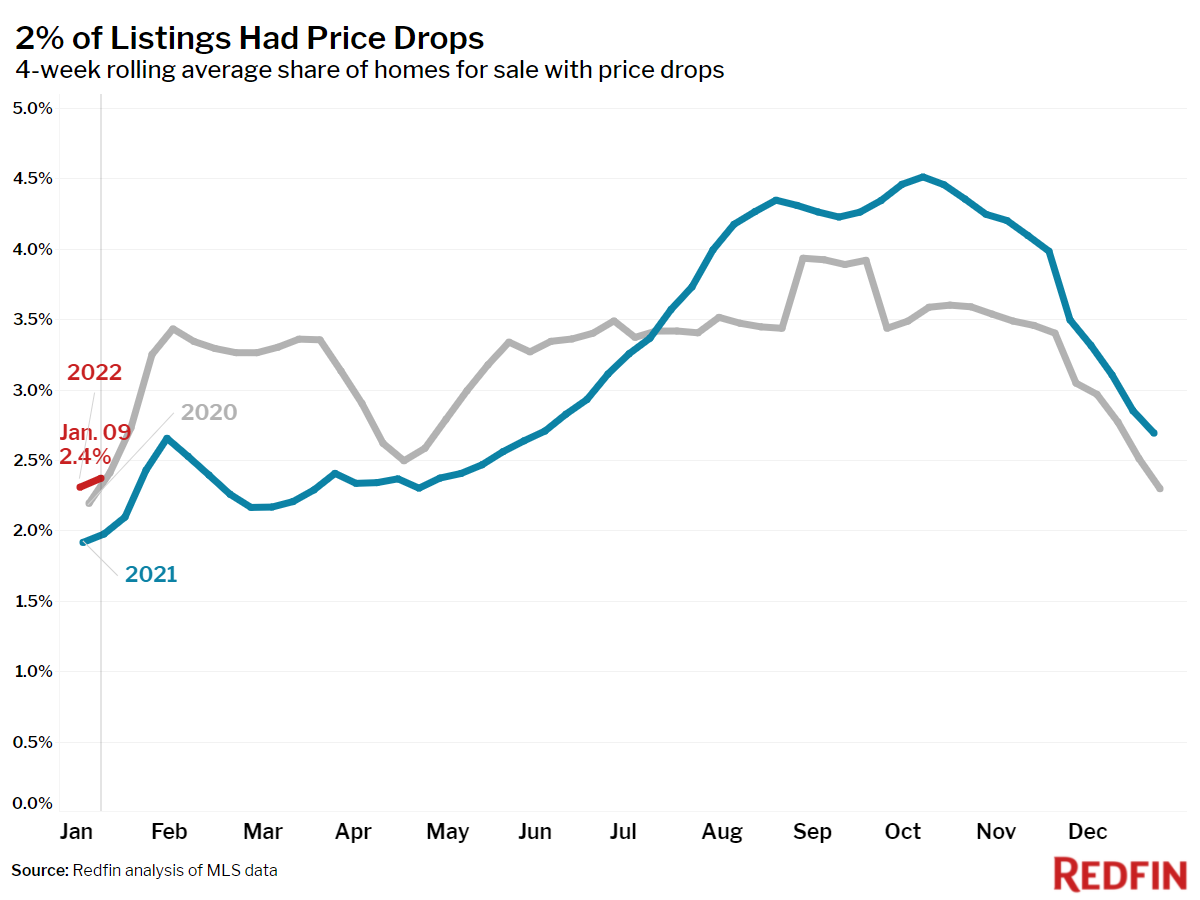
- On average, 2.4% of homes for sale each week had a price drop, up 0.4 percentage points from the same time in 2021.
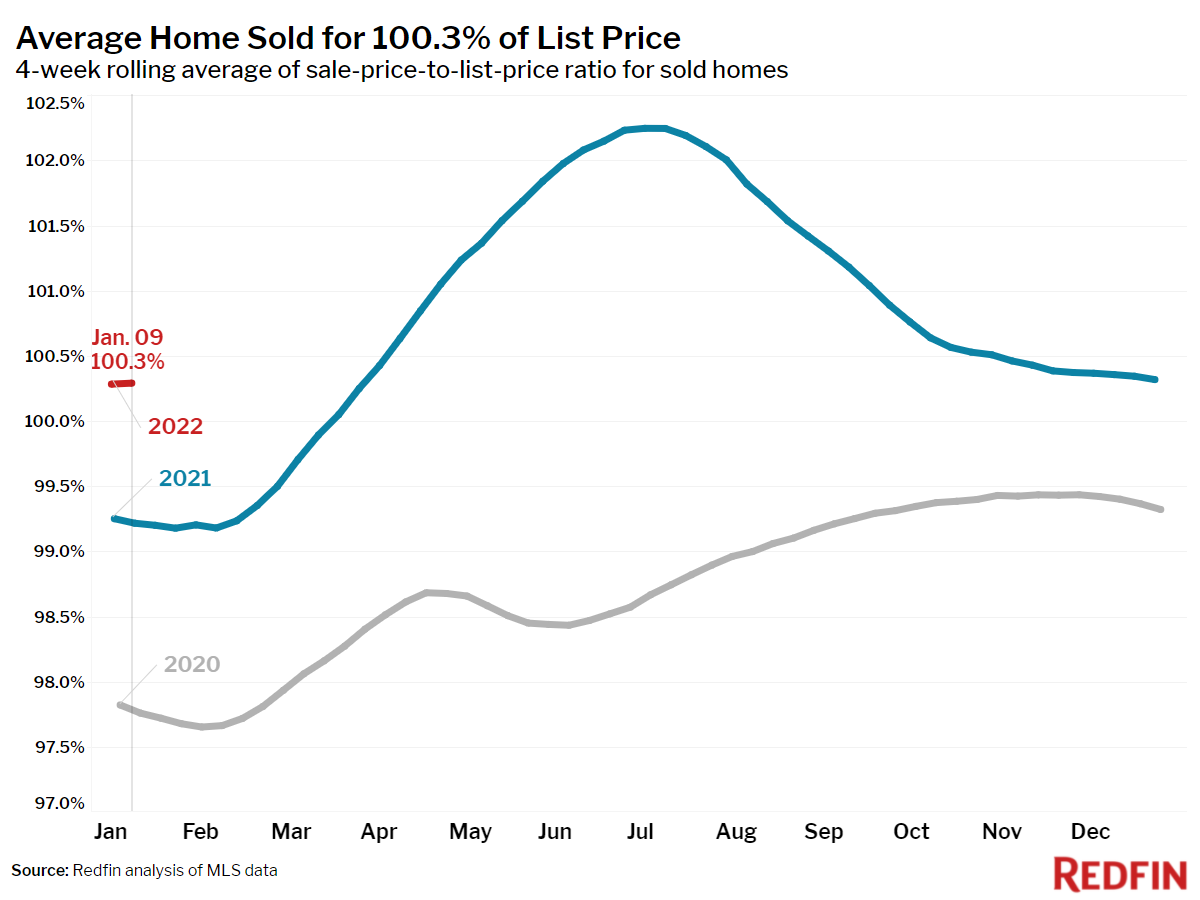
- The average sale-to-list price ratio, which measures how close homes are selling to their asking prices, was 100.3%. In other words, the average home sold for 0.3% above its asking price.
Other leading indicators of homebuying activity:
- Mortgage purchase applications increased 2% week over week (seasonally adjusted) during the week ending December 31. For the week ending January 13, 30-year mortgage rates rose to 3.45%, the highest level since March 2020.
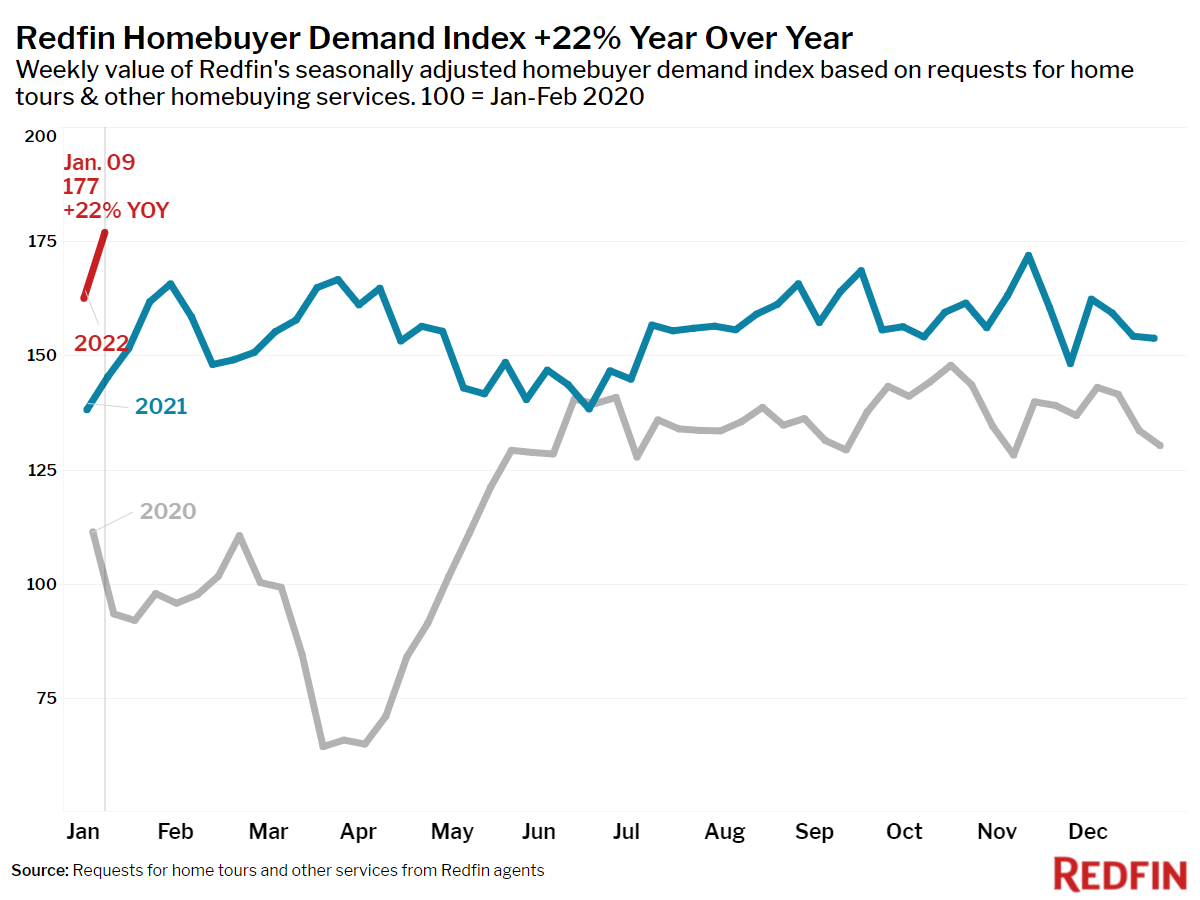
- The Redfin Homebuyer Demand Index rose 9% during the week ending January 9 and was up 22% from a year earlier. The seasonally adjusted Redfin Homebuyer Demand Index is a measure of requests for home tours and other home-buying services from Redfin agents.
Refer to our metrics definition page for explanations of all the metrics used in this report.
 United States
 Canada