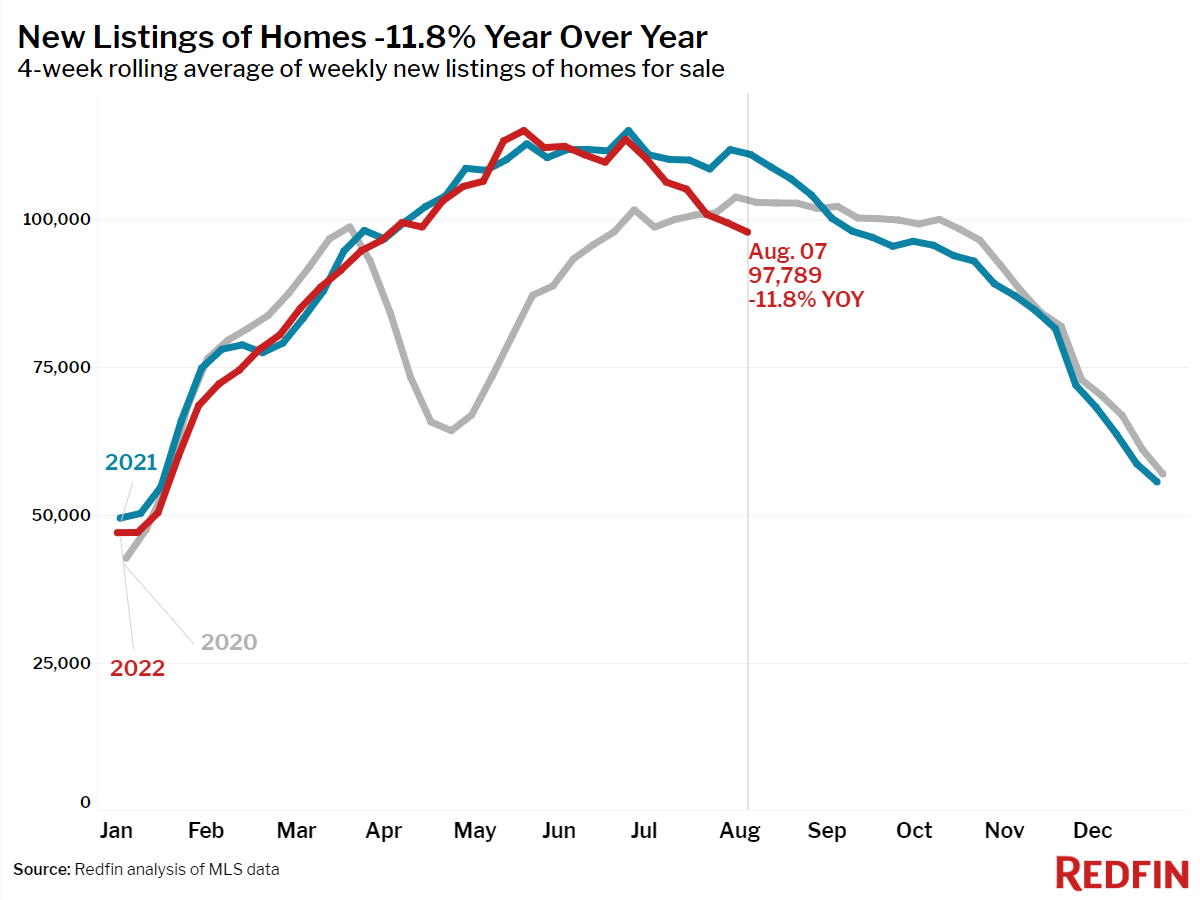
New listings are down 12% from a year ago as sellers respond to waning homebuyer demand. Still, overall housing supply is on the rise—a sign that buyers are pulling back more than sellers.
More homeowners are holding off on selling as the housing market cools, fueling the largest decline in home listings in more than two years. New listings of homes for sale dropped 12% year over year during the four weeks ending August 7, the steepest decline since June 2020. Homeowners are staying put in part because homebuyer demand has slowed due to higher mortgage rates; pending home sales are down 16% from a year ago. Some homeowners are also experiencing an effect called “rate lock in” in which they’re hesitant to buy a new home since it would mean paying a significantly higher mortgage rate.
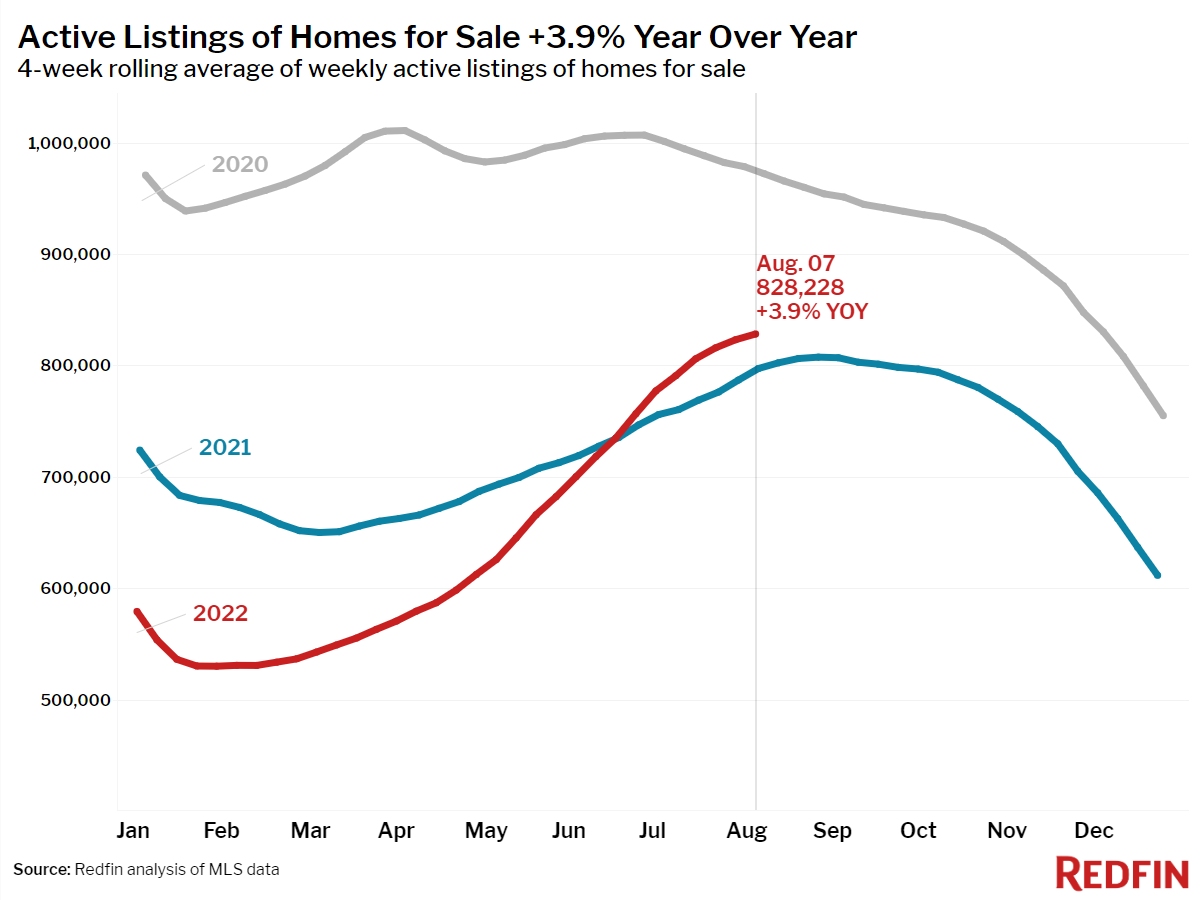
Despite the decrease in new listings, overall housing supply continues to grow—a sign that homebuyers are pulling back more than home sellers. The total number of homes for sale is up 4% year over year. That’s good news for the buyers who can afford to remain in the market because it means the housing shortage is easing and there are more homes to choose from.
“Buyers are backing off due to rising housing costs and sellers are holding back because they realize they won’t get the bidding war they would have gotten six months ago,” said Redfin Deputy Chief Economist Taylor Marr. “The good news is this is bringing balance to the market. If mortgage rates resume their downward trajectory, more buyers and sellers could get back in the game.”
Leading indicators of homebuying activity:
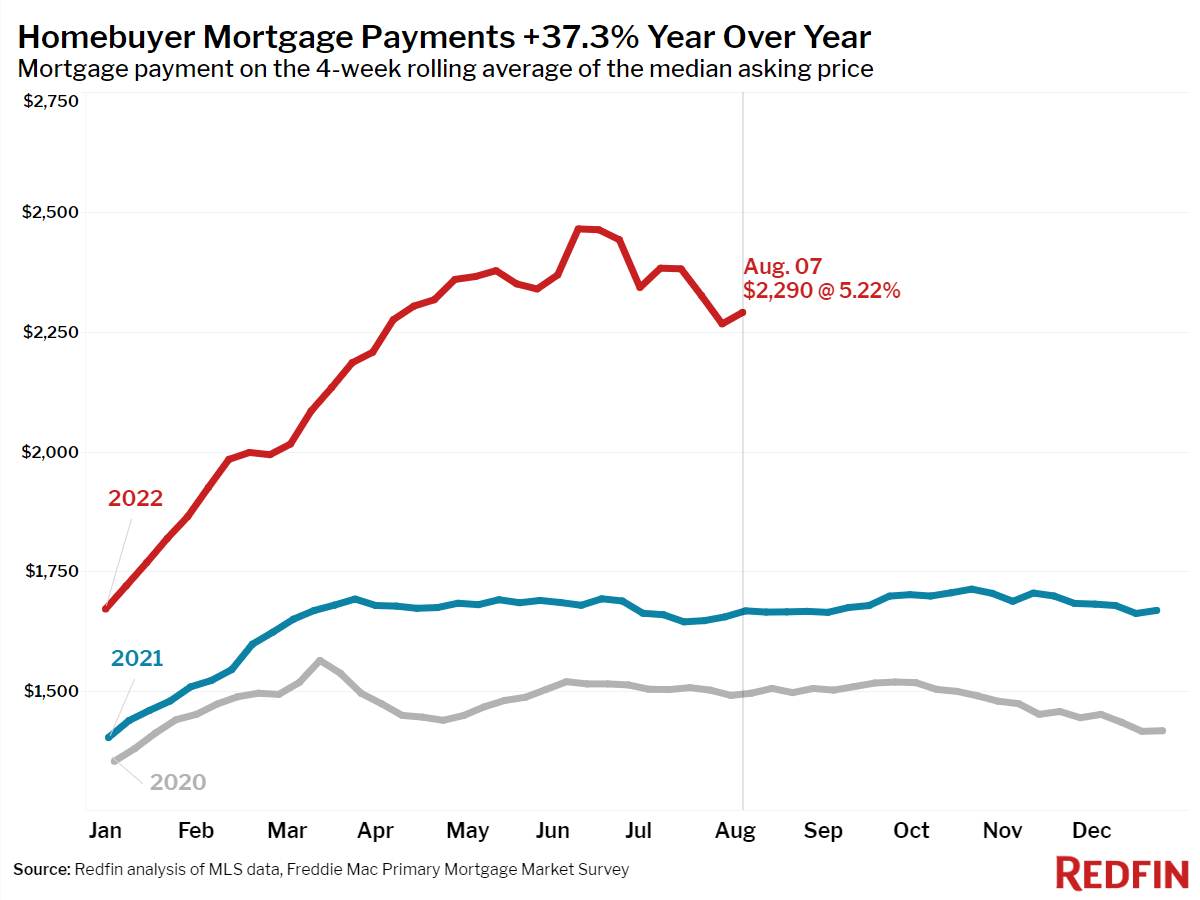
- For the week ending August 11, 30-year mortgage rates rose to 5.22%. This was down from a 2022 high of 5.81% but up from 3.11% at the start of the year.
- The latest Home Purchase Sentiment Index from Fannie Mae indicates that the share of people who believe now is a good time to sell is rapidly declining.
- Fewer people searched for “homes for sale” on Google—searches during the week ending August 6 were down 23% from a year earlier, but up 12% from late May.
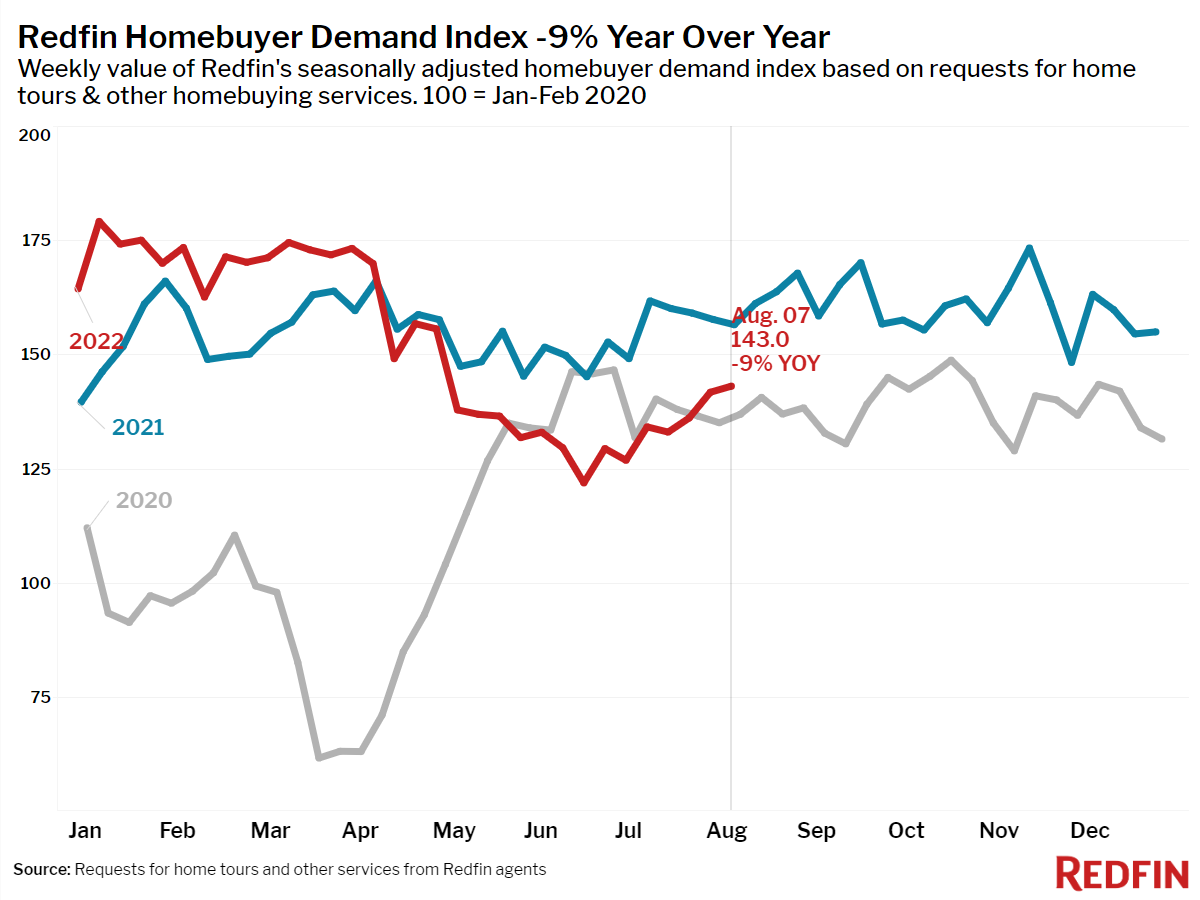
- The seasonally-adjusted Redfin Homebuyer Demand Index—a measure of requests for home tours and other home-buying services from Redfin agents—was down 9% year over year during the week ending August 7, but is up 17% from the week of June 19.
- Touring activity as of August 7 was down 7% from the start of the year, compared to a 15% increase at the same time last year, according to home tour technology company ShowingTime.
- Mortgage purchase applications were down 19% from a year earlier during the week ending August 5, while the seasonally-adjusted index was down 1% week over week.
Key housing market takeaways for 400+ U.S. metro areas:
Unless otherwise noted, the data in this report covers the four-week period ending August 7. Redfin’s housing market data goes back through 2012.
Data based on homes listed and/or sold during the period:
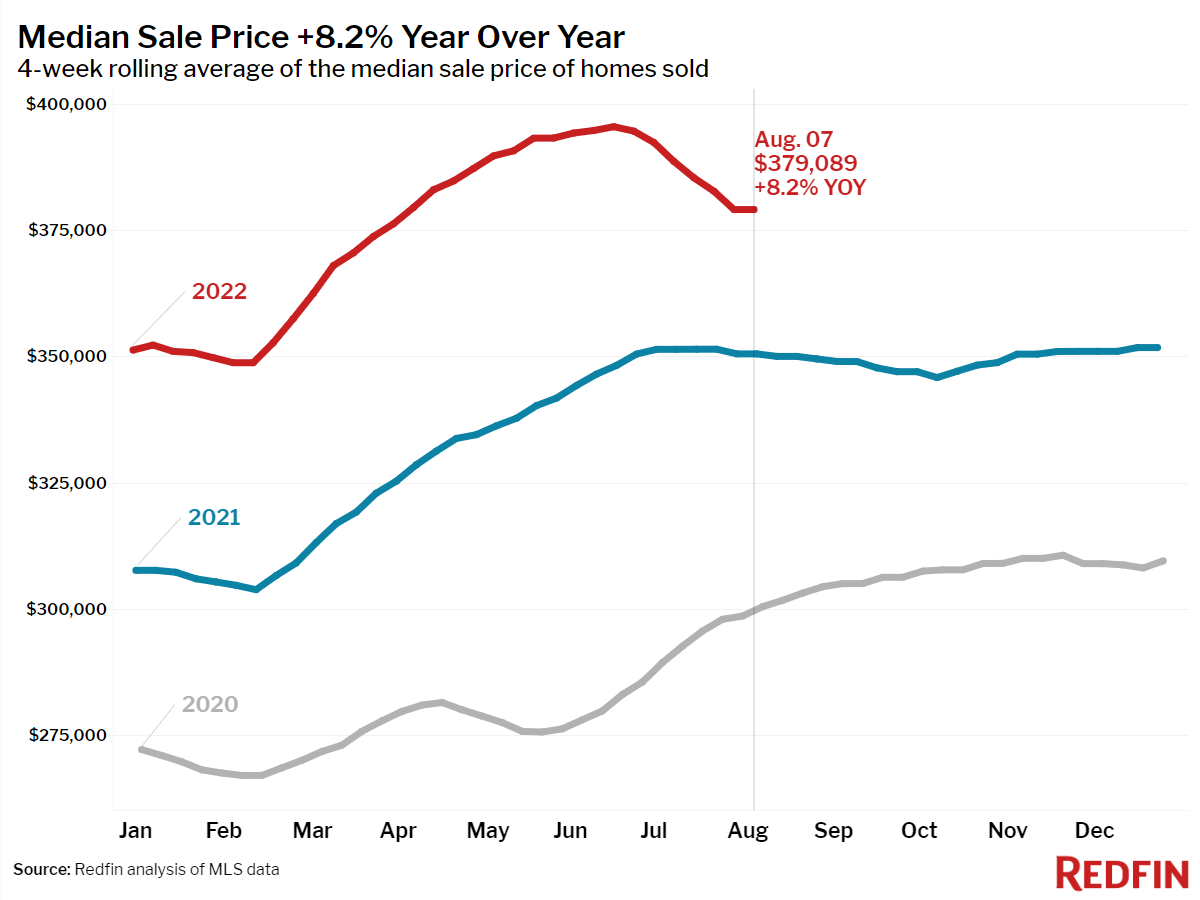
- The median home sale price was $379,089, up 8% year over year. Prices have declined 4.1% from the record high of $395,500 hit during the four-week period ending June 19. A year ago, they rose 0.7% during the same period.
- Only two metro areas saw a year-over-year decline in the median home sale price: Oakland, CA, where prices fell 1.5% to $940,994 and San Francisco, where prices were down 2.4% to $1,502,500.
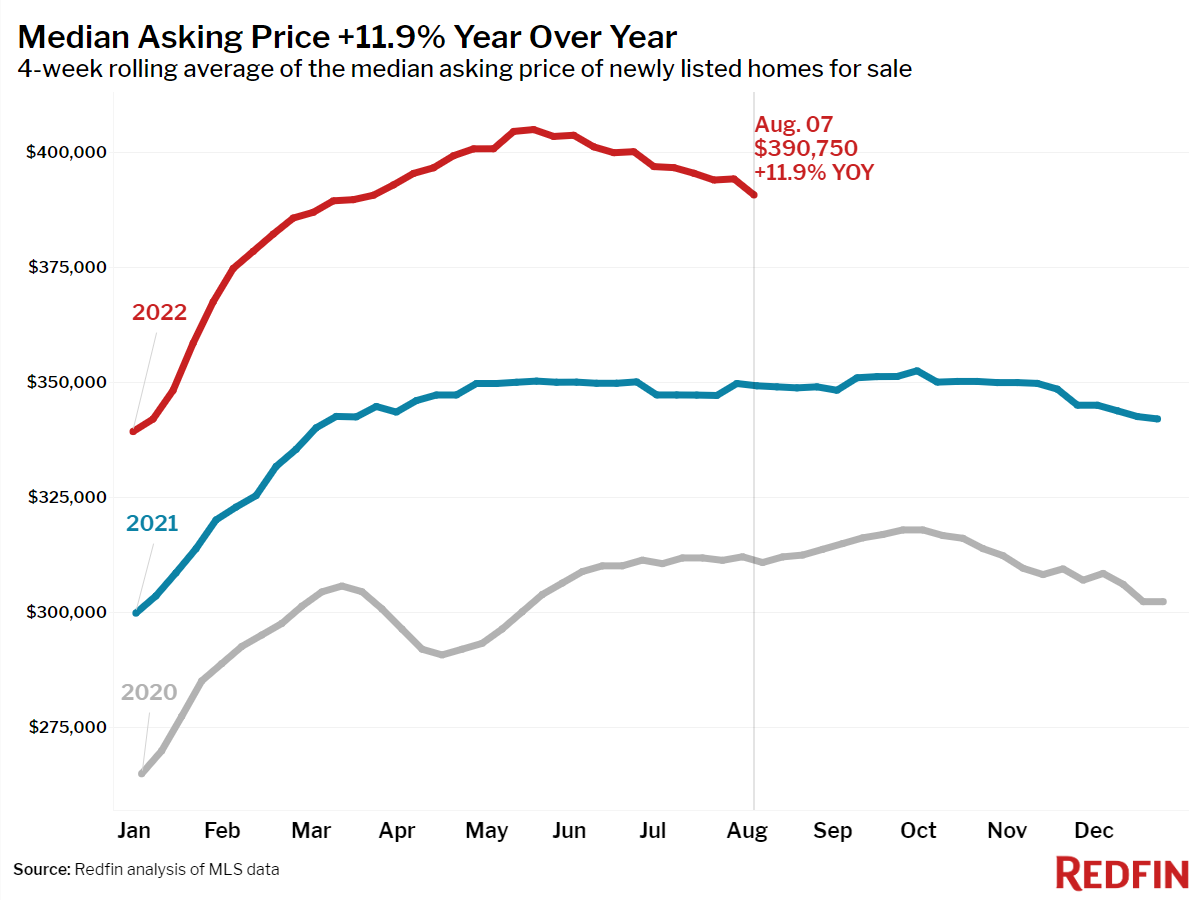
- The median asking price of newly listed homes increased 12% year over year to $390,750. Asking prices are down 3.5% from the all-time high set during the four-week period ending May 22. Last year during the same period they were down just 0.3%.
- The monthly mortgage payment on the median asking price home hit $2,290 at the current 5.22% mortgage rate, up 37% from $1,668 a year earlier, when mortgage rates were 2.87%. That’s down slightly from the peak of $2,464 reached during the four weeks ending June 12.
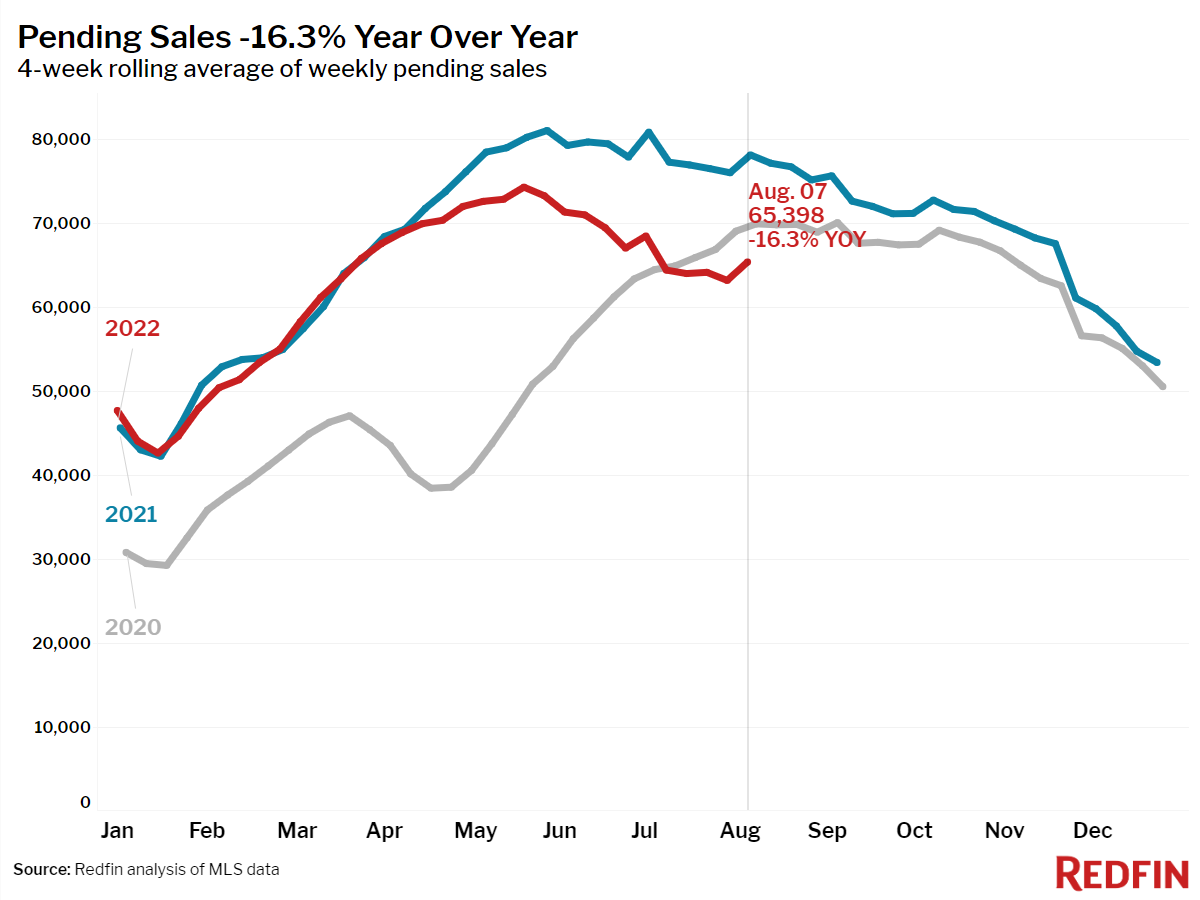
- Pending home sales were down 16% year over year, a slightly smaller decline than in recent weeks.
- New listings of homes for sale were down 12% from a year earlier, the largest decline since June 2020.
- Active listings (the number of homes listed for sale at any point during the period) rose 4% year over year.
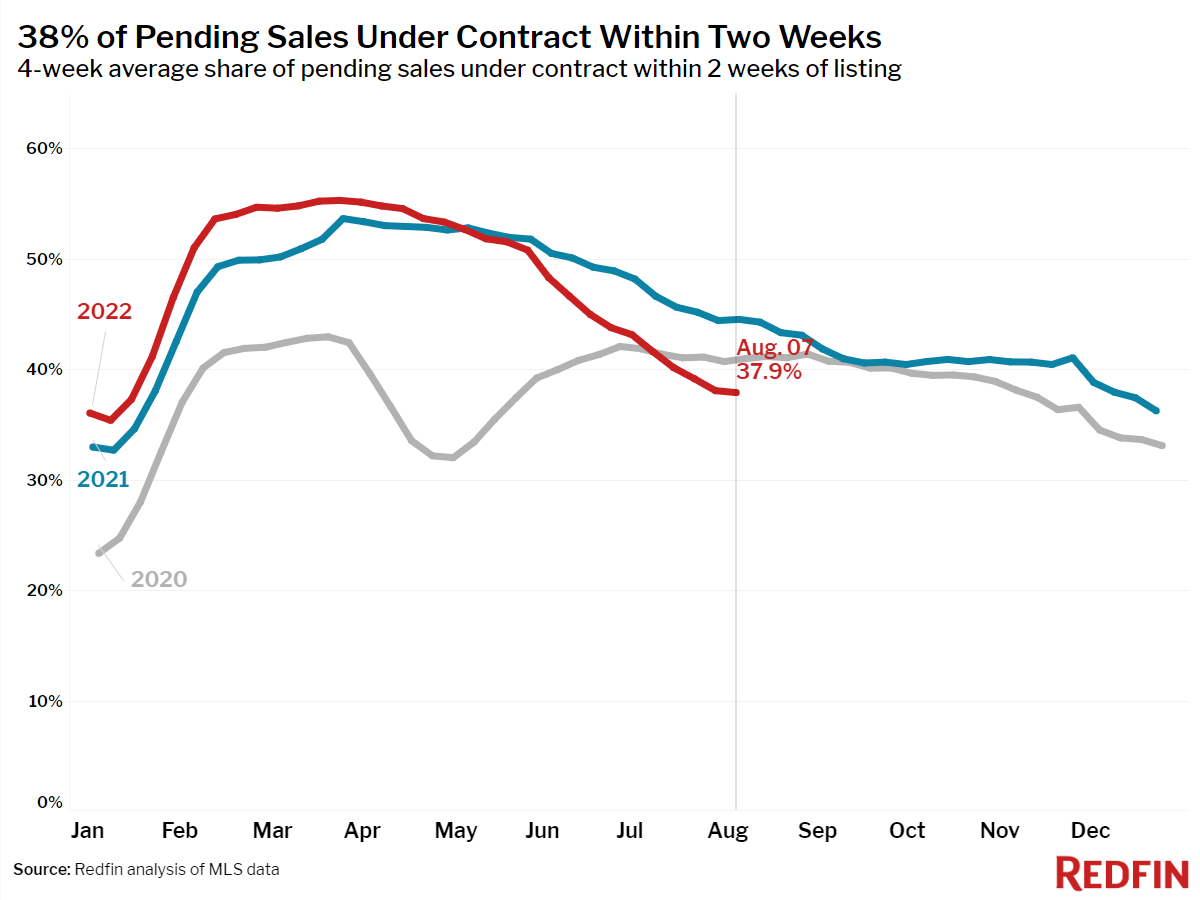
- 38% of homes that went under contract had an accepted offer within the first two weeks on the market, down from 45% a year earlier.
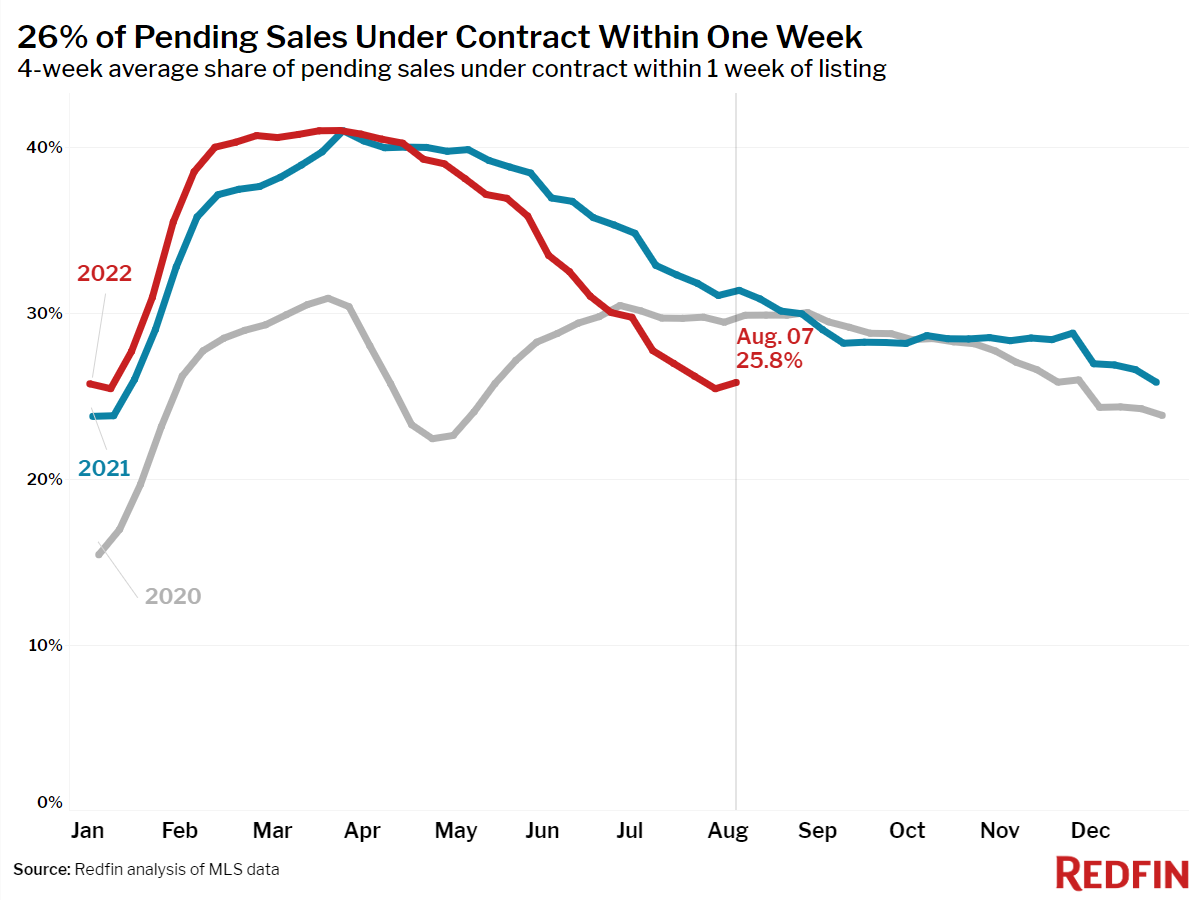
- 26% of homes that went under contract had an accepted offer within one week of hitting the market, down from 31% a year earlier.
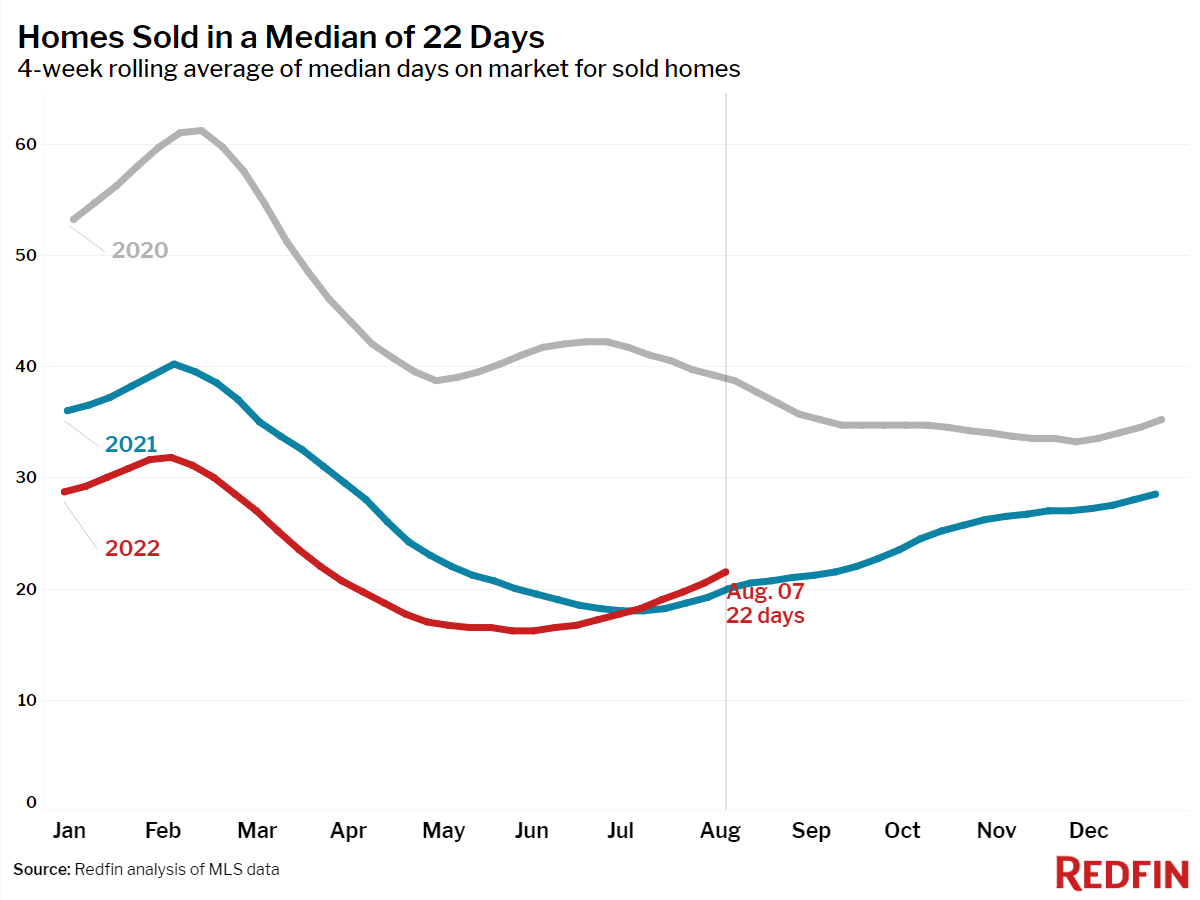
- Homes that sold were on the market for a median of 22 days, up from 20 days a year earlier and the record low of 16 days set in May and early June.
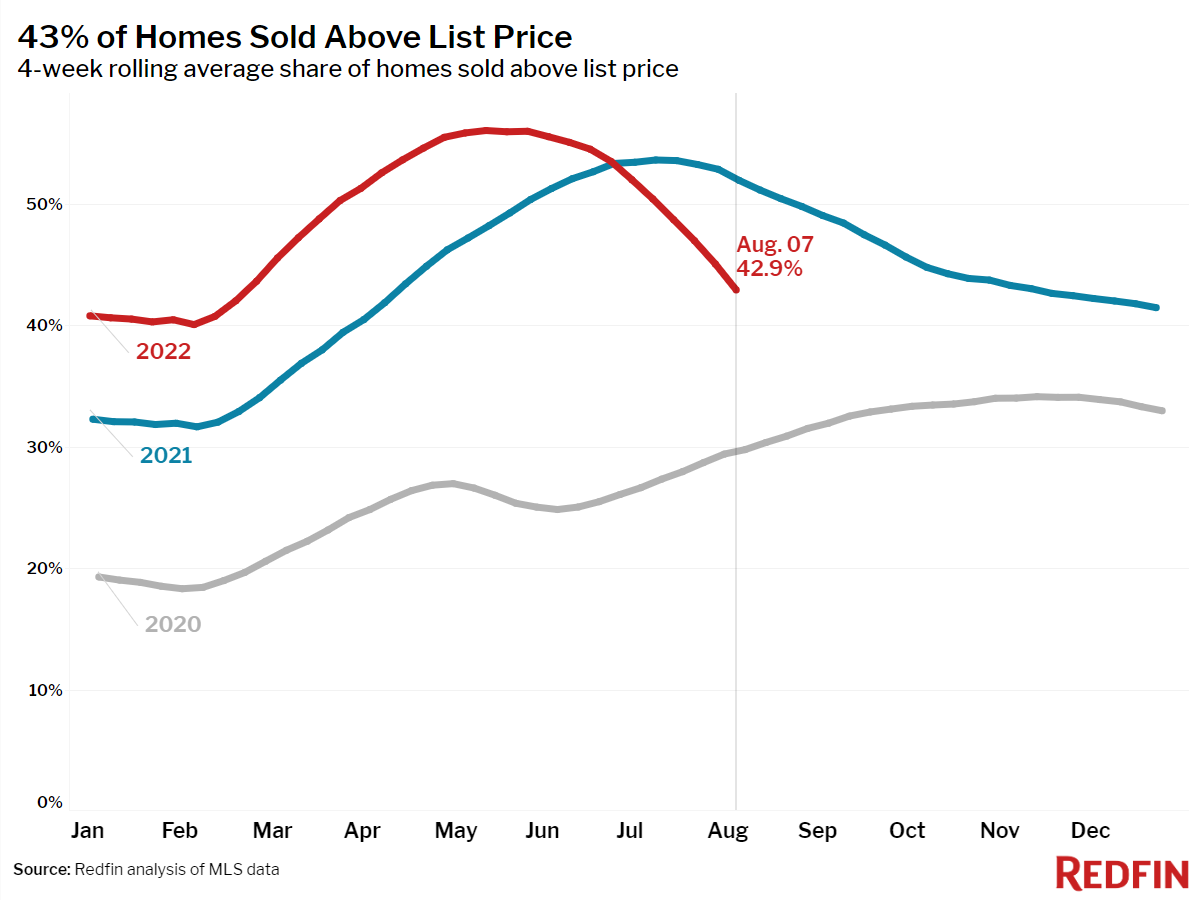
- 43% of homes sold above list price, down from 52% a year earlier.
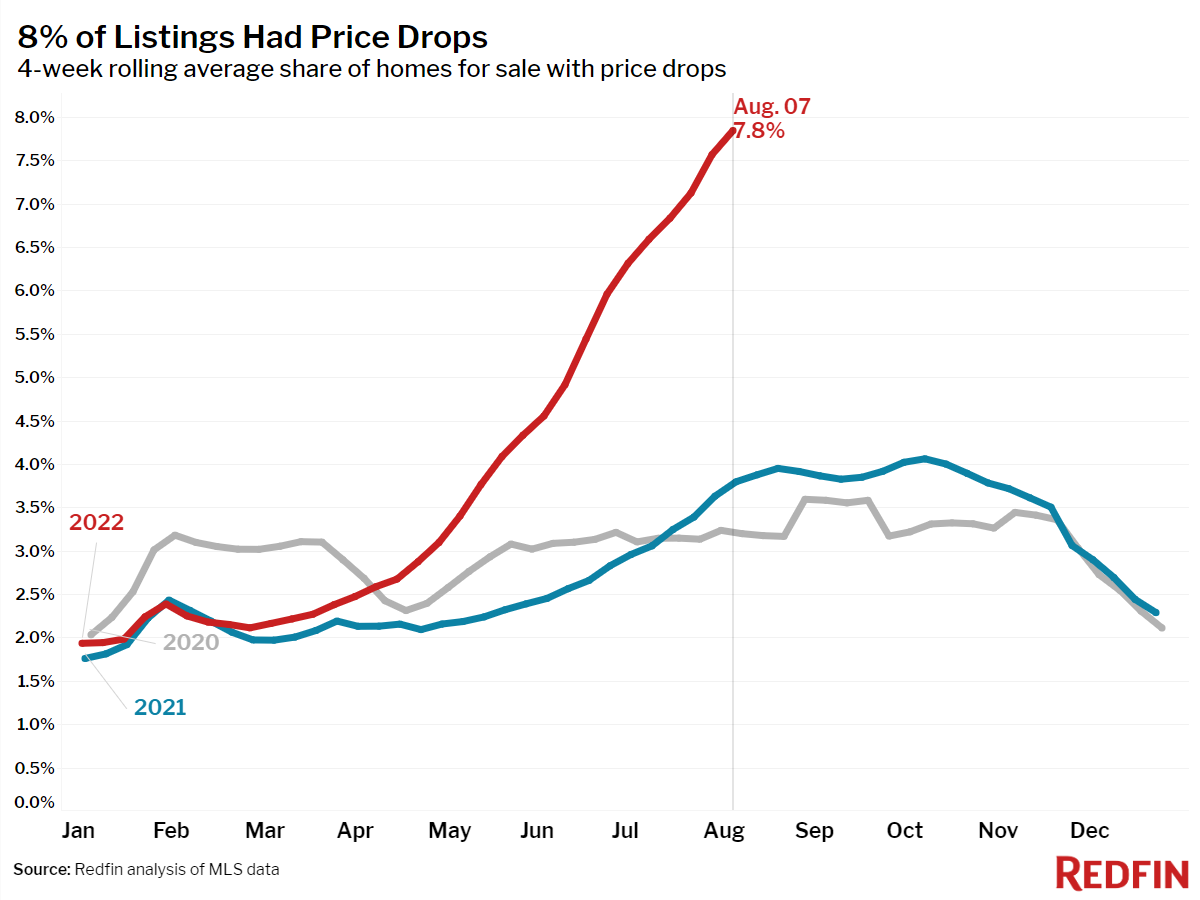
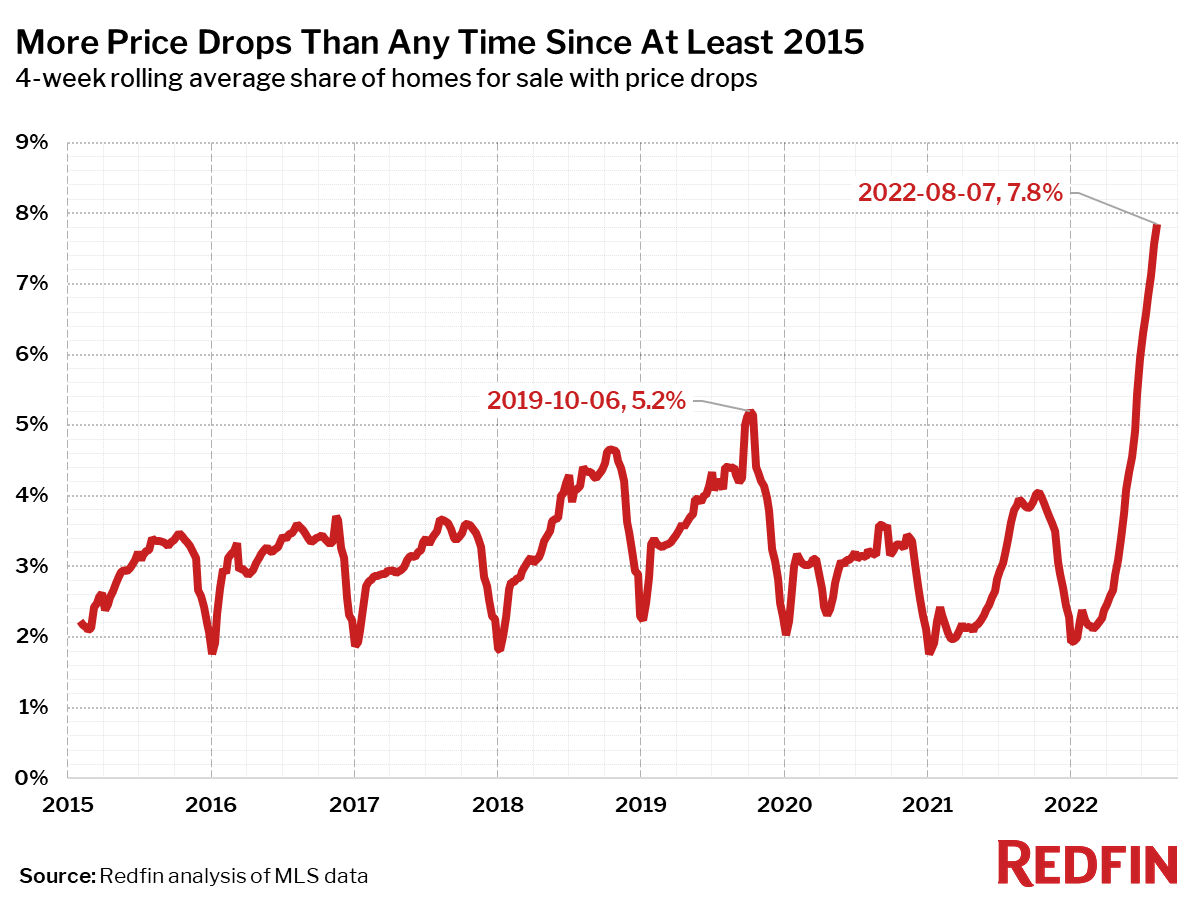
- On average, 7.8% of homes for sale each week had a price drop, a record high.
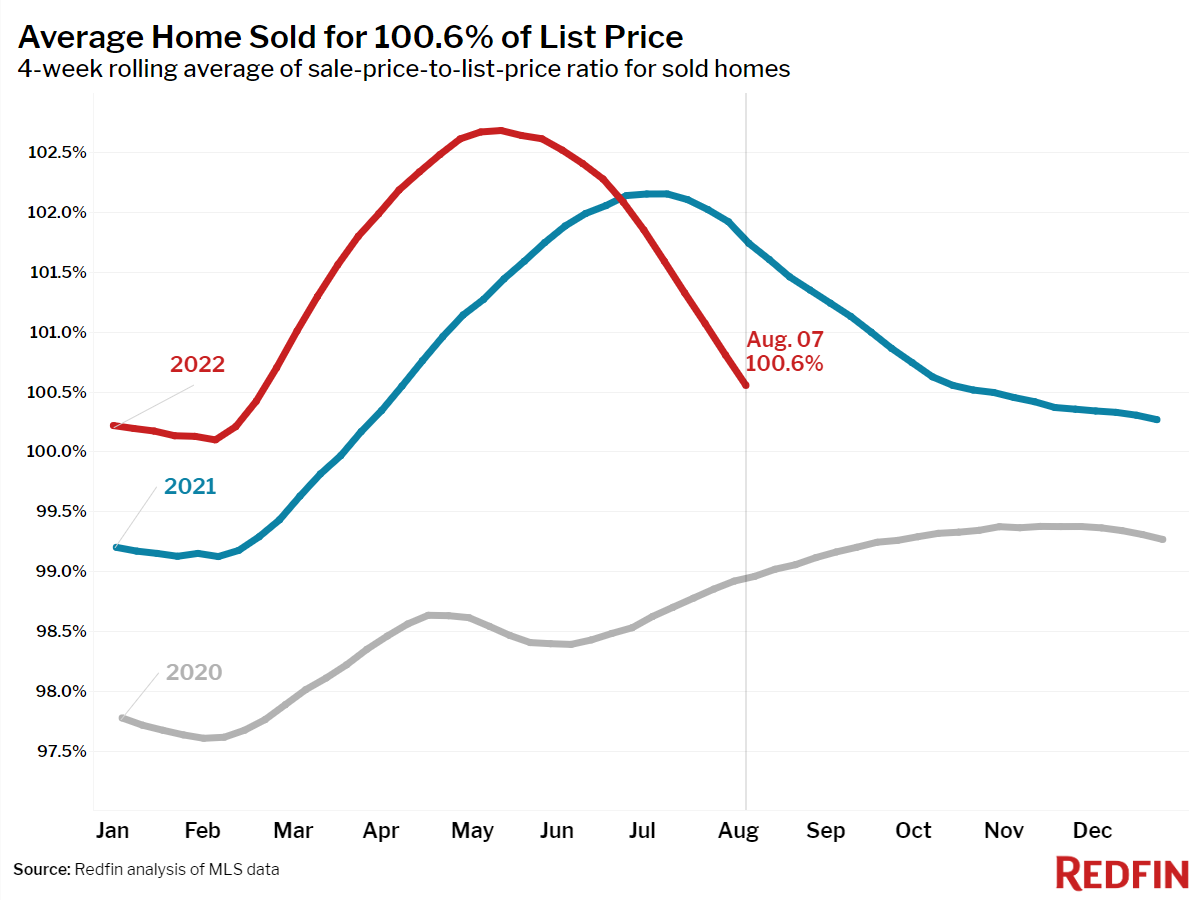
- The average sale-to-list price ratio, which measures how close homes are selling to their asking prices, declined to 100.6% from 101.7% a year earlier. In other words, the average home sold for 0.6% above its asking price.
Refer to our metrics definition page for explanations of all the metrics used in this report.
 United States
 Canada