Inflation and high mortgage rates are taking a bite out of homebuyer budgets, leading to fewer sales and supply gains.
The median sale price for U.S. homes came down 0.7% from its record-breaking June peak during the four weeks ending July 10. Sellers’ asking prices also came down 3% from their May peak as the share of homes with price drops hit another new high. Home supply posted its first year-over-year increase since August 2019 as pending sales continued to slide. These changes in the housing market can be attributed to buyers reaching their limit on costs—not just of homes and mortgages, but also food, transportation and energy.
”Inflation and high mortgage rates are taking a bite out of homebuyer budgets,“ said Redfin chief economist Daryl Fairweather. “Few people are able to afford homes costing 50% more than just two years ago in some areas, so homes are beginning to pile up on the market. As a result, prices are starting to come down from their all-time highs. We expect this environment of reduced competition and declining home prices to continue for at least the next several months.”
Leading indicators of homebuying activity:
- For the week ending July 14, 30-year mortgage rates rose to 5.51%. This was down from a 2022 high of 5.81% but up from 3.11% at the start of the year.
- Fewer people searched for “homes for sale” on Google—searches during the week ending July 9 were down 5% from a year earlier.
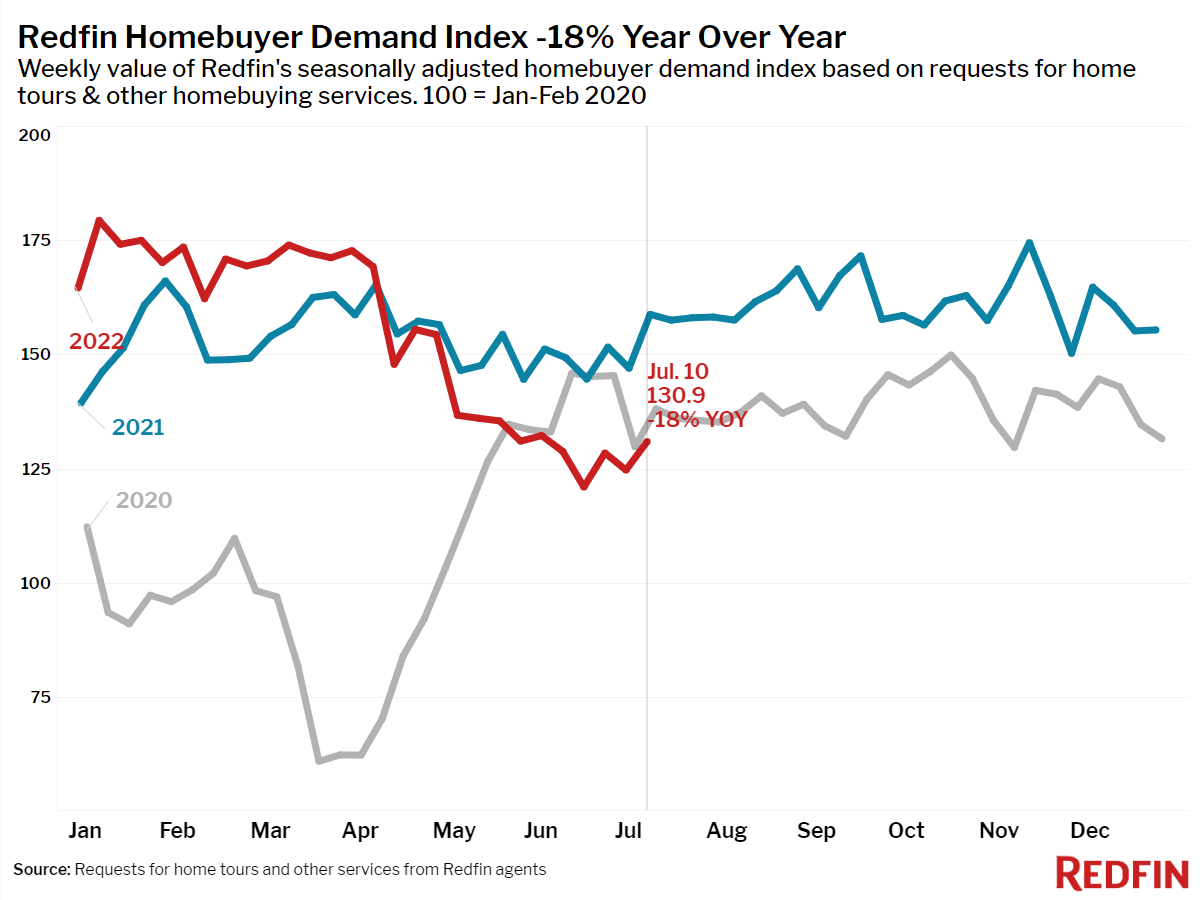
- The seasonally-adjusted Redfin Homebuyer Demand Index—a measure of requests for home tours and other home-buying services from Redfin agents—was down 18% year over year during the week ending July 10.
- Touring activity as of July 10 was up 1% from the start of the year, compared to a 23% increase at the same time last year, according to home tour technology company ShowingTime.
- Mortgage purchase applications were down 18% from a year earlier during the week ending July 8, while the seasonally-adjusted index was down 4% week over week.
Key housing market takeaways for 400+ U.S. metro areas:
Unless otherwise noted, the data in this report covers the four-week period ending July 10. Redfin’s housing market data goes back through 2012.
Data based on homes listed and/or sold during the period:
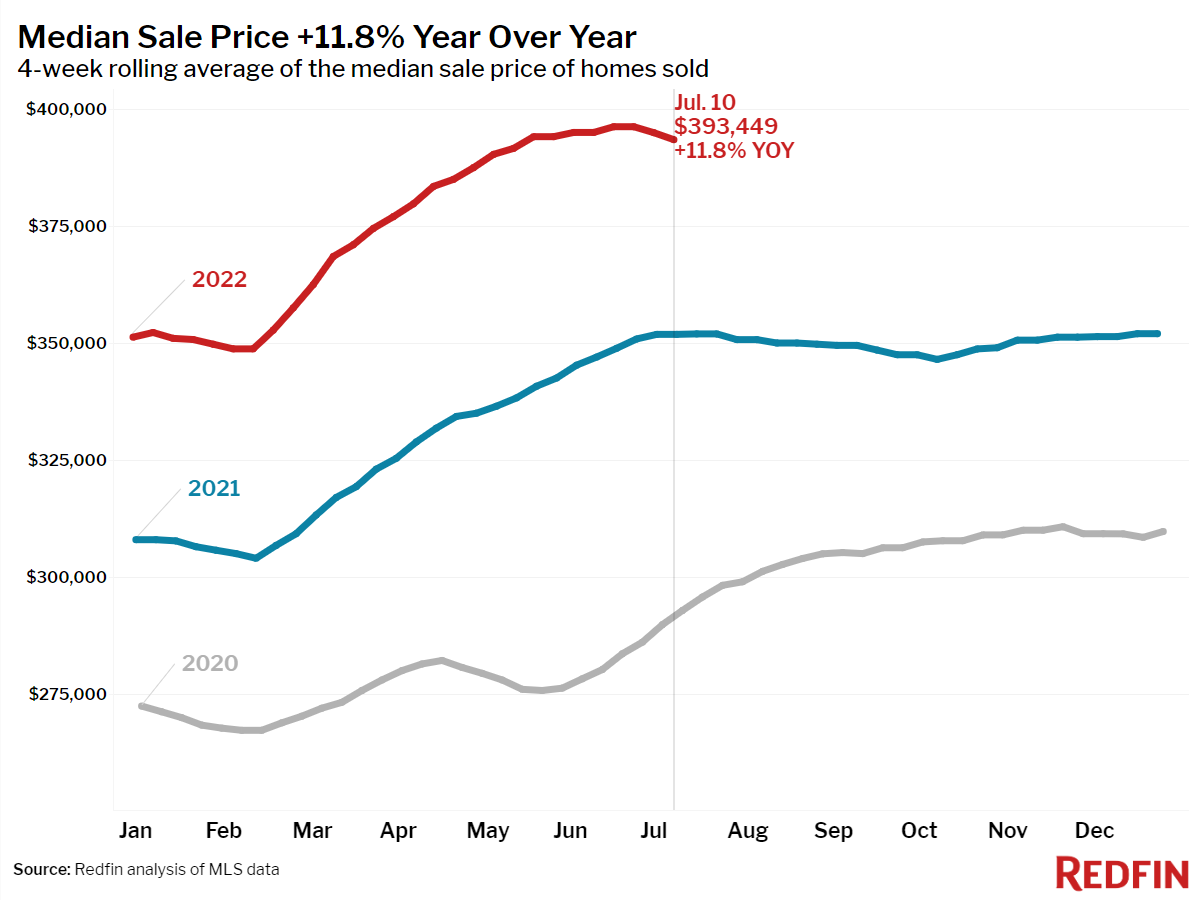
- The median home sale price was up 12% year over year to $393,449. This was down 0.7% from the peak during the four-week period ending June 19. A year ago the median price rose 0.9% during the same period. The year-over-year growth rate was down from the March peak of 16%.
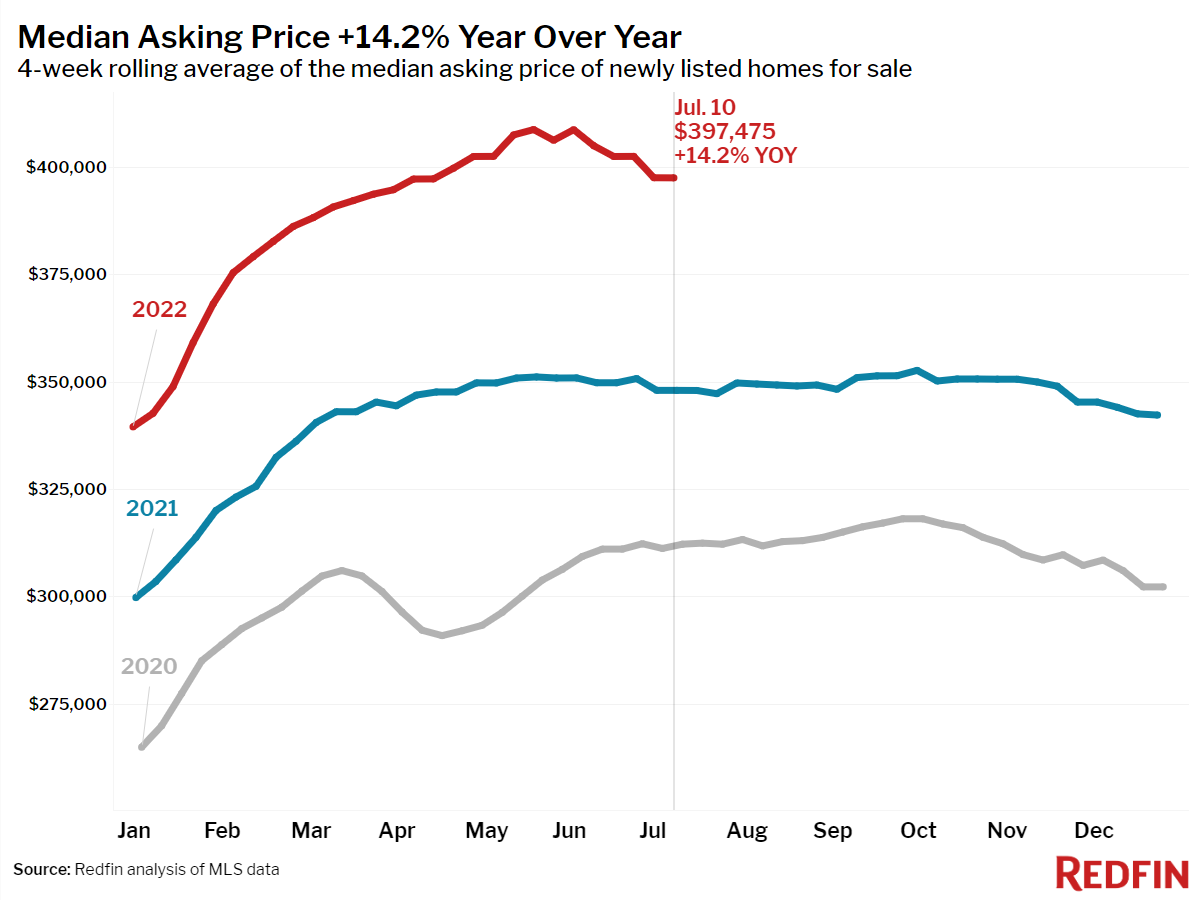
- The median asking price of newly listed homes increased 14% year over year to $397,475, but was down 2.8% from the all-time high set during the four-week period ending May 22. Last year during the same period median prices were down just 0.9%.
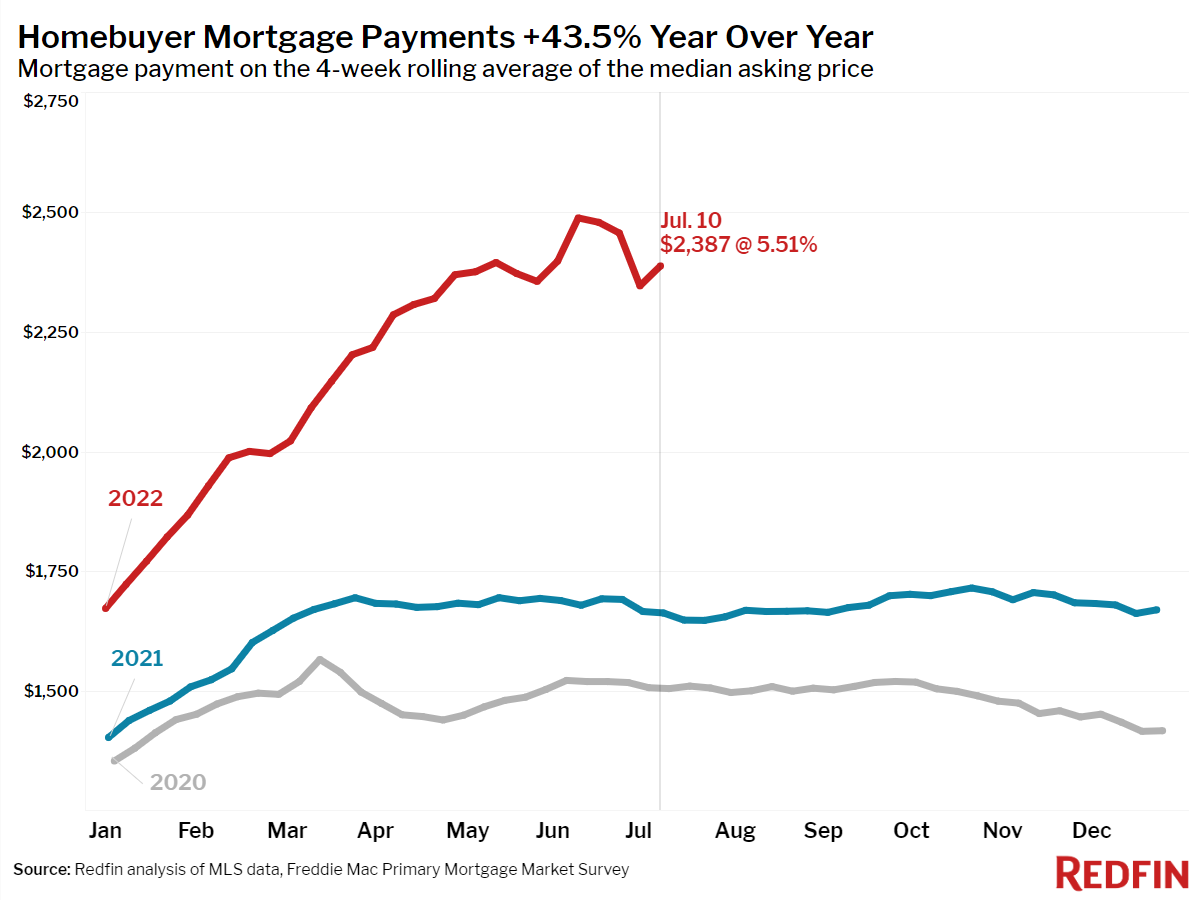
- The monthly mortgage payment on the median asking price home hit $2,387 at the current 5.51% mortgage rate, up 44% from $1,663 a year earlier, when mortgage rates were 2.88%. That’s down slightly from the peak of $2,487 reached during the four weeks ending June 12.
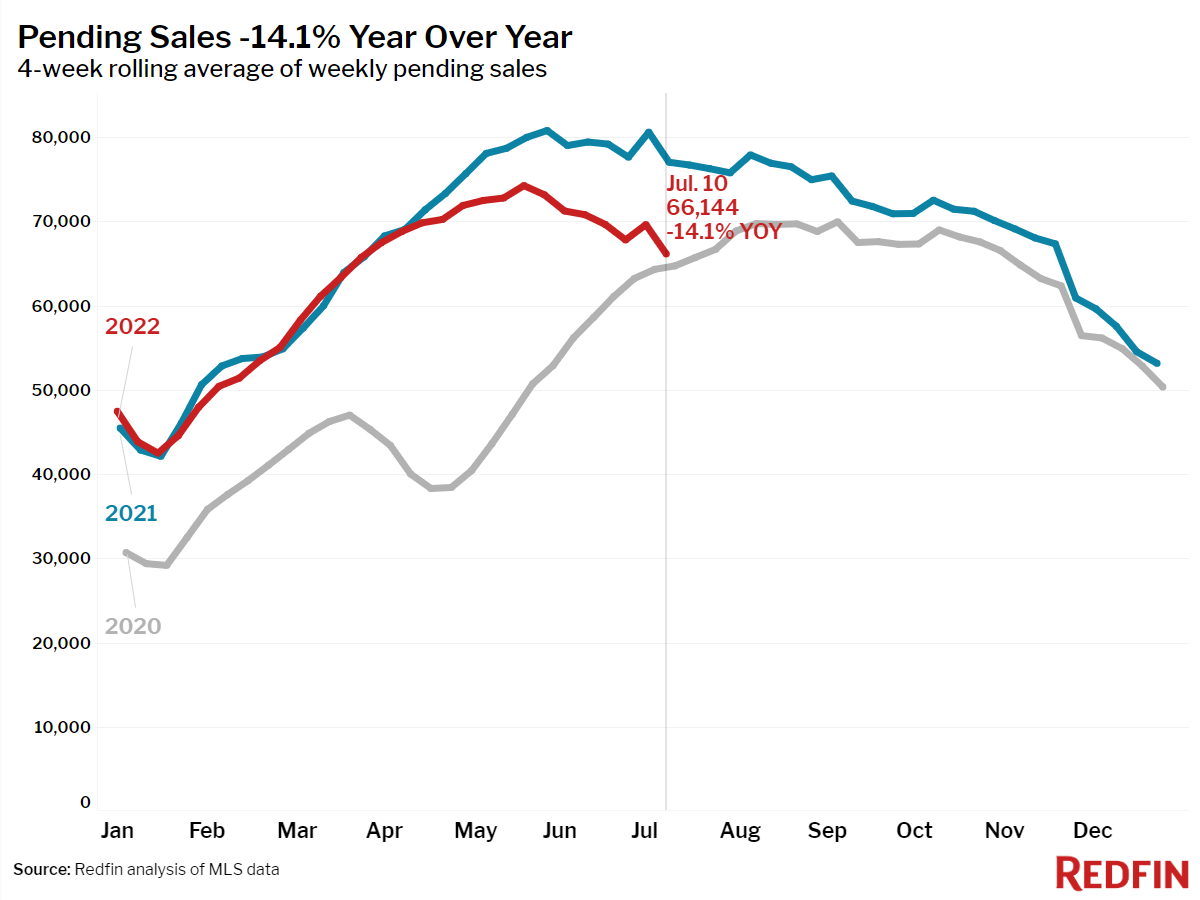
- Pending home sales were down 14% year over year, the largest decline since May 2020.
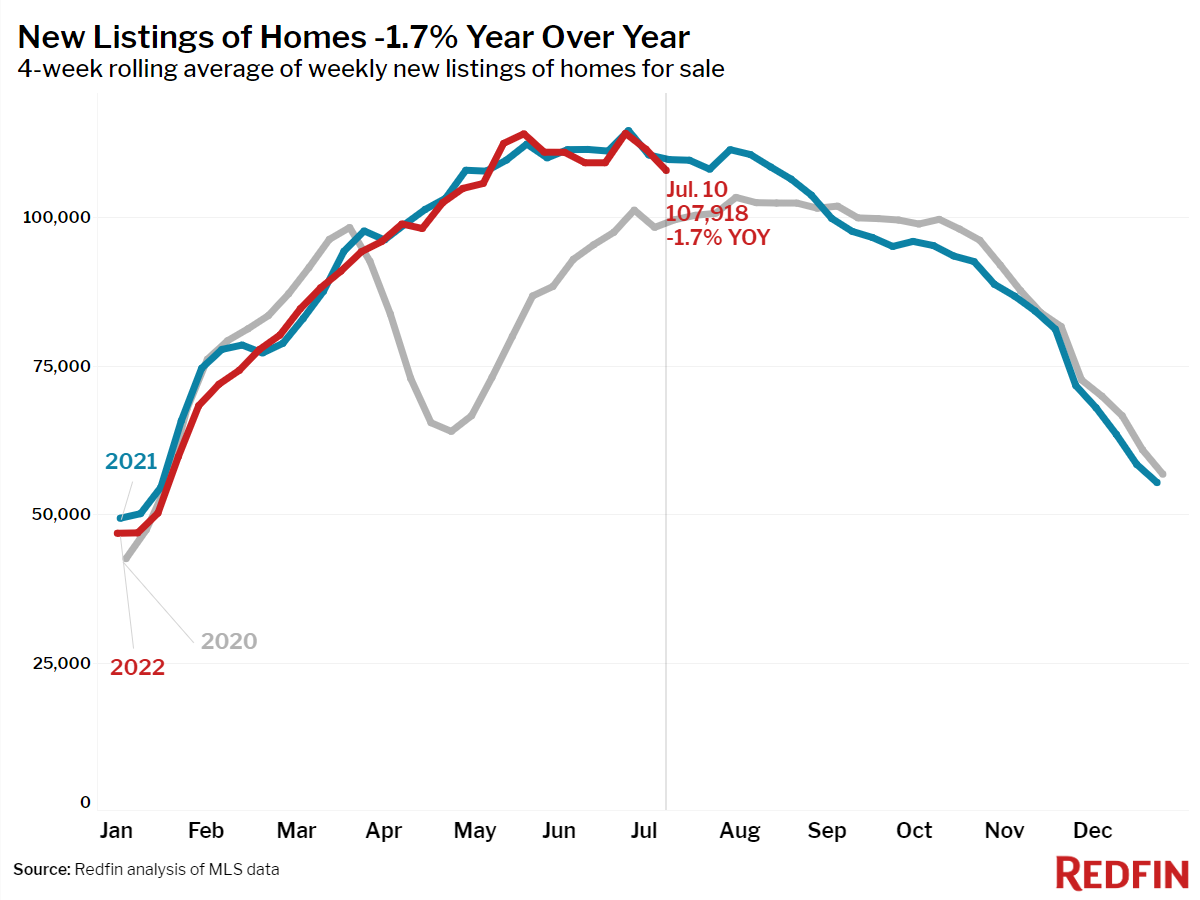
- New listings of homes for sale were down 1.7% from a year earlier.
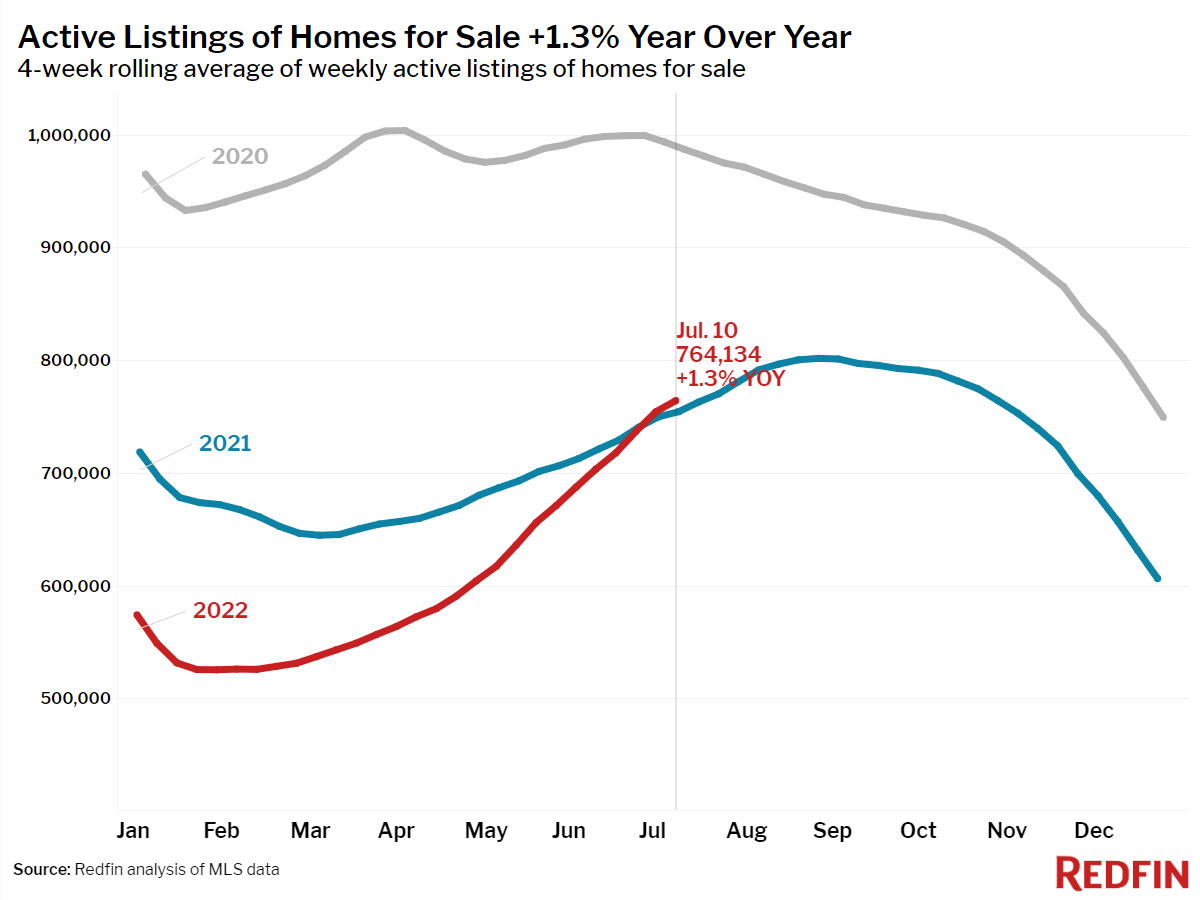
- Active listings (the number of homes listed for sale at any point during the period) rose 1.3% year over year—the largest increase since August 2019.
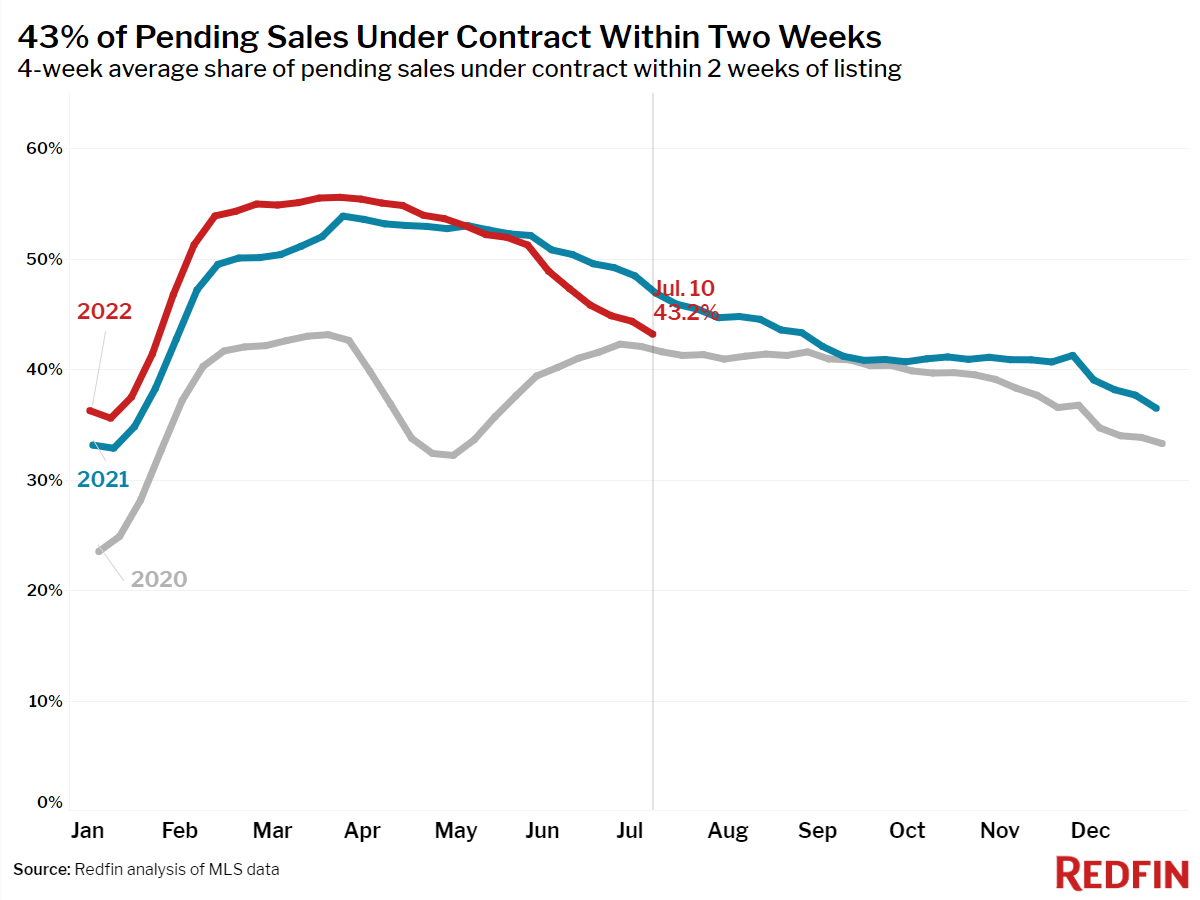
- 43% of homes that went under contract had an accepted offer within the first two weeks on the market, down from 47% a year earlier.
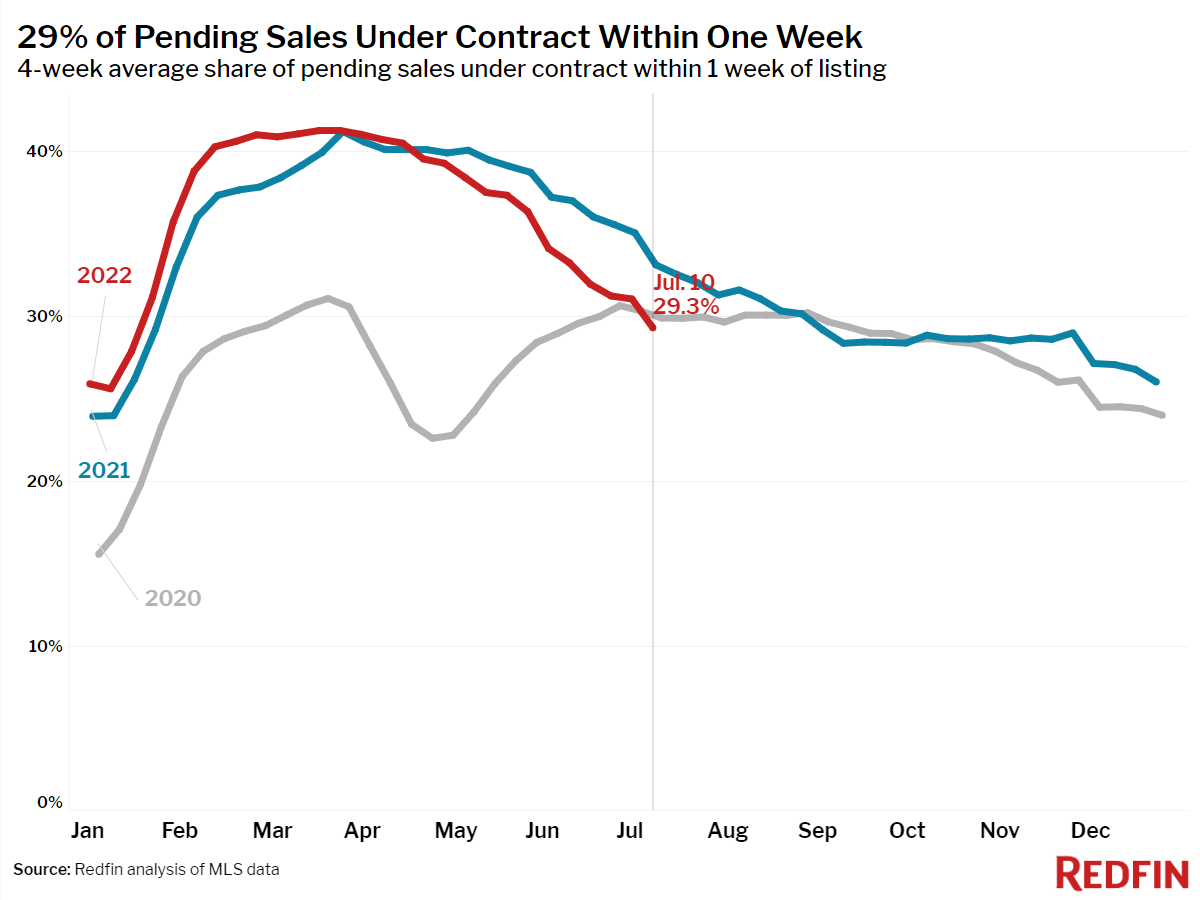
- 29% of homes that went under contract had an accepted offer within one week of hitting the market, down from 33% a year earlier.
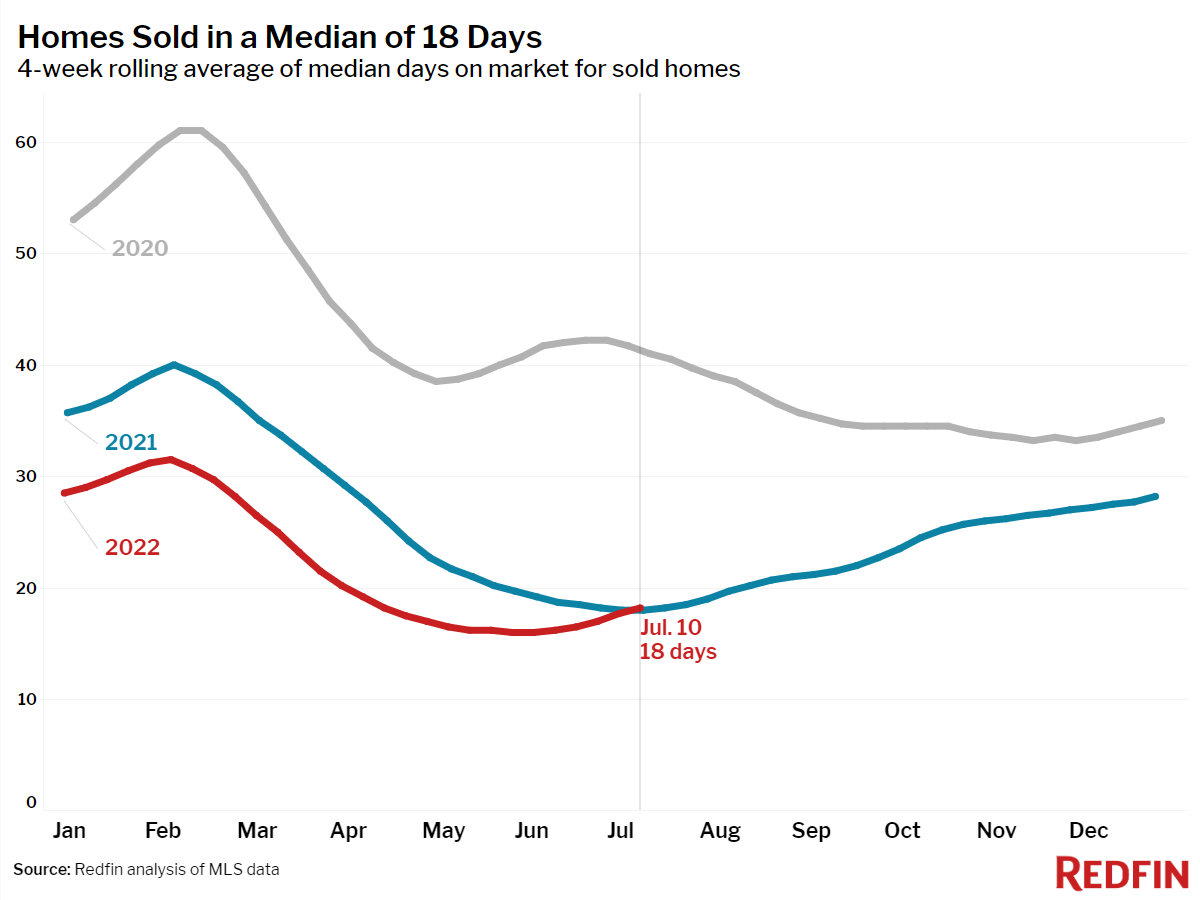
- Homes that sold were on the market for a median of 18 days, flat from a year earlier and up slightly from the record low of 15 days set in May and early June.
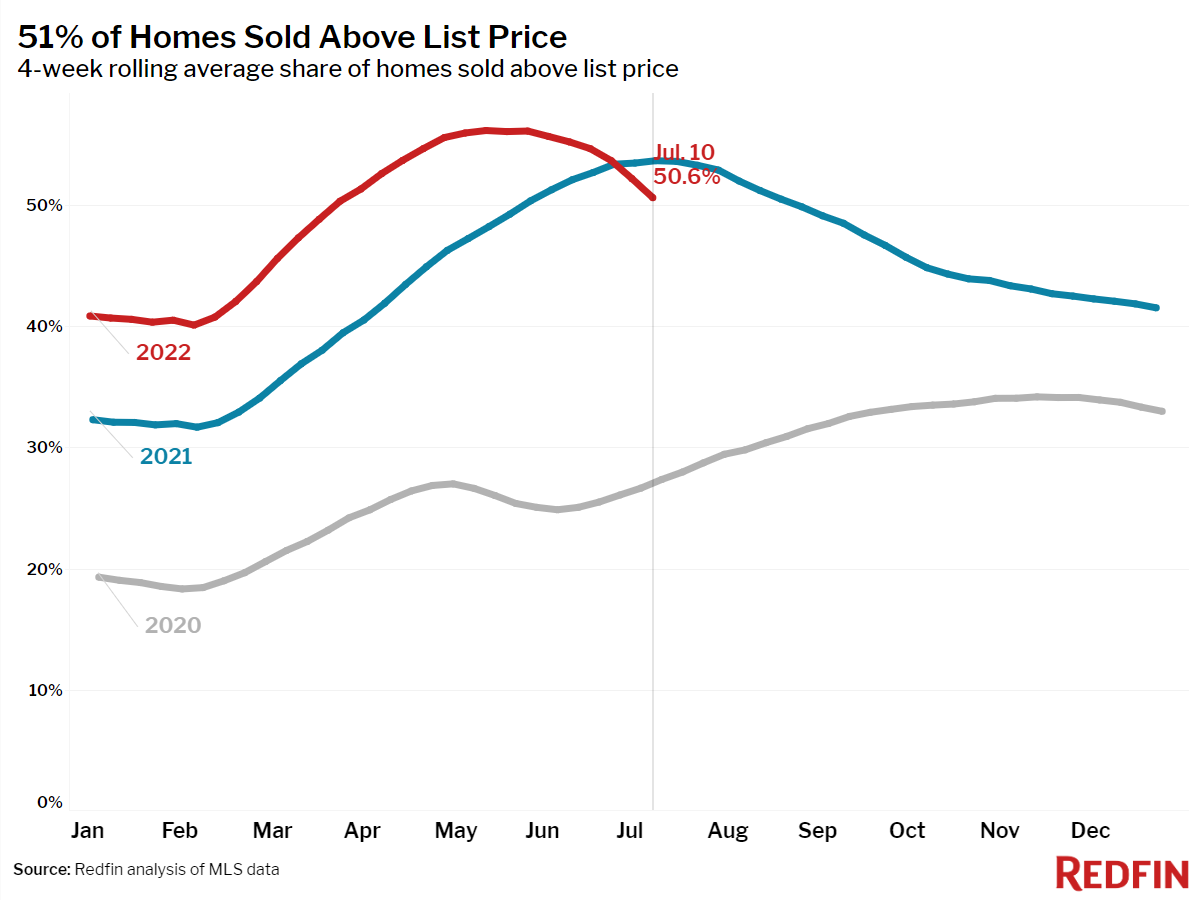
- 51% of homes sold above list price, down from 54% a year earlier.
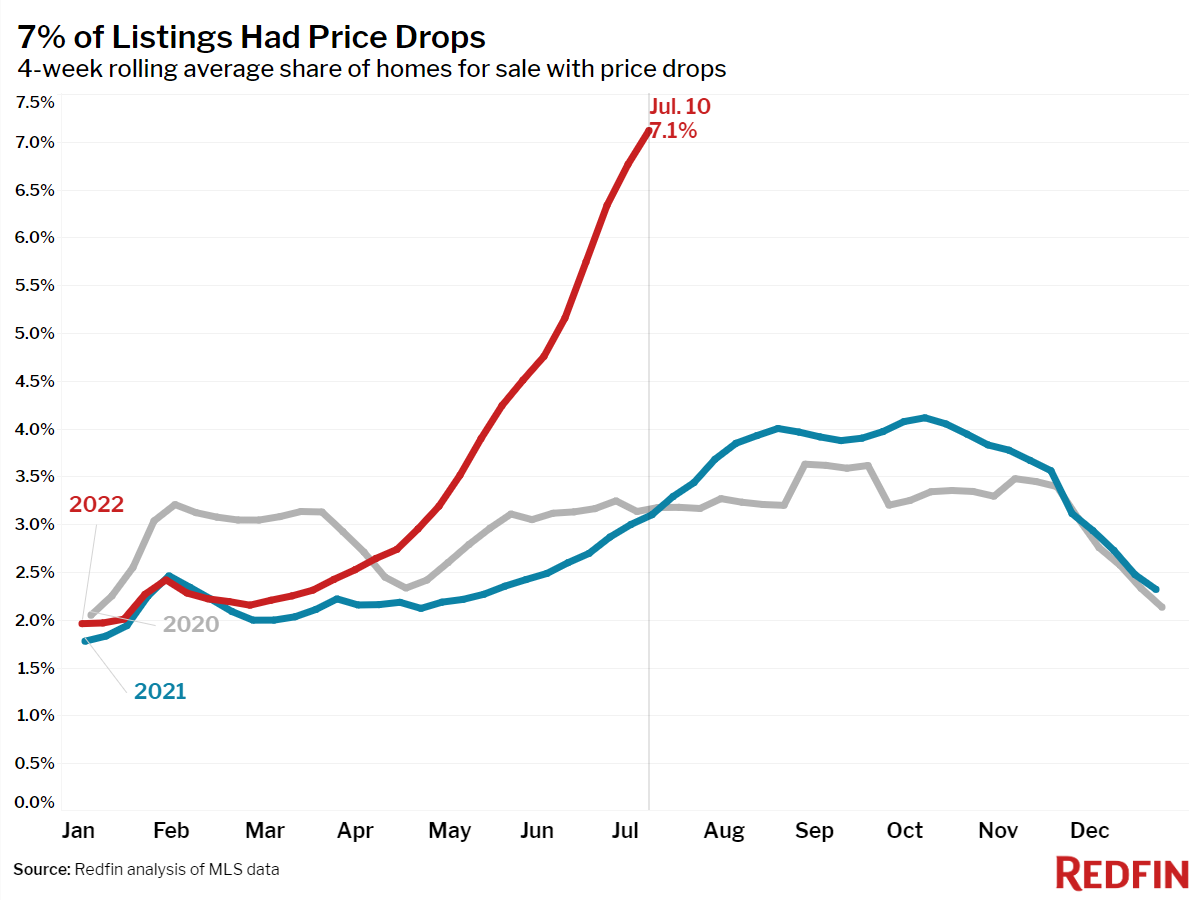
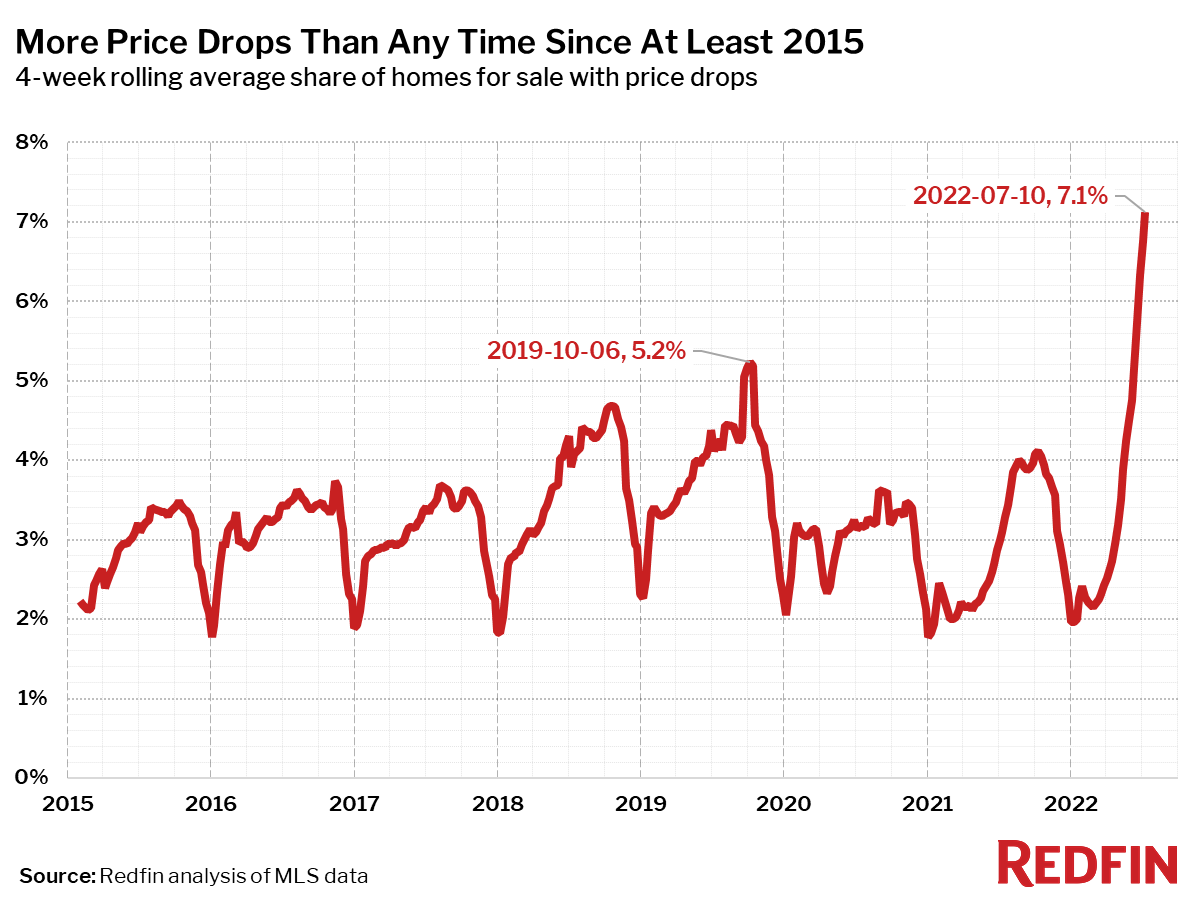
- On average, 7.1% of homes for sale each week had a price drop, a record high as far back as the data goes, through the beginning of 2015.
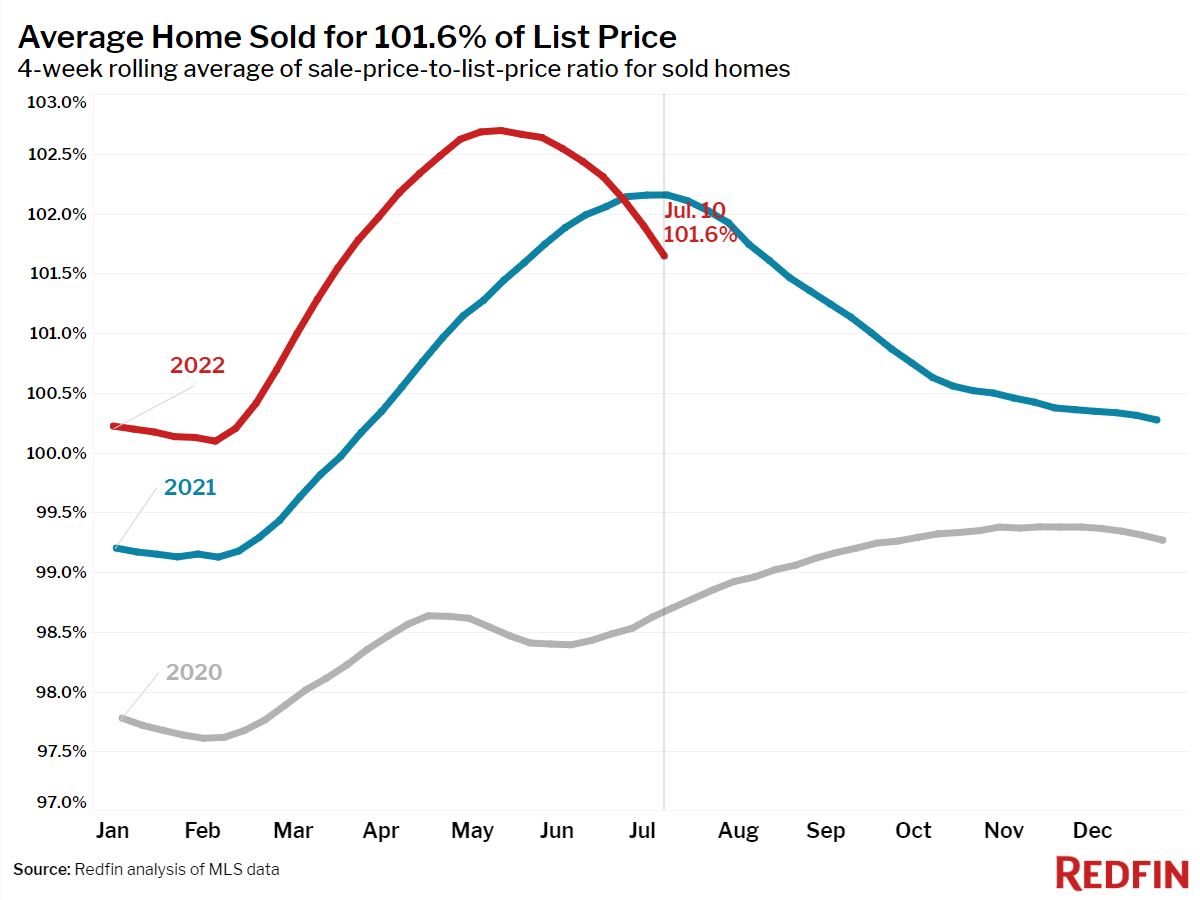
- The average sale-to-list price ratio, which measures how close homes are selling to their asking prices, declined to 101.6%. In other words, the average home sold for 1.6% above its asking price. This was down from 102.2% a year earlier.
Refer to our metrics definition page for explanations of all the metrics used in this report.
 United States
 Canada