The year-over-year decline in iBuyer home purchases narrowed to 6% in the first quarter, when iBuyers snatched up 4,383 homes.
The nation’s top iBuying companies purchased 4,383 homes in the first quarter of 2021—the most recent period for which data is available. While that’s down 6.1% from a year earlier, it’s up 20.6% from the prior quarter—a sign that iBuyers are continuing to ramp up after pausing business at the beginning of the pandemic.
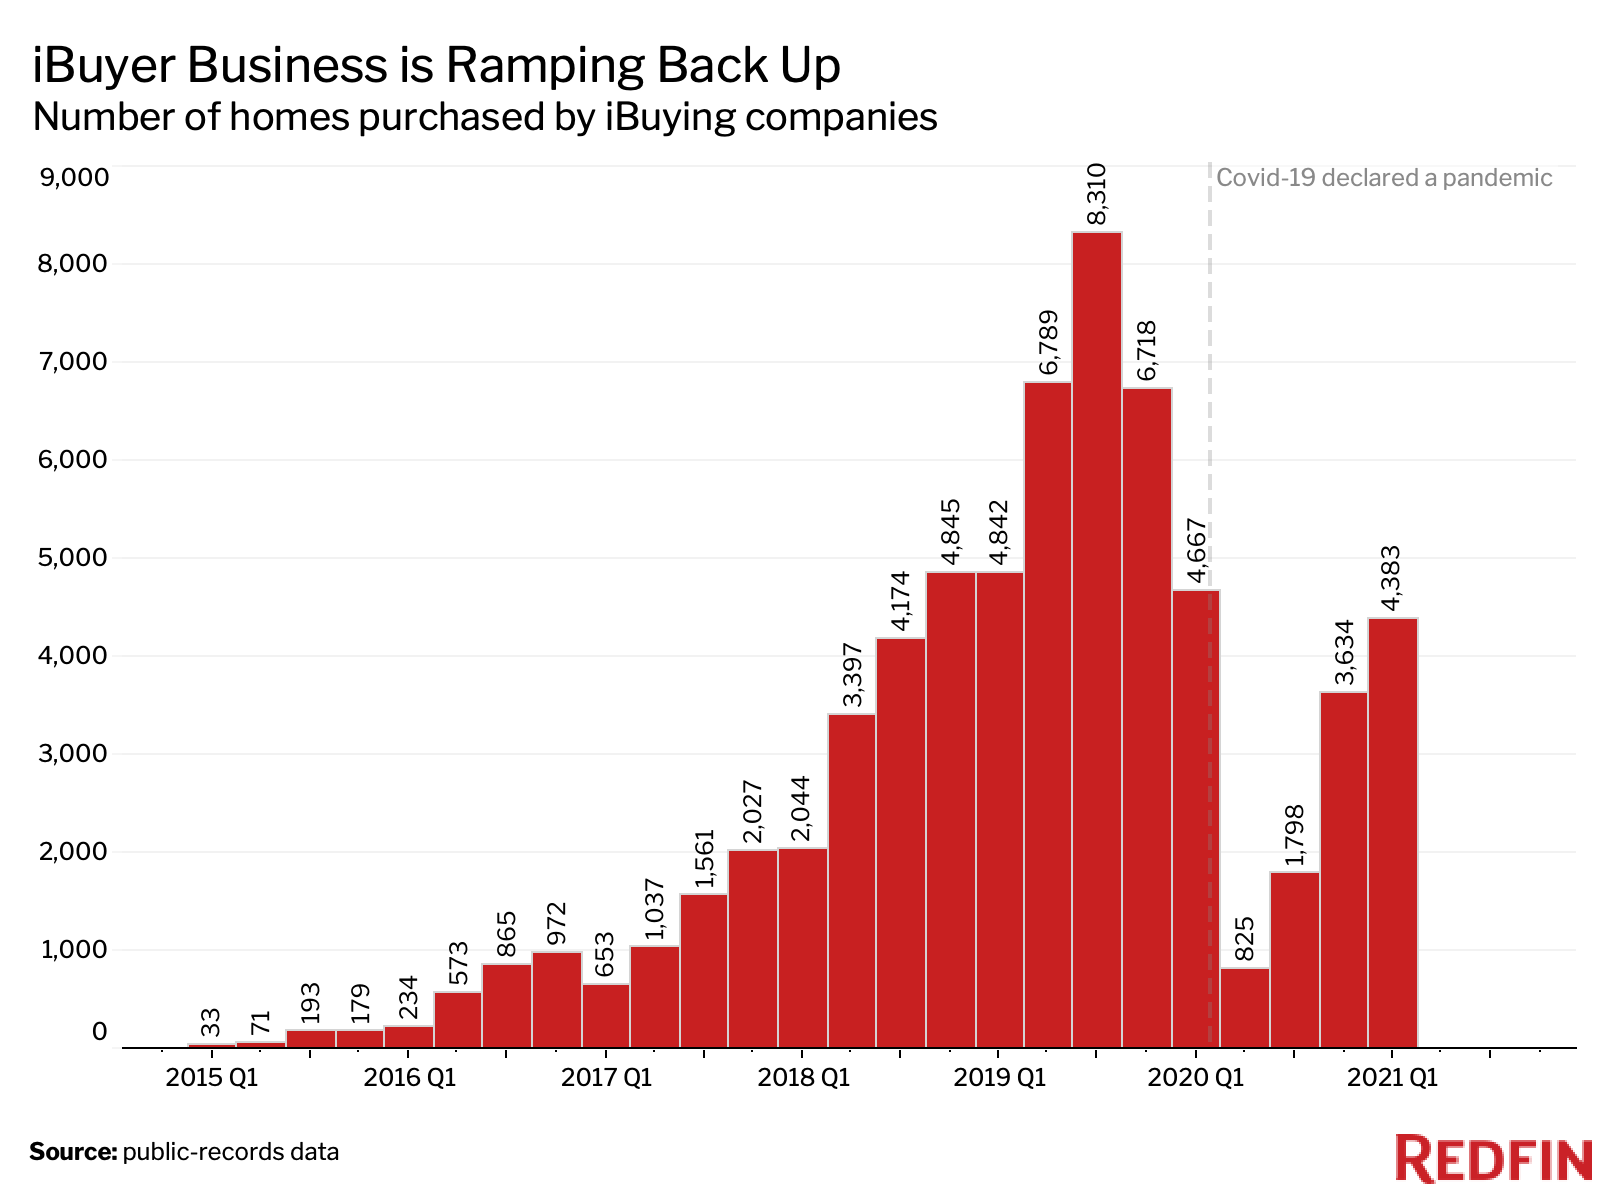
Still, iBuyers make up a tiny portion of the overall housing market, purchasing just 0.5% of homes that sold across the 418 U.S. metropolitan areas tracked by Redfin in the first quarter. That’s down from a peak of 0.8% in the second half of 2019 but up from 0.3% in the fourth quarter of 2020.
This is according to a Redfin analysis of MLS and public-records data on home purchases and sales made by well-known national iBuyers: RedfinNow (Redfin’s iBuying business), Opendoor, Zillow Offers (Zillow’s iBuying business), Offerpad and Bungalo.
The term “iBuyer” (short for instant buyer) is used to describe real estate companies that purchase houses from homeowners in quick cash transactions by using algorithms to evaluate a property’s worth based on comparable market data. iBuyers typically charge sellers a higher fee than a traditional real estate agent would given the certainty of a cash offer with a flexible move-out day and the convenience of avoiding home prep, showings and open houses. These companies then make any necessary improvements to the homes and resell them.
Real estate firms including Redfin, Zillow and Opendoor put iBuying on hold at the onset of the coronavirus pandemic amid economic uncertainty. These companies resumed their iBuying businesses in May and June of last year as housing demand began to rebound thanks to record-low mortgage rates and a wave of relocations made possible by remote work.
“Business really started ramping up in January and February. Since then, we’ve just had a constant barrage of deals,” said Allister Booth, an acquisitions specialist at RedfinNow in Los Angeles. “We’re back to full speed and are buying more homes than we were last year. After we buy and renovate those homes, we know we’ll be able to sell them because there are so many more buyers in the market right now than there are homes available.”
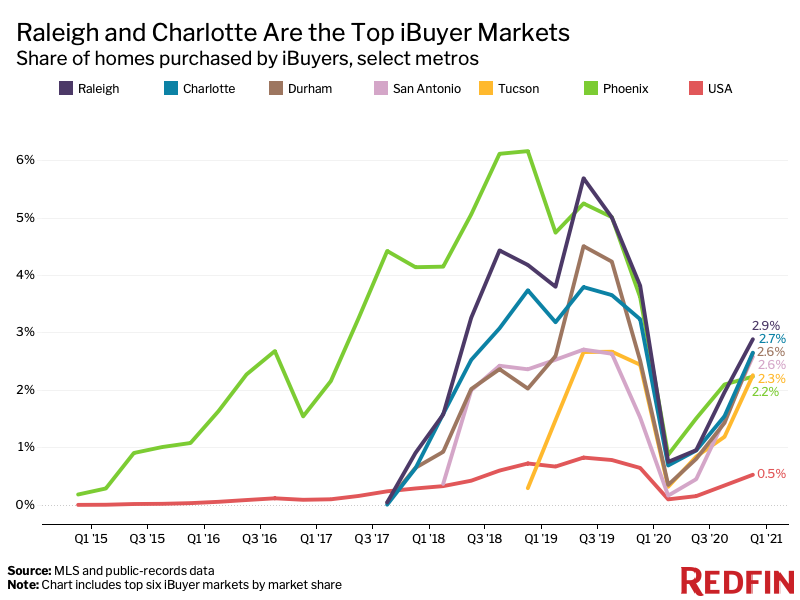
Raleigh and Charlotte Are Top Markets for iBuyers
In Raleigh, NC, iBuyers purchased 2.9% of the homes that sold during the first quarter—a larger share than any other top iBuyer market. Next came Charlotte, NC at 2.7%, Durham, NC and San Antonio, TX at 2.6%, Tucson, AZ at 2.3% and Phoenix at 2.2%.
iBuyers Purchase Less Expensive Homes Than the Typical Homebuyer
iBuyers bought homes for a median of $302,050 in the first quarter. By comparison, the median purchase price for the typical American homebuyer was $320,000. In every top iBuyer market*, iBuying companies purchased homes for less than the metro-area median.
iBuyers Are Selling Homes in 13 Days—a Record Pace
Nationally, the typical iBuyer-owned home found a buyer after 13 days on the market—the quickest pace since at least 2015, when Redfin began recording iBuyer data. That’s down from 33 days a year earlier and a revised 18 days in the fourth quarter. By comparison, the typical home in the overall market spent 31 days on the market (also the quickest pace on record), down from 50 days a year earlier and unchanged from the prior quarter.
In a majority of the top iBuying markets, iBuyers sold their inventory faster than the typical homeowner, with the largest margins in Raleigh and Durham (30 days faster), and Tucson (29 days faster). Lakeland, FL, Charlotte and Portland, OR were the only top iBuyer markets where iBuyers took longer to sell homes.
iBuyers Offer Lower Commissions to Agents When They Sell Homes
When iBuyers sold homes in the first quarter, they offered a 2.43% average commission to the real estate agents representing the buyers, down from 2.67% a year earlier. That compares with a 2.66% average commission in the market overall during the first quarter.
iBuying companies have been experimenting with paying lower commissions to buyers’ agents as a way to cut costs, which can enable them to make more competitive offers when purchasing homes themselves. This could put downward pressure on buyer’s agent commissions across the industry, as data on these fees is becoming widely available to the public for the first time.
First-Quarter 2021 iBuyer Market Summary By U.S. Metro Area
| U.S. Metro Area | Number of Homes Bought by iBuyers, YoY Change | Share of Homes Bought by iBuyers | Share of Homes Bought by iBuyers, YoY Change | iBuyer Median Sale Price | Overall Median Sale Price | iBuyer Median Days On Market | Overall Median Days On Market |
|---|---|---|---|---|---|---|---|
| Atlanta, GA | -25.6% | 2.1% | -0.9 pts | $239,750 | $290,000 | 14 | 19 |
| Austin, TX* | 7.7% | 1.2% | 0.0 pts | — | $400,000 | 7 | 28 |
| Charlotte, NC | -10.1% | 2.7% | -0.6 pts | $277,500 | $304,000 | 40 | 38 |
| Dallas, TX* | 35.6% | 1.8% | 0.5 pts | — | $331,000 | 15 | 26 |
| Durham, NC | 12.2% | 2.6% | 0.1 pts | $262,500 | $319,620 | 9 | 39 |
| Fort Worth, TX* | -9.3% | 2.1% | -0.2 pts | — | $279,995 | 15 | 23 |
| Jacksonville, FL | -1.0% | 1.3% | -0.3 pts | $246,400 | $267,950 | 15 | 32 |
| Lakeland, FL | 290.0% | 1.0% | 0.7 pts | $220,800 | $240,000 | 22 | 18 |
| Las Vegas, NV | -3.3% | 2.0% | -0.6 pts | $327,400 | $330,000 | 14 | 36 |
| Nashville, TN | -14.7% | 1.5% | -0.4 pts | $290,900 | $336,720 | 17 | 34 |
| Orlando, FL | -15.0% | 1.3% | -0.6 pts | $272,100 | $296,000 | 16 | 19 |
| Phoenix, AZ | -32.0% | 2.2% | -1.4 pts | $332,300 | $355,000 | 8 | 29 |
| Portland, OR | 16.3% | 1.2% | 0.1 pts | $440,100 | $467,500 | 8 | 7 |
| Raleigh, NC | -19.9% | 2.9% | -0.9 pts | $280,500 | $322,365 | 11 | 41 |
| Sacramento, CA | 25.3% | 1.6% | 0.2 pts | $452,000 | $495,000 | 7 | 8 |
| San Antonio, TX* | 80.4% | 2.6% | 1.1 pts | — | $260,000 | 19 | 30 |
| Tucson, AZ | 3.0% | 2.3% | -0.2 pts | $262,400 | $275,000 | 13 | 42 |
| National—U.S.A. | -6.1% | 0.5% | -0.1 pts | $302,050 | $320,000 | 13 | 31 |
*iBuyer median sale prices are not available in Texas metros due to limited public-records data.
Methodology
To identify purchases and sales made by iBuyers, we analyzed MLS and public-records data across the 418 markets tracked by Redfin. To determine iBuyer market share, we divided homes sold across all of the markets that Redfin covers by all known home purchases made by RedfinNow, Opendoor, Offerpad, Zillow Offers and Bungalo. There are numerous other companies that engage in iBuying in various markets, however Redfin tracks only the most prominent, national iBuyers.
We determined the top iBuying markets by identifying the metro areas where iBuyers had a market share of at least 1% and purchased at least 20 homes in the first quarter. The 17 metros that met that threshold can be found in the table above.
 United States
 Canada