Investors scooped up more homes in the second quarter than before the pandemic, but purchases leveled off from their 2021 peak as investors reacted to the slowing housing market in different ways. Some took advantage of cooling competition and elevated rental demand, while others pressed pause in hopes of lower prices and more economic certainty in the future.
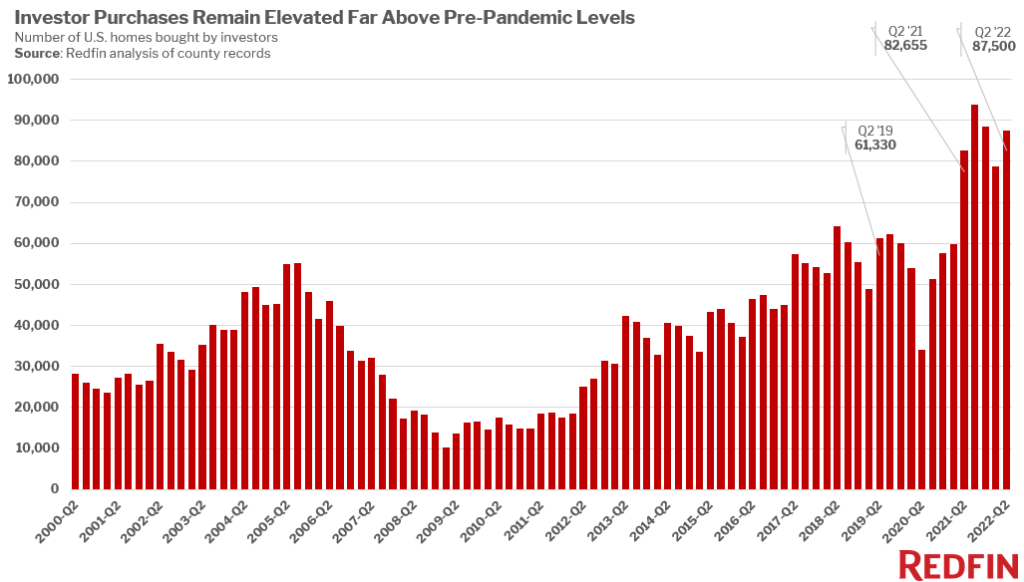
Real estate investors purchased 87,500 U.S. homes in the second quarter, up 11% quarter over quarter and 5.9% year over year. That’s down from the all-time high of 93,700 in the third quarter of 2021, the height of the pandemic-driven homebuying frenzy. Still, investors are buying far more homes than they were before the pandemic; they purchased roughly 60,000 homes per quarter in 2019.
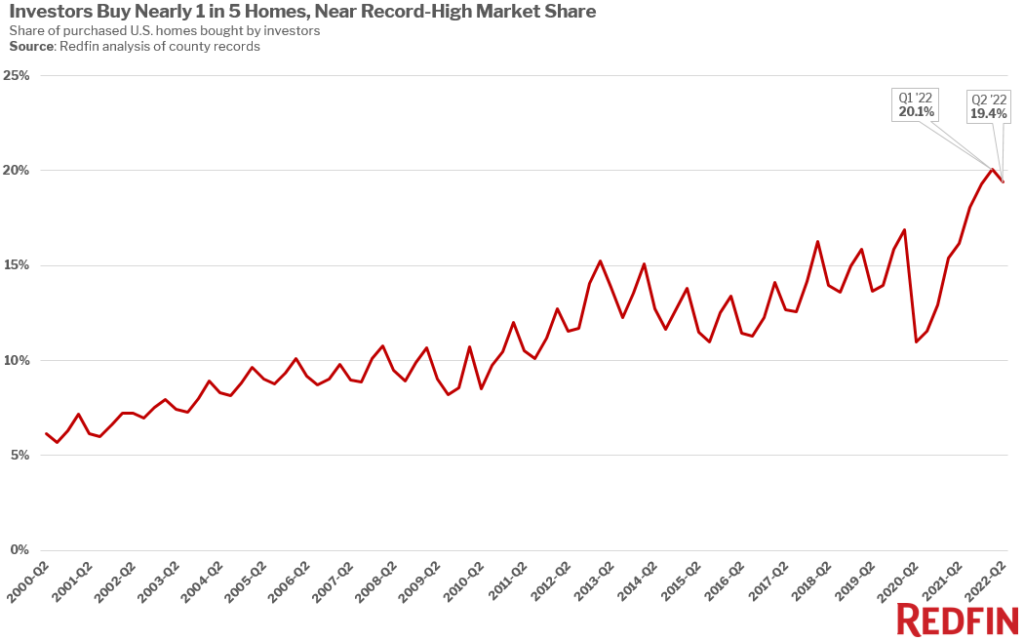
Investor market share has also started to level off but remains above pre-pandemic levels. Investors bought 19.4% of homes that sold in the second quarter, down slightly from a record 20.1% in the first quarter, the first drop after nearly two straight years of increases. But it’s up from 16.2% a year earlier and roughly 15% per quarter in 2019.
This is according to a Redfin analysis of county records across 40 of the most populous U.S. metropolitan areas. We define an investor as any institution or business that purchases residential real estate. When we refer to a “record,” it dates back to the first quarter of 2000. This data is subject to revision. See the bottom of this report for the full methodology.
In dollar terms, investors purchased a record $60.1 billion worth of real estate in the second quarter, up from $50.5 billion in the first quarter and $54.5 billion a year earlier.
While investor purchases have leveled off, they haven’t slumped like home purchases in the broader market–a sign that the housing-market cooldown is a motivator for some investors. Many of them took advantage of the slowdown in the for-sale housing market when dwindling homebuyer competition presented opportunities to buy homes that can be turned into rentals. While rent growth has slowed, it’s still up 14% year over year as prohibitively high home prices keep rental demand afloat.
But the fact that investors are purchasing fewer homes than they were at the height of the pandemic illustrates that other investors–likely those who flip homes for a quick profit rather than rent them out– are shying away amid economic uncertainty and the daunting possibility of buying high and selling low. The typical home investors bought in the second quarter cost a record $474,000, a big jump from $427,000 a quarter earlier and $423,000 a year earlier.
“The cooldown in the overall housing market motivates some investors and scares others off,” said Redfin Senior Economist Sheharyar Bokhari. “Investors are contending with sky-high home prices, just like other buyers. Those who plan to turn homes into rentals are still in the market because high rental payments help offset the cost of the home, and the home will likely grow in value over time. Others are motivated by discounts from home builders looking to sell off extra inventory as individual buyers pull back. But investors in the flipping business have quicker turnaround times, so they’re shying away because the prospect of falling home prices means they may lose money when they relist in six months or a year.”
“Investor purchases probably won’t bounce back to 2021 levels, but they’ll likely remain more common than before the pandemic because the housing market is stable compared with today’s volatile stock market. Those who buy properties as rentals will still cash in, with high demand and vacancies near record lows,” Bokhari continued. “But investors will be less of a roadblock for regular buyers as the housing-market slowdown reduces competition. Investors and individual buyers who can afford to purchase homes have a leg up because other prospective buyers have been priced out.”
Investor home purchases started jumping in the beginning of 2021, taking advantage of record-low mortgage rates and a surge in rental demand as more Americans were priced out of homeownership. Investor activity was one factor making it difficult for individual homebuyers to win homes.
Investors aren’t as deterred by 5%-plus mortgage rates as regular buyers; roughly three-quarters of investor purchases are made in cash. Still, some investors do factor in rising rates because they take out loans to get cash.
Purchases of both affordable and expensive homes are plateauing after a pandemic-driven surge
Investors bought roughly 35,000 low-priced homes in the second quarter, down 6% quarter over quarter and 7.6% year over year. But investors are still buying more low-priced homes than before the pandemic; they purchased roughly 30,000 per quarter in 2019.
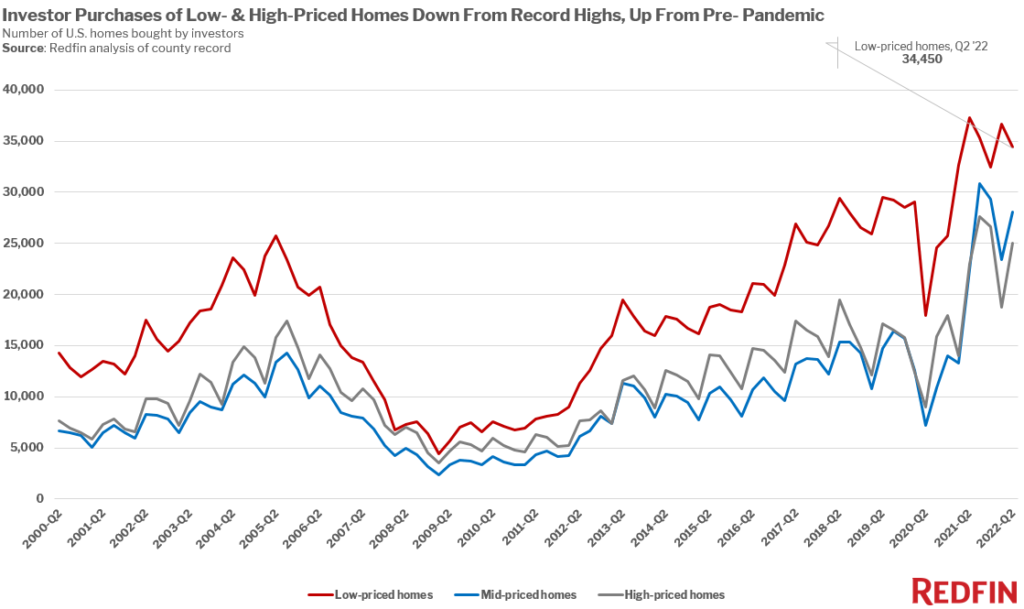
The story is similar for mid-priced and high-priced purchases. Investors bought about 28,000 mid-priced homes, up 25.3% from a year earlier and down from the record 31,000 in the third quarter of 2021. But that’s nearly double pre-pandemic levels: Investors purchased about 15,000 mid-priced homes per quarter in 2019. Investors bought about 25,000 high-priced homes, up 8.9% year over year. While that’s down from the record set in the third quarter of 2021, it’s well above about 15,000 per quarter in 2019, before the pandemic.
Investors’ market share is at or near record highs for both low- and mid-priced homes. Real estate investors bought 25% of low-priced homes that sold in the second quarter, comparable with the 25.1% record set in the first quarter and up from 21.6% a year earlier. They bought a record 18.8% of mid-priced homes, up from 17.9% in the first quarter and 13.5% a year earlier.
Investors bought 15.3% of high-priced homes that sold in the second quarter, down from a record 16.5% at the end of 2021 but up from 13.3% a year earlier.
“There’s still a large investor presence in Phoenix, particularly in the more affordable price range. That’s largely because rental rates are surging, and so is demand as some people are priced out of homebuying,” said Phoenix agent Van Welborn. “The overall market slowed down in early June when mortgage rates shot up, but a lot of investors pay in all cash and they find Phoenix relatively affordable. I’m working with three active investors right now, all from the Bay Area. And one recent local client just purchased a triplex to renovate and rent out.”
Low-priced homes made up the lion’s share of investor purchases. Nearly 40% of investor purchases in the second quarter were low-priced homes, 32.1% were mid-priced and 28.5% were high-priced.
Purchases of single-family homes, by far the most popular property type with investors, leveled off but remain well above pre-pandemic levels
Broken down by property type, investor purchases of single-family homes, condos and multi-family properties follow the same trend as the overall investor market: They’re leveling off but remain well above pre-pandemic levels. Investors bought a record number of townhouses.
Investors purchased nearly 65,000 single-family homes in the second quarter, up 8.5% from a year earlier. That’s down from the record-high of about 70,000 set in the third quarter of 2021, but up from about 40,000 per quarter before the pandemic.

Investors bought about 14,000 condos, down 4.3% year over year but up from about 10,000 per quarter before the pandemic. They purchased roughly 3,500 multi-family properties, down 4.1% year over year and up from about 3,000 per quarter before the pandemic.
Investors purchased a record 5,300 townhouses, up 10.9% year over year. That compares with about 3,000 townhouse purchases per quarter before the pandemic.
Investors have the largest market share in the multi-family market. They bought 29.5% of multi-family properties that sold, little changed from the past five years.
By comparison, investors snapped up 20.3% of single-family homes that sold in the second quarter, close to the record high of 20.9% set in the first quarter. They purchased 16% of condos, up from 14.7% a year earlier and down slightly from 16.6% in the first quarter. Meanwhile, they bought 16.1% of the townhouses that sold, up from 13.4% a year earlier but down from 17.2% in the first quarter.
Most investor purchases are single-family homes. They made up 74.1% of all investor purchases in the second quarter, followed by condos (15.8%), townhouses (6%) and multi-family properties (4.1%).
In Jacksonville, investor purchases were up more than 40% from a year earlier
Investors bought 31.9% of homes that sold in Jacksonville, FL in the second quarter, the highest market share of the metros in this analysis. It’s followed closely by Atlanta, where investors bought up 31.8% of homes. Next come Las Vegas (31.5%), Phoenix (31.2%) and Miami (29%).
Investor purchases were up from a year earlier and a quarter earlier in all five metros with the biggest market shares. They rose 40.7% year over year in Jacksonville, 28.2% in Atlanta, 13.9% in Las Vegas, 2.3% in Phoenix and 9.3% in Miami.
Jacksonville Redfin agent Heather Kruayai said that while investors are still a mainstay in her area’s real estate market, they may start to lose market share in the coming months.
“Investors are still showing a lot of interest in my listings, but their method has changed now that we’re past the height of the pandemic homebuying boom,” Kruayai said. “Investors are often waiting for listings to become stagnant before making offers because they know the longer a home sits on the market, the higher the chance they’ll get it below asking price. Some sellers are starting to reject investor offers because they simply aren’t very strong and often come with long inspection periods. They don’t want to risk an investor backing out during the inspection and lose other potential buyers.”
Providence, RI was the least popular metro for investors, with investors taking up a 7.3% market share. Next came Washington, D.C. (8.1%), Montgomery County, PA (8.3%), Seattle (8.7%) and Warren, MI (9.5%). Investor purchases rose from a year earlier in three of those five places. The exceptions are Seattle and Warren, where purchases declined 18.8% and 17.6%, respectively.
Metro-Level Summary: Investor Home Purchases, Q2 2022
The table below includes the 40 most populous U.S. metros for which data was available
| U.S. metro area | Share of purchased homes bought by investors | Investor purchases, YoY change | Total value of homes bought by investors | Median sale price of homes bought by investors |
|---|---|---|---|---|
| Anaheim, CA | 21.3% | -10.8% | $2,998,162,500 | $1,200,000 |
| Atlanta, GA | 31.8% | 28.2% | $3,376,760,806 | $306,000 |
| Baltimore, MD | 15.5% | 13.4% | $446,844,751 | $155,000 |
| Charlotte, NC | 28.2% | 5.4% | $1,268,804,400 | $335,000 |
| Chicago, IL | 9.7% | -19.3% | $826,692,572 | $222,500 |
| Cincinnati, OH | 17.4% | -9.6% | $280,996,816 | $160,000 |
| Cleveland, OH | 18.1% | 9.6% | $216,215,070 | $106,500 |
| Columbus, OH | 18.4% | 26.3% | $383,459,766 | $230,000 |
| Denver, CO | 16.6% | 17.5% | $1,792,045,788 | $560,000 |
| Detroit, MI | 21.0% | -4.8% | $132,023,275 | $77,500 |
| Fort Lauderdale, FL | 19.6% | 4.9% | $1,425,098,340 | $357,000 |
| Jacksonville, FL | 31.9% | 40.7% | $994,487,262 | $290,000 |
| Las Vegas, NV | 31.5% | 13.9% | $2,012,555,680 | $440,000 |
| Los Angeles, CA | 20.0% | -2.8% | $7,121,490,317 | $1,100,000 |
| Miami, FL | 29.0% | 9.3% | $3,470,392,634 | $450,000 |
| Milwaukee, WI | 14.8% | 2.2% | $231,220,033 | $139,500 |
| Minneapolis, MN | 10.7% | 2.9% | $639,427,566 | $320,000 |
| Montgomery County, PA | 8.3% | 20.1% | $172,048,562 | $243,000 |
| Nashville, TN | 22.7% | 9.1% | $1,063,988,616 | $387,300 |
| Nassau County, NY | 14.2% | -5.3% | $1,070,403,651 | $540,000 |
| New Brunswick, NJ | 11.4% | -0.6% | $502,831,568 | $390,000 |
| New York, NY | 15.5% | 11.4% | $4,516,062,769 | $795,636 |
| Newark, NJ | 13.3% | 0.3% | $284,350,576 | $345,000 |
| Oakland, CA | 14.7% | -4.4% | $1,801,420,500 | $1,200,000 |
| Orlando, FL | 26.8% | 19.5% | $1,386,244,273 | $346,100 |
| Philadelphia, PA | 16.8% | 29.5% | $235,373,539 | $132,500 |
| Phoenix, AZ | 31.2% | 2.3% | $4,643,014,134 | $450,000 |
| Portland, OR | 11.0% | -12.0% | $589,101,747 | $545,000 |
| Providence, RI | 7.3% | 10.2% | $135,745,904 | $290,000 |
| Riverside, CA | 17.2% | -8.0% | $2,001,813,040 | $574,500 |
| Sacramento, CA | 18.1% | -10.2% | $1,188,875,964 | $612,000 |
| San Diego, CA | 22.2% | -4.8% | $2,872,859,091 | $951,000 |
| San Francisco, CA | 20.4% | -15.6% | $2,246,152,500 | $2,045,000 |
| San Jose, CA | 15.9% | -10.8% | $1,761,303,582 | $1,750,000 |
| Seattle, WA | 8.7% | -18.8% | $1,020,143,300 | $912,500 |
| Tampa, FL | 24.3% | 0.8% | $1,761,955,397 | $340,000 |
| Virginia Beach, VA | 10.8% | 21.6% | $197,920,825 | $169,900 |
| Warren, MI | 9.5% | -17.6% | $127,370,599 | $135,000 |
| Washington, DC | 8.1% | 6.3% | $1,079,125,627 | $449,900 |
| West Palm Beach, FL | 17.0% | 1.4% | $1,835,539,655 | $445,000 |
Methodology
For this analysis, we looked at county sale records for homes purchased from January 2000 through June 2022. We define an investor as any buyer whose name includes at least one of the following keywords: LLC, Inc, Trust, Corp, Homes. We also define an investor as any buyer whose ownership code on a purchasing deed includes at least one of the following keywords: association, corporate trustee, company, joint venture, corporate trust. This data may include purchases made through family trusts for personal use.
We analyzed home sales in the 50 most populous metro areas, but only included 40 metros in this report due to non-disclosure of sale prices in some counties.
For the price-tier analysis, we looked at all home sales in a given year and sorted each sale into one of three buckets: low-priced, mid-priced or high-priced. Low-priced means a home’s sale price was in the bottom tercile of local sale.
 United States
 Canada