- Investor home purchases fell a record 46% year over year in the fourth quarter.
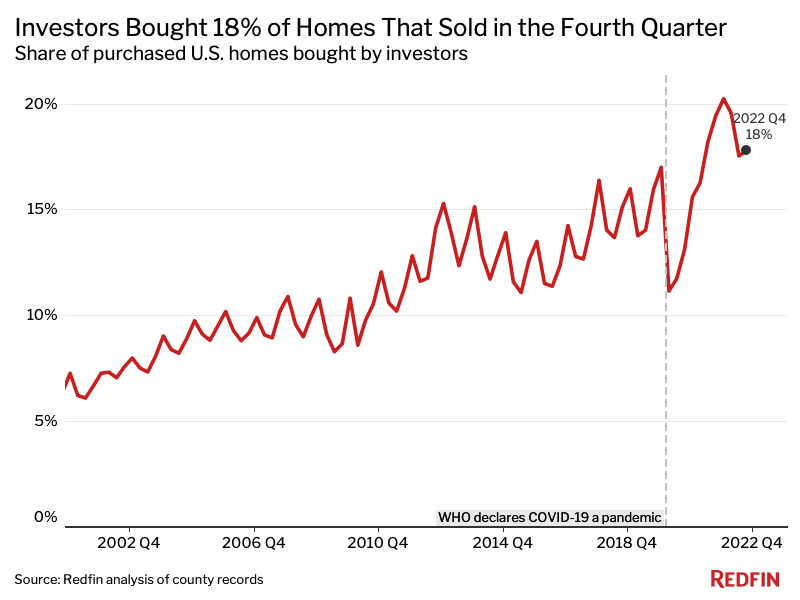
- Investors bought 18% of homes that sold, down from 19% a year earlier.
- Pandemic boomtowns Las Vegas and Phoenix saw investor purchases fall over 60%—more than all of the other metros Redfin analyzed.
- Investors pulled back from single-family homes more than condos and townhomes, and high-priced properties more than low-priced properties.
Investor purchases of U.S. homes fell a record 45.8% year over year in the fourth quarter as the high cost of borrowing money and the prospect of substantial home-price declines made real estate investing less attractive. The second biggest decline occurred in 2008, when investor purchases slumped 45.1% during the subprime mortgage crisis.
Overall U.S. home purchases fell 40.8% from a year earlier in the fourth quarter.
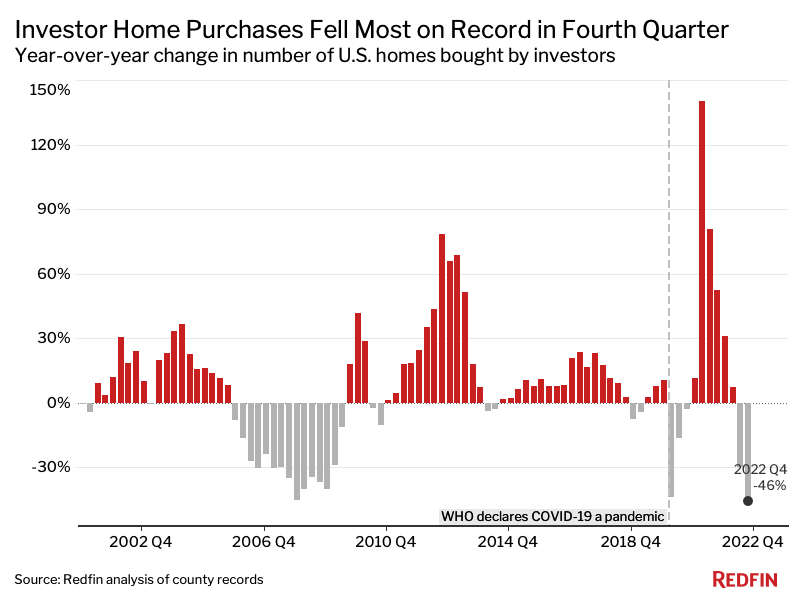
Investor purchases slumped 27% on a quarter-over-quarter basis, the largest quarterly decline on record aside from the beginning of the pandemic. That’s comparable with the 28.1% quarterly drop in overall home purchases.
While many investors have pumped the brakes on homebuying, investor market share has remained fairly steady. That’s because individual homebuyers have also pulled back. Investors purchased 17.8% of all homes that were bought in the metros tracked by Redfin in the fourth quarter. That’s comparable with 17.6% in the prior quarter and down from 19.4% a year earlier.
This is according to a Redfin analysis of county records across 40 of the most populous U.S. metropolitan areas. We define an investor as any institution or business that purchases residential real estate. When we refer to a “record,” the record dates back to the first quarter of 2000. This data is subject to revision. A full methodology can be found at the bottom of this report.
In dollar terms, investors bought $31 billion worth of homes in the fourth quarter, down 42.7% from $54.1 billion one year earlier and down 27.5% from $42.8 billion one quarter earlier. The typical home investors purchased cost $425,926, little changed from one year earlier but down 5.8% from one quarter earlier.
Prospect of Home-Price Declines Prompts Investors to Back Off
Investors piled into the housing market in 2021 due to rock-bottom mortgage rates and surging housing demand, and are now retreating amid projections that home prices have room to fall.
U.S. home prices are up less than 1% year over year—compared with 15% growth one year ago—and have fallen 11% from their spring 2022 peak. In many metros, prices are already declining on a year-over-year basis. That’s because the jump in mortgage rates last year dampened homebuyer demand. Higher rates also mean it’s more expensive to borrow money, which eats into profits. Many investors are moving their money into other asset classes that offer better returns. For investors who are landlords, slowing rent growth is also making it more challenging to reap large returns.
“It’s possible that investors will start to wade back into the market this year given that mortgage rates have ticked down from their 2022 high—especially if home prices show signs of bottoming,” said Redfin Senior Economist Sheharyar Bokhari. “But it’s unlikely that investors will return with the same vigor they had in 2021. That’s good news for individual buyers, who are still grappling with high housing costs but no longer losing bidding war after bidding war to investors.”
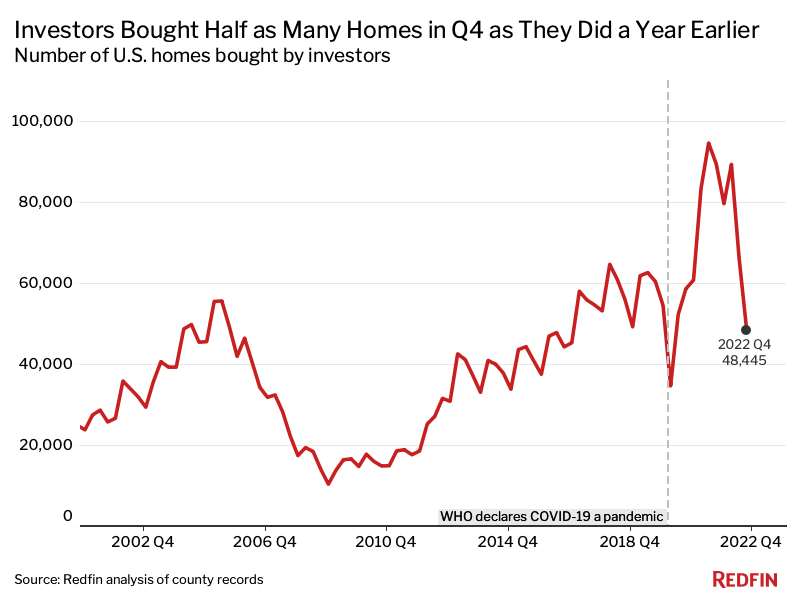
Investor home purchases in the fourth quarter of 2021 were near their record high, which is another reason the year-over-year decline in 2022 was so dramatic. Investors bought 48,445 homes in the metros tracked by Redfin in the fourth quarter of 2022, down from 89,396 a year earlier and 60,447 in the fourth quarter of 2019—before the pandemic.
Pandemic Boomtowns See Biggest Drops in Investor Purchases
In Las Vegas, investor home purchases fell 67% year over year in the fourth quarter, the largest decline among the 40 metros Redfin analyzed. Next came Phoenix (-66.7%), Nassau County, NY (-63%), Atlanta (-62.8%) and Charlotte, NC (-61.9%). Rounding out the top 10 are Jacksonville, FL, Nashville, TN, Sacramento, CA, Riverside, CA and Orlando, FL.
“A lot of investors are on hold because they still see home prices declining,” said Elena Fleck, a Redfin real estate agent in Palm Beach, FL. “The investors who are in the market are selective and aggressive. Many of them are only offering around 60% of the asking price since it’s so difficult to make a profit when flipping homes right now.”
Many of the metros where investor purchases declined significantly are places that soared in popularity during the pandemic. Las Vegas, Phoenix and Sacramento consistently rank on Redfin’s list of top migration destinations, which is based on net inflow, or how many more Redfin.com users are looking to move into a metro than out. Investors expanded in these areas during the pandemic to capitalize on surging rents and home values, and are now pulling back as these markets slow relatively quickly because many homebuyers have been priced out. Phoenix and Sacramento are both among the five metros seeing the largest year-over-year price declines. Prices are also falling from a year ago in Las Vegas and Riverside.
Investor purchases may also be declining in Atlanta, Charlotte, Las Vegas and Phoenix because those markets were popular among iBuyer investors, many of whom have ceased or slowed operations in recent months.
Metros With Largest Declines in Investor Home Purchases: Q4 2022
| Metro area | Investor purchases, YoY change |
| Las Vegas, NV | -67.0% |
| Phoenix, AZ | -66.7% |
| Nassau County, NY | -63.0% |
| Atlanta, GA | -62.8% |
| Charlotte, NC | -61.9% |
| Jacksonville, FL | -57.1% |
| Nashville, TN | -54.8% |
| Sacramento, CA | -53.5% |
| Riverside, CA | -53.0% |
| Orlando, FL | -51.8% |
Baltimore was the only metro Redfin analyzed that saw an increase in investor purchases, which rose 1.4% year over year in the fourth quarter. The smallest declines were in Milwaukee (-7.6%), New York (-7.9%), Providence, RI (-8.6%) and New Brunswick, NJ (-10.3%).
Investors Lose the Most Market Share in Atlanta, Charlotte and Phoenix
Investors lost market share in 15 of the 40 markets Redfin analyzed. Many of those markets are places where investor purchases dropped significantly. In Atlanta, investors bought one-quarter (24.6%) of homes purchased in the fourth quarter, down from more than one-third (36.2%) a year earlier. That’s the largest percentage-point drop among the metros in this analysis. Next came Charlotte (-11.1 pts), Phoenix (-9.3 pts), Las Vegas (-7.9 pts) and Jacksonville (-7.3 pts).
Investors gained the most market share in Baltimore, where they bought 19.4% of homes purchased, up from 13% a year earlier (6.4 pts). Next came Philadelphia (4.3 pts), New York (4.3 pts), Nassau County, NY (4.1 pts) and Milwaukee (4 pts).
Overall, investors had the highest market share in Miami, where they bought 30.6% of homes purchased in the fourth quarter. It was followed by Jacksonville (26.6%), Atlanta (24.6%), Anaheim, CA (22.6%) and Charlotte (22.4%). They had the lowest market share in Warren, MI (9%), Seattle (9.6%), Providence (9.6%), Montgomery County, PA (10.5%) and Minneapolis (10.6%).
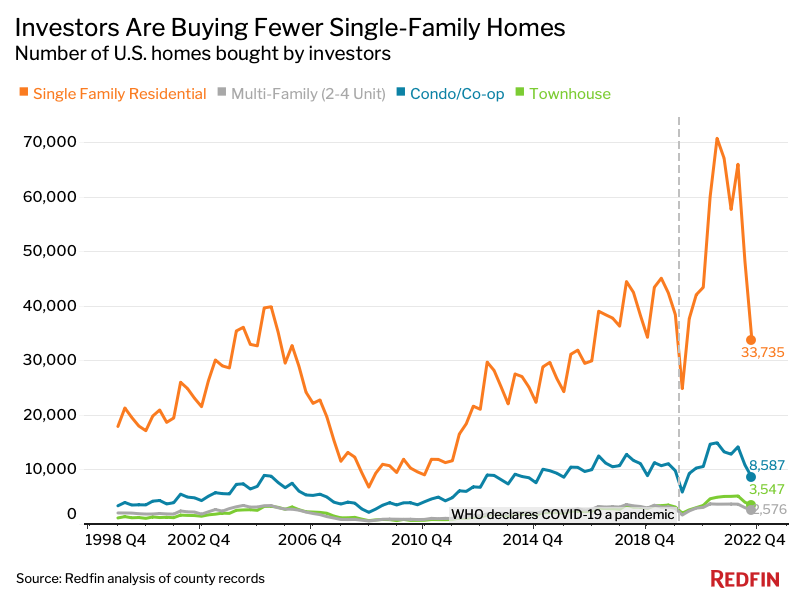
Investor Purchases of Single-Family Homes Sink 50%—More Than Any Other Property Type
Investor purchases of single-family homes fell a record 49.8% year over year in the fourth quarter, more than any other property type. Investor purchases of condos/co-ops decreased 35.6%, while purchases of townhouses and multi-family properties both slumped 31.1%.
Demand for single-family homes surged during the pandemic as scores of people left condos and apartments in cities for more room in the suburbs, but that demand has eased as the pandemic has subsided and many people have returned to the office and city life.
Still, single-family homes remain the most popular property type among investors, representing 69.6% of investor purchases in the fourth quarter. Condos/co-ops came in second, at 17.7%, followed by townhouses (7.3%) and multi-family properties (5.3%).
Investor Purchases of Pricey Homes Fall More Than Purchases of Affordable Homes
Investor purchases of mid-priced homes declined 58% year over year in the fourth quarter and investor purchases of high-priced homes fell 53.2%. By comparison, investor purchases of low-priced homes fell 28.6%.
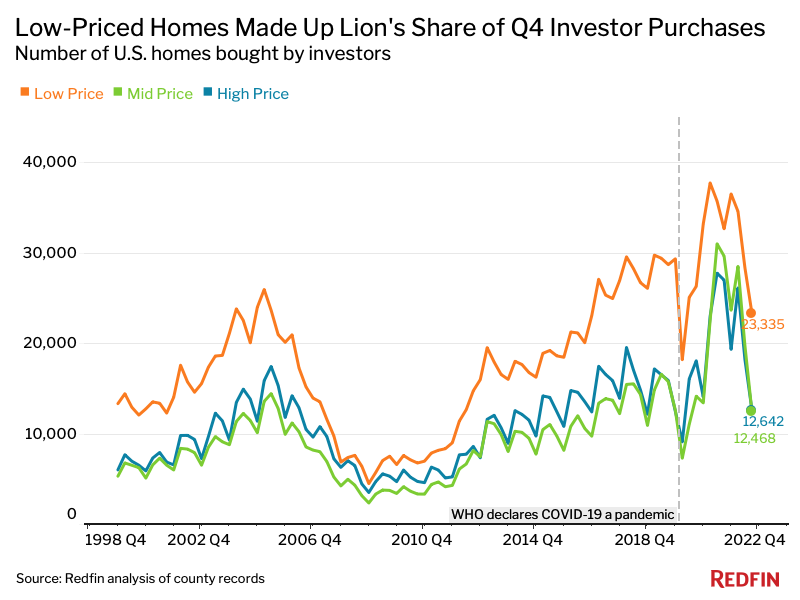
The market for high-end goods tends to slow at a relatively sharp pace during economic downturns as consumers trim fat from their budgets. The lion’s share of investors also generally gravitate toward lower-priced homes, which offer more room to generate profits. Low-priced homes made up 48.2% of investor home purchases in the fourth quarter, while mid-priced and high-priced homes both represented roughly 26%.
Investors also had the highest market share in the low-priced market; they bought 24.1% of low-priced homes that sold in the fourth quarter, compared with 15% of high–priced homes and 13.8% of mid-priced homes.
A record 39.5% of investor purchases in the fourth quarter were starter homes, or homes with 1,400 or fewer square feet.
Metro-Level Summary: Investor Home Purchases, Q4 2022
The table below includes the 40 most populous metros for which data was available.
| Metro area | Investor purchases, YoY change | Total value of homes bought by investors | Median sale price of homes bought by investors | Share of purchased homes bought by investors | Share of purchased homes bought by investors, YoY change (percentage points) |
| Anaheim, CA | -39.8% | $1,662,352,273 | $1,075,000 | 22.6% | 2.2 pts |
| Atlanta, GA | -62.8% | $1,385,020,986 | $272,000 | 24.6% | -11.7 pts |
| Baltimore, MD | 1.4% | $374,020,273 | $160,000 | 19.4% | 6.4 pts |
| Charlotte, NC | -61.9% | $704,208,236 | $286,500 | 22.4% | -11.1 pts |
| Chicago, IL | -29.2% | $662,204,022 | $225,000 | 12.4% | 1.0 pts |
| Cincinnati, OH | -12.6% | $230,170,771 | $150,000 | 19.2% | 2.4 pts |
| Cleveland, OH | -12.5% | $178,834,979 | $105,000 | 19.9% | 3.1 pts |
| Columbus, OH | -42.4% | $257,052,387 | $199,250 | 17.7% | -2.6 pts |
| Denver, CO | -50.8% | $770,633,837 | $500,000 | 15.4% | -1.2 pts |
| Detroit, MI | -29.4% | $98,732,265 | $85,500 | 19.1% | -1.1 pts |
| Fort Lauderdale, FL | -37.3% | $775,621,000 | $320,000 | 20.8% | -1.1 pts |
| Jacksonville, FL | -57.1% | $413,863,722 | $249,000 | 26.6% | -7.3 pts |
| Las Vegas, NV | -67.0% | $646,235,700 | $379,540 | 21.7% | -7.9 pts |
| Los Angeles, CA | -43.1% | $4,120,047,046 | $1,025,000 | 19.5% | 0.2 pts |
| Miami, FL | -35.4% | $1,544,074,625 | $425,000 | 30.6% | 1.1 pts |
| Milwaukee, WI | -7.6% | $171,002,882 | $160,000 | 17.4% | 4.0 pts |
| Minneapolis, MN | -38.0% | $409,168,441 | $288,200 | 10.6% | -0.4 pts |
| Montgomery County, PA | -11.8% | $153,326,821 | $280,000 | 10.5% | 1.8 pts |
| Nashville, TN | -54.8% | $489,757,569 | $357,950 | 17.8% | -5.7 pts |
| Nassau County, NY | -63.0% | $320,751,977 | $575,000 | 14.2% | 4.1 pts |
| New Brunswick, NJ | -10.3% | $468,581,223 | $375,000 | 12.7% | 2.2 pts |
| New York, NY | -7.9% | $2,958,588,566 | $750,000 | 18.2% | 4.3 pts |
| Newark, NJ | -13.1% | $253,855,983 | $387,500 | 13.0% | 1.7 pts |
| Oakland, CA | -33.4% | $936,723,591 | $1,000,000 | 14.5% | 1.9 pts |
| Orlando, FL | -51.8% | $640,284,831 | $312,000 | 21.7% | -5.7 pts |
| Philadelphia, PA | -18.2% | $186,177,491 | $130,000 | 20.0% | 4.3 pts |
| Phoenix, AZ | -66.7% | $1,587,170,877 | $399,000 | 20.4% | -9.3 pts |
| Portland, OR | -46.9% | $349,699,305 | $503,000 | 12.1% | -1.0 pts |
| Providence, RI | -8.6% | $116,027,351 | $303,750 | 9.6% | 2.7 pts |
| Riverside, CA | -53.0% | $803,006,874 | $500,000 | 17.1% | 1.2 pts |
| Sacramento, CA | -53.5% | $574,633,500 | $570,000 | 16.6% | -2.4 pts |
| San Diego, CA | -47.4% | $1,425,714,409 | $905,000 | 20.6% | 0.0 pts |
| San Francisco, CA | -37.2% | $1,185,937,300 | $1,781,500 | 20.9% | 2.4 pts |
| San Jose, CA | -36.8% | $736,258,500 | $1,555,000 | 14.4% | 2.3 pts |
| Seattle, WA | -42.2% | $647,661,446 | $795,000 | 9.6% | 0.2 pts |
| Tampa, FL | -50.7% | $918,199,490 | $290,000 | 20.7% | -5.6 pts |
| Virginia Beach, VA | -21.8% | $137,000,729 | $175,000 | 12.2% | 2.7 pts |
| Warren, MI | -29.4% | $110,554,643 | $147,500 | 9.0% | 0.2 pts |
| Washington, D.C. | -24.6% | $675,342,852 | $415,000 | 10.7% | 3.0 pts |
| West Palm Beach, FL | -11.4% | $957,613,044 | $390,000 | 17.8% | 1.4 pts |
| National—U.S.A. | -45.8% | $31,036,111,817 | $425,926 | 17.8% | -1.6 pts |
Methodology
For this analysis, we looked at county sale records for homes purchased from January 2000 through December 2022. We define an investor as any buyer whose name includes at least one of the following keywords: LLC, Inc, Trust, Corp, Homes. We also define an investor as any buyer whose ownership code on a purchasing deed includes at least one of the following keywords: association, corporate trustee, company, joint venture, corporate trust. This data may include purchases made through family trusts for personal use.
We analyzed home sales in the 50 most populous metro areas, but only included 40 metros in this report due to non-disclosure of sale prices in some counties.
For the price-tier analysis, we looked at all home sales in a given year and sorted each sale into one of three buckets: low-priced, mid-priced or high-priced. Low-priced means a home’s sale price was in the bottom tercile of local sale prices, while mid-priced means it was in the middle tercile and high-priced means it was in the top tercile.
 United States
 Canada