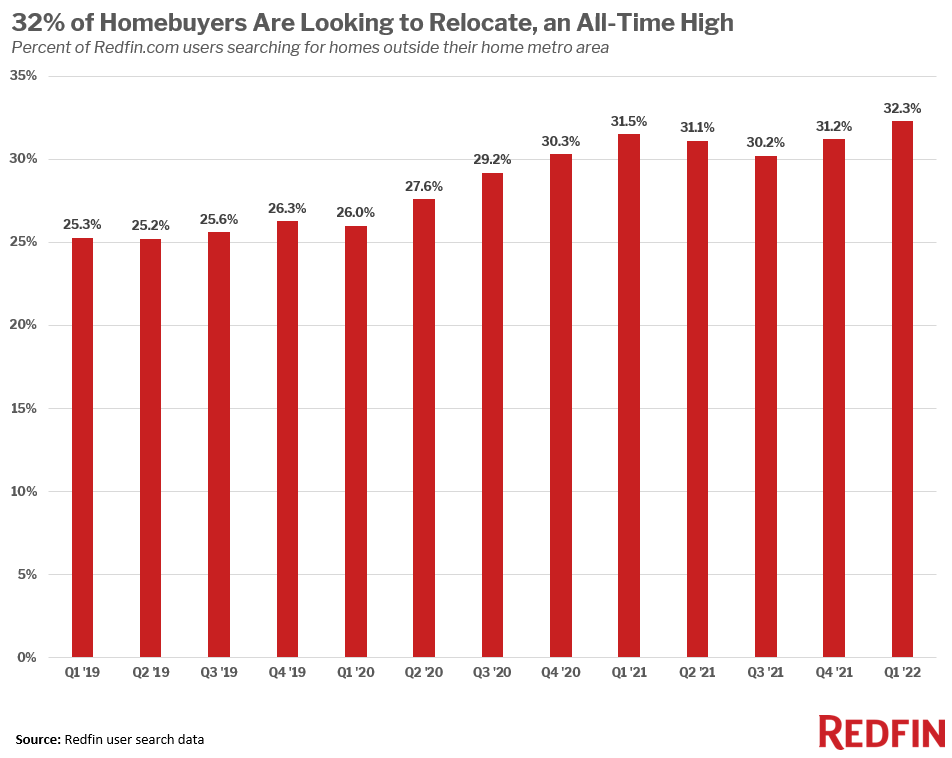
- Nearly one-third (32.3%) of Redfin.com users looked to move away from their hometown in the first quarter, an all-time high.
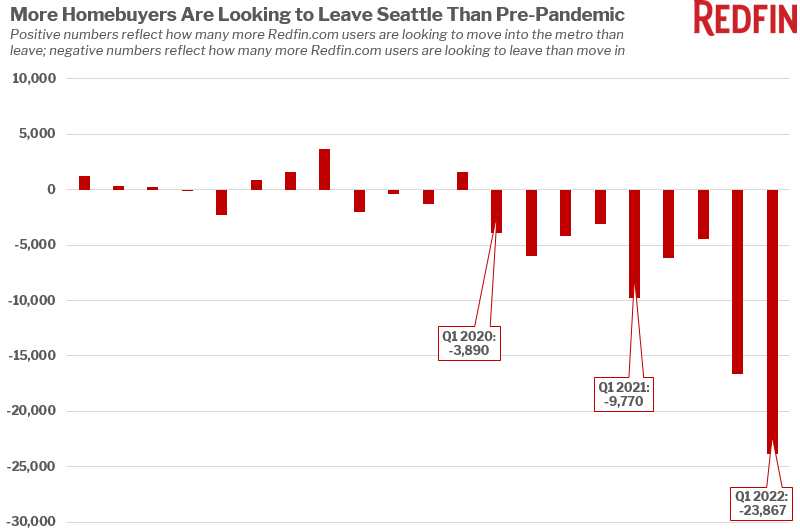
- The number of homebuyers leaving Seattle has increased sixfold since before the pandemic–largely due to remote work and soaring home prices–one factor in the early signs we’re seeing of a housing-market slowdown in Seattle and other pricey coastal metros.
- The number of homebuyers moving into Miami, the most popular migration destination, has risen just as quickly.
A record 32.3% of Redfin.com users nationwide looked to move to a different metro area in the first quarter. That’s up from 31.5% a year earlier and up significantly from 26% in 2019, before the pandemic.
Skyrocketing home prices and rising mortgage rates have made relocating to a more affordable area the only viable option for some prospective homebuyers.
Homebuyers are leaving Seattle at a much faster rate than before the pandemic
The number of homebuyers leaving the Seattle area has picked up significantly over the last two years, an apt example of how the pandemic is changing where people choose to live. The typical home in Seattle sold for $750,000 in February (up 15% year over year), making it the eighth-most expensive major metro in the U.S., behind only coastal California. Those soaring home prices, combined with a high concentration of tech jobs–which can typically be done remotely–have encouraged many Seattleites to seek more affordable, sunnier pastures.
At the same time, would-be homebuyers leaving Seattle is one reason why its housing market is showing early signs of cooling, with a slowdown in the number of buyers contacting Redfin agents in 2022 compared to last year and a year-over-year decline in mortgage applications.
Seattle had a net outflow of nearly 24,000 residents in the first quarter, up from about 10,000 a year earlier and about 4,000 two years earlier, before the pandemic began. Net outflow is a measure of how many more Redfin.com users looked to leave an area than move in.
Phoenix is the number-one destination for Redfin.com users leaving Seattle. While Phoenix home prices are up significantly from a year ago, the $456,000 median is still far lower than Seattle’s.
“I’ve worked with many home sellers recently who are moving to a completely new area,” said Seattle Redfin agent Nicole McCormick. “A lot of them are remote workers–or people who feel confident they’ll be able to get a new job–leaving for sunnier places where they can get more home for their money, like Phoenix or Sacramento. There’s also a pattern of selling and moving to the San Juan Islands, located a few hours away from Seattle. Those people are trading the city for a more rural, outdoorsy lifestyle–but homes are just as expensive.”
Seattle had the fifth-biggest outflow of any major U.S. metro in the first quarter, behind four other expensive coastal job centers: the Bay Area, Los Angeles, New York and Washington, D.C.
| Top 10 Metros by Net Outflow of Users and Their Top Destinations | |||||||
| Rank | Metro* | Net Outflow, Q1 2022† | Net Outflow, Q1 2021 | Portion of Local Users Searching Elsewhere, Q1 2022 | Portion of Local Users Searching Elsewhere, Q1 2021 | Top Destination | Top Out-of-State Destination
|
| 1 | San Francisco, CA | 52,964 | 40,736 | 23.7% | 23.9% | Sacramento, CA | Seattle, WA |
| 2 | Los Angeles, CA | 37,148 | 28,208 | 18.6% | 18.5% | San Diego, CA | Phoenix, AZ |
| 3 | New York, NY | 32,834 | 48,588 | 27.7% | 35.6% | Miami, FL | Miami, FL |
| 4 | Washington, DC | 25,409 | 16,626 | 16.7% | 14.7% | Salisbury, MD | Salisbury, MD |
| 5 | Seattle, WA | 23,867 | 9,813 | 18.6% | 16.3% | Phoenix, AZ | Phoenix, AZ |
| 6 | Boston, MA | 14,173 | 4,661 | 18.9% | 14.9% | Portland, ME | Portland, ME |
| 7 | Chicago, IL | 8,945 | 9,164 | 14.1% | 13.6% | Cape Coral, FL | Cape Coral, FL |
| 8 | Denver, CO | 5,155 | 8,448 | 27.9% | 30.6% | Chicago, IL | Chicago, IL |
| 9 | Minneapolis, MN | 2,967 | -619 | 25.4% | 20.8% | Chicago, IL | Chicago, IL |
| 10 | Portland, OR | 2,864 | -682 | 18.1% | 17.6% | Seattle, WA | Seattle, WA
|
| *Combined statistical areas with at least 500 users in Q1 2022
†Among the two million users sampled for this analysis only |
|||||||
Nearly six times more homebuyers looked to move to Miami in the first quarter than before the pandemic
Miami was the most popular migration destination in the first quarter, unchanged from the second half of 2021. Popularity is measured by net inflow, or how many more Redfin.com users looked to move into an area than leave. Phoenix, Tampa, Sacramento and Las Vegas round out the top five most popular migration destinations.
Sunny, relatively affordable areas are typically the most popular places for people to move to, a trend that has picked up with the pandemic. Net inflow into all five of the most popular destinations has increased significantly since before the pandemic.
The number of residents flowing into Miami in the first quarter was up nearly sixfold from two years earlier, and it has almost tripled in Tampa and almost doubled in Sacramento.
| Top 10 Metros by Net Inflow of Users and Their Top Origins | |||||||
| Rank | Metro* | Net Inflow, Q1 2022† | Net Inflow, Q1 2021 | Portion of Searches from Users Outside the Metro, Q1 2022 | Portion of Searches from Users Outside the Metro, Q1 2021 | Top Origin | Top Out-of-State Origin
|
| 1 | Miami, FL | 16,480 | 8,860 | 34.2% | 31.8% | New York, NY | New York, NY |
| 2 | Phoenix, AZ | 14,009 | 12,402 | 37.2% | 38.6% | Los Angeles, CA | Los Angeles, CA |
| 3 | Tampa, FL | 11,147 | 7,585 | 49.8% | 59.8% | Orlando, FL | New York, NY |
| 4 | Sacramento, CA | 9,541 | 8,440 | 42.1% | 47.8% | San Francisco, CA | Seattle, WA |
| 5 | Las Vegas, NV | 9,333 | 10,953 | 43.7% | 52.7% | Los Angeles, CA | Los Angeles, CA |
| 6 | Cape Coral, FL | 7,930 | 6,852 | 66.2% | 76.3% | Chicago, IL | Chicago, IL |
| 7 | North Port, FL | 7,402 | 5,183 | 66.1% | 79.7% | Chicago, IL | Chicago, IL |
| 8 | San Antonio, TX | 6,334 | 3,966 | 43.9% | 47.5% | Austin, TX | Los Angeles, CA |
| 9 | Dallas, TX | 6,115 | 9,174 | 25.5% | 32.8% | Los Angeles, CA | Los Angeles, CA |
| 10 | Atlanta, GA | 5,310 | 8,845 | 20.1% | 26.6% | New York, NY | New York, NY
|
| *Combined statistical areas with at least 500 users in Q1 2022
†Negative values indicate a net outflow; among the two million users sampled for this analysis only |
|||||||
Methodology
The latest migration analysis is based on a sample of about two million Redfin.com users who searched for homes across more than 100 metro areas in the first quarter, excluding searches unlikely to precede an actual relocation or home purchase. To be included in this dataset, a Redfin.com user must have viewed at least 10 homes in a particular metro area, and homes in that area must have made up at least 80% of the user’s searches. Redfin’s migration data goes back to 2017. We published January and February homebuyer migration data last month; the data in this report covers the entire first quarter (January, February and March).
 United States
 Canada