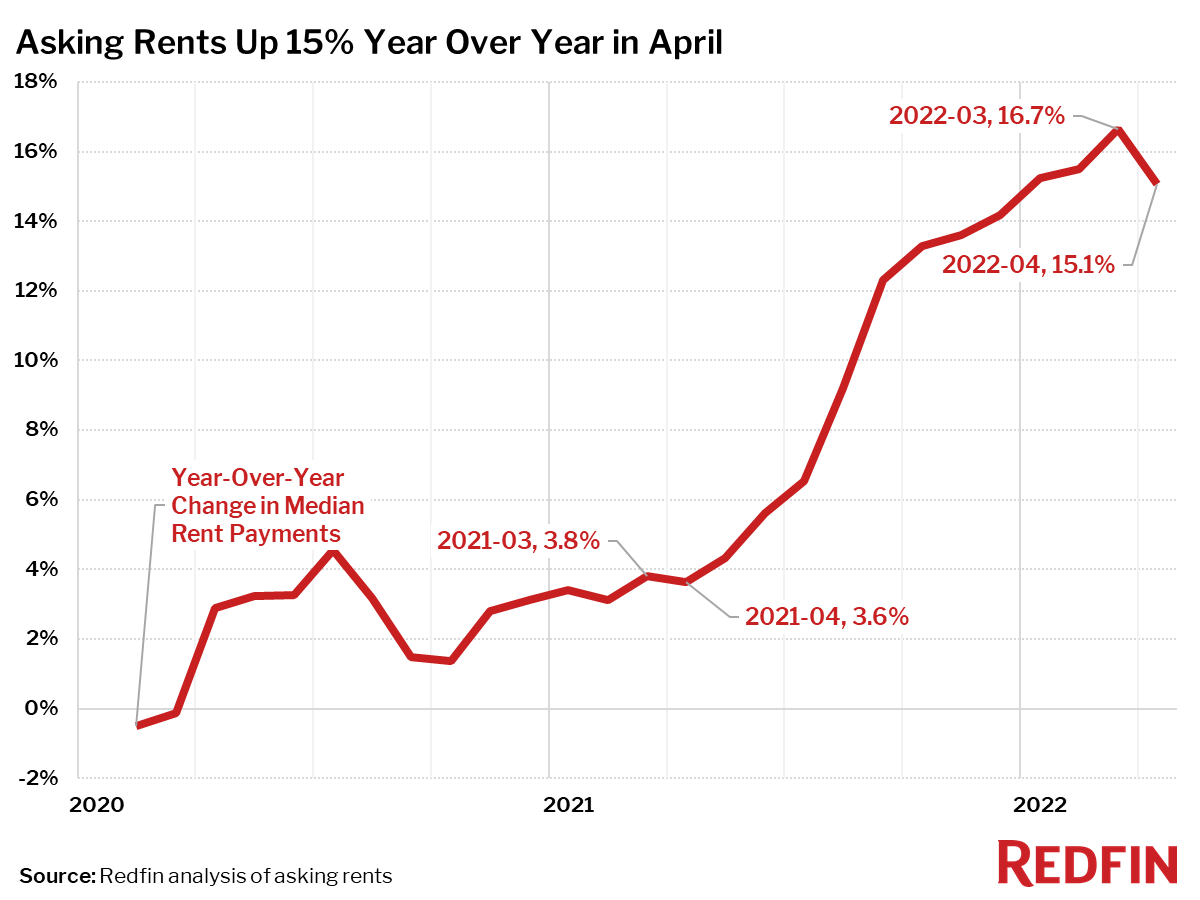
Rents rose 15% year over year in April, down from March’s 17% increase. Still, Austin, Portland and South Florida saw rents surge more than 30%.
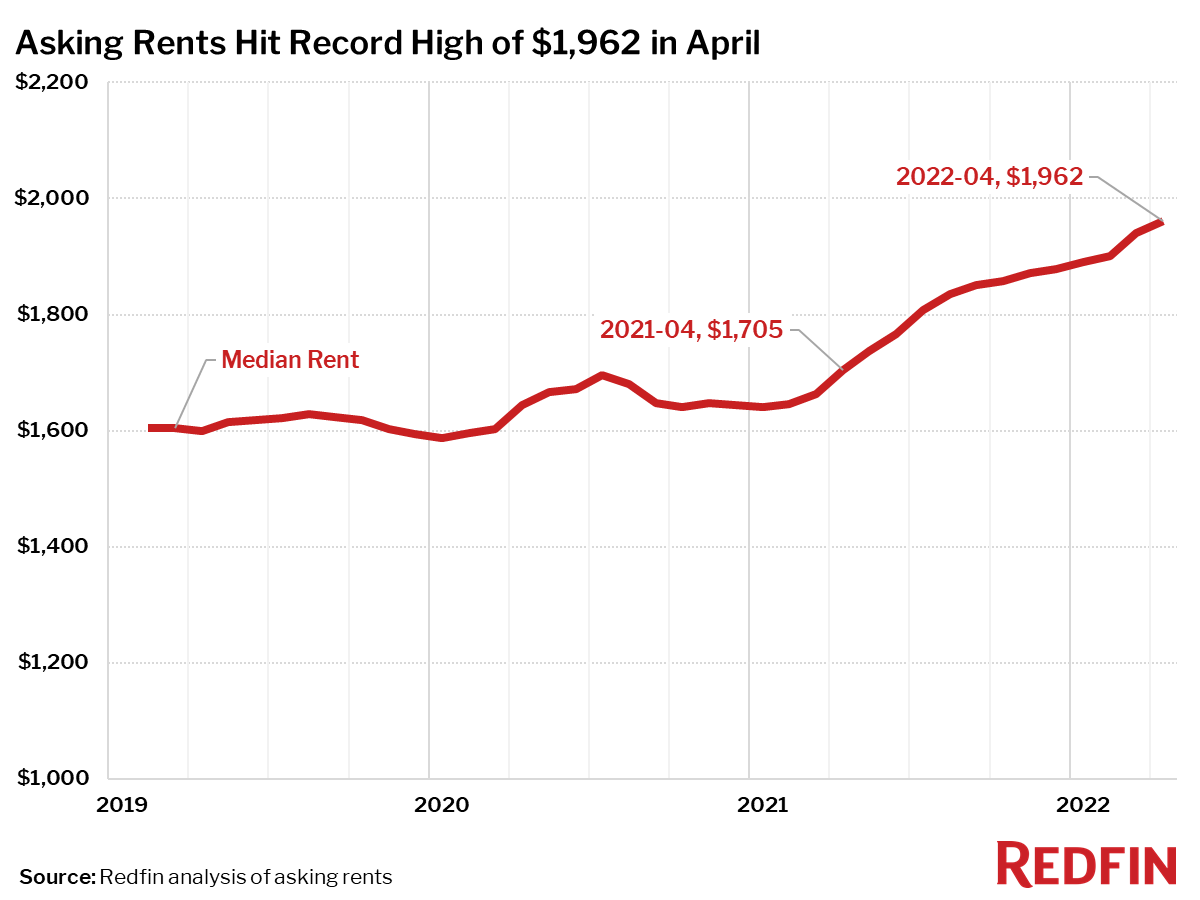
The median monthly asking rent in the U.S. increased 15% year over year to a record high of $1,962 in April. That’s below March’s 17% increase, marking the first slowdown in a year.
“The fact that rents are growing at a slower pace may be a very early sign that the Fed’s tactic of raising interest rates to quell inflation is working,” said Redfin Chief Economist Daryl Fairweather. “However, rents are still growing at nearly double the rate of overall inflation. Landlords in hot migration destinations like Austin, Portland and South Florida are charging new tenants 30% more than last year’s rent.”
| Rental Market Summary | April 2022 | Month-Over-Month | Year-Over-Year |
|---|---|---|---|
| Median Monthly Rent | $1,962 | 1.1% | 15.1% |
Austin Sees Rents Soar Nearly 50%—the Biggest Increase in the Country
Asking rents surged 46% year over year in Austin, TX—the largest increase on record in any metro area since at least the beginning of Redfin’s rental data in 2019. Portland, OR and south Florida also saw asking rents increase over 30% from a year earlier.
Top 10 Metro Areas With Fastest-Rising Rents Year Over Year
- Austin, TX (+46%)
- Portland, OR (+33%)
- Miami, FL (+31%)
- Fort Lauderdale, FL (+31%)
- West Palm Beach, FL (+31%)
- Seattle, WA (+31%)
- New York, NY (+28%)
- Newark, NJ (+28%)
- Nassau County, NY (+28%)
- New Brunswick, NJ (+28%)
Just three of the 50 most-populous metro areas saw rents fall in April from a year earlier. Rents declined 8% in Milwaukee, WI, 4% in Kansas City and 2% in Minneapolis. This was the first annual decline in Redfin’s data for Minneapolis.
Metro Areas Where Rents Declined Year Over Year
- Milwaukee, WI (-8%)
- Kansas City, MO (-4%)
- Minneapolis, MN (-2%)
Median Asking Rents, April 2022
| U.S. Metro Area | Median Asking Rent | Year-Over-Year Change in Median Asking Rent |
|---|---|---|
| Anaheim, CA | $3,381 | 10.8% |
| Atlanta, GA | $2,130 | 20.7% |
| Austin, TX | $2,531 | 45.9% |
| Baltimore, MD | $2,060 | 7.1% |
| Boston, MA | $3,780 | 15.1% |
| Charlotte, NC | $1,775 | 9.0% |
| Chicago, IL | $2,457 | 6.4% |
| Cincinnati, OH | $1,599 | 24.2% |
| Cleveland, OH | $1,411 | 6.6% |
| Columbus, OH | $1,577 | 10.5% |
| Dallas, TX | $2,149 | 24.0% |
| Denver, CO | $2,622 | 16.5% |
| Detroit, MI | $1,654 | 12.9% |
| Fort Lauderdale, FL | $3,117 | 30.6% |
| Fort Worth, TX | $2,149 | 24.0% |
| Houston, TX | $1,766 | 12.1% |
| Indianapolis, IN | $1,428 | 17.3% |
| Jacksonville, FL | $1,647 | 20.2% |
| Kansas City, MO | $1,456 | -3.5% |
| Las Vegas, NV | $1,826 | 17.2% |
| Los Angeles, CA | $3,381 | 10.8% |
| Miami, FL | $3,117 | 30.6% |
| Milwaukee, WI | $1,654 | -8.2% |
| Minneapolis, MN | $1,773 | -1.8% |
| Montgomery County, PA | $2,331 | 10.6% |
| Nashville, TN | $2,038 | 26.4% |
| Nassau County, NY | $3,925 | 28.0% |
| New Brunswick, NJ | $3,925 | 28.0% |
| New York, NY | $3,925 | 28.0% |
| Newark, NJ | $3,925 | 28.0% |
| Oakland, CA | $3,698 | 15.9% |
| Orlando, FL | $2,170 | 26.9% |
| Philadelphia, PA | $2,331 | 10.6% |
| Phoenix, AZ | $2,245 | 22.7% |
| Pittsburgh, PA | $1,891 | 18.8% |
| Portland, OR | $2,491 | 33.1% |
| Providence, RI | $2,223 | 3.7% |
| Riverside, CA | $2,657 | 7.9% |
| Sacramento, CA | $2,740 | 14.9% |
| San Antonio, TX | $1,457 | 14.9% |
| San Diego, CA | $3,305 | 17.9% |
| San Francisco, CA | $3,698 | 15.9% |
| San Jose, CA | $3,503 | 14.6% |
| Seattle, WA | $2,933 | 30.6% |
| St. Louis, MO | $1,566 | 6.3% |
| Tampa, FL | $2,183 | 23.6% |
| Virginia Beach, VA | $1,692 | 16.9% |
| Warren, MI | $1,654 | 12.9% |
| Washington, DC | $2,614 | 10.3% |
| West Palm Beach, FL | $3,117 | 30.6% |
| National | $1,962 | 15.1% |
Methodology
Redfin analyzed rent prices from RentPath across the 50 largest metro areas in the U.S. This analysis uses data from more than 20,000 apartment buildings across the country.
It is important to note that the prices in this report reflect the current costs of new leases and new mortgages during each time period. In other words, the amount shown as the median rent is not the median of what all renters are paying, but the median cost of apartments that were available for new renters during the report month. Currently, Redfin’s data from RentPath includes only median rent at the metro level. Future reports compare median rent prices at a more granular geographic level.
 United States
 Canada