The median asking rent fell 0.4% in March to the lowest level in 13 months. Austin and Chicago saw the largest declines, while Raleigh and Cleveland experienced the biggest gains.
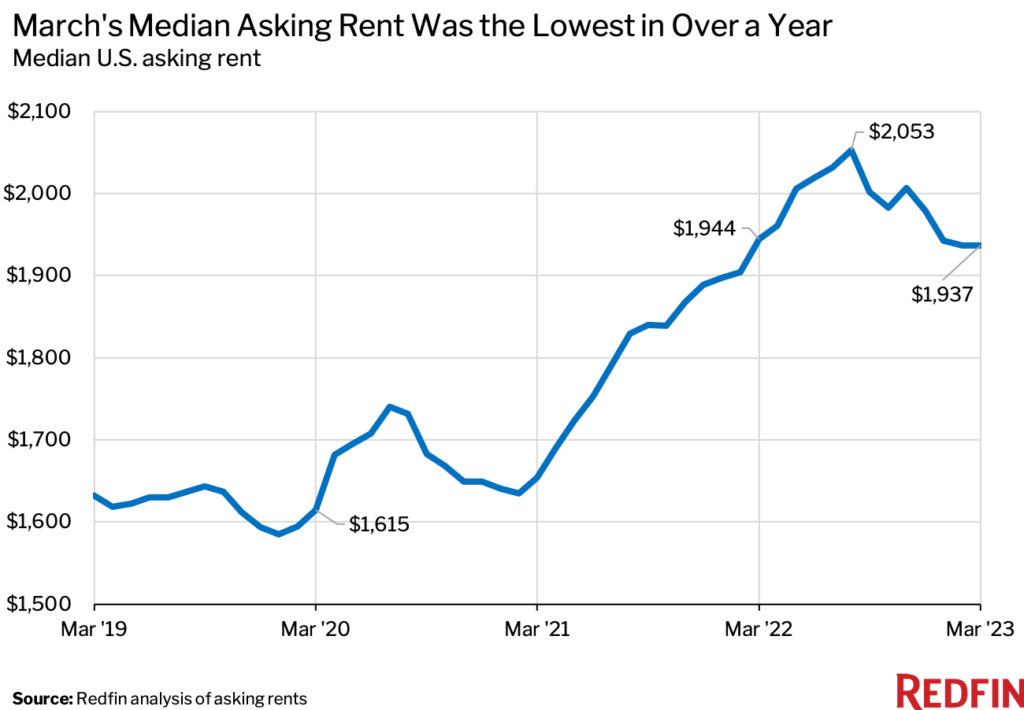
The median U.S. asking rent fell 0.4% year over year to $1,937 in March. That’s the first annual decline since March 2020—when the coronavirus was declared a pandemic—and the lowest median asking rent in 13 months. By comparison, rents were up 17.5% one year earlier, in March 2022.
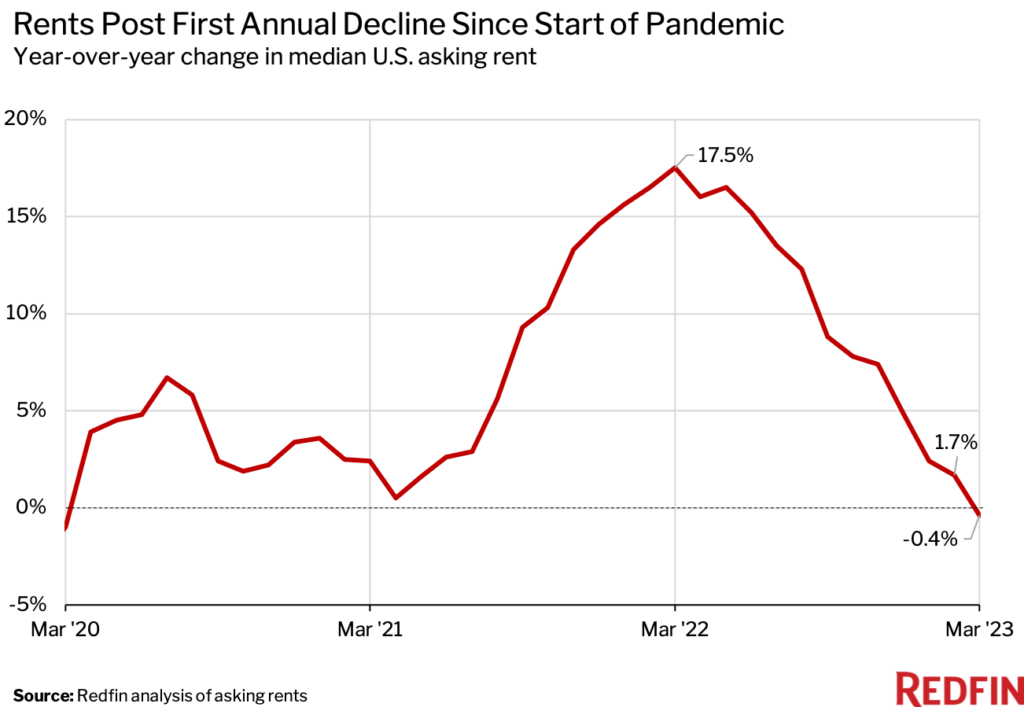
The median asking rent in March was unchanged from February. It remained $322 higher (19.9%) than it was at the onset of the pandemic three years earlier, though wages increased at roughly the same pace during this time.
“Rents are falling, but it feels more like they’re just returning to normal, which is healthy to some degree,” said Dan Close, a Redfin real estate agent in Chicago, where the median asking rent in March was 9.2% lower than it was a year earlier. “It’s similar to the cost of eggs. You can say egg prices are plummeting, but what’s really happening is they’re finally making their way back to the $3 norm instead of $5 or $6. Rents ballooned during the pandemic, and are now returning to earth.”
Rents surged during the past two years because incomes increased and household formation rose as more millennials started families. But household formation is now slowing, partly because many people are opting to stay put rather than move during a time of economic uncertainty.
Rents Drop Due to Supply Glut, Inflation, Economic Uncertainty
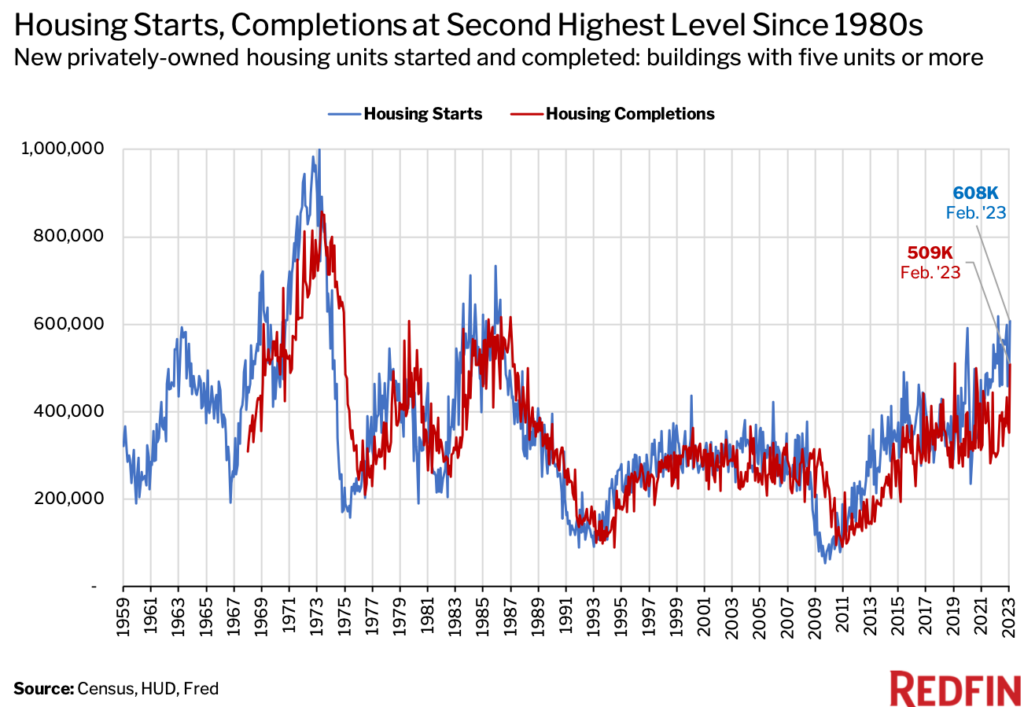
Rents declined from a year earlier in March largely due to a surplus of supply resulting from the pandemic homebuilding boom.
The number of multifamily units that went under construction and the number completed each rose to the second highest level in more than three decades in February, the latest month for which data is available. Completed residential projects in buildings with five or more units jumped 72% year over year on a seasonally-adjusted basis to 509,000, the highest level since 1987 with the exception of February 2019. Started projects in buildings with five or more units rose 14.3% to 608,000, the highest level since 1986 with the exception of April 2022.
The short-term rental market is in a similar situation. The Airbnb market is oversaturated with supply and authorities are imposing tougher restrictions on hosts in some areas, driving some owners to lower rents or sell, according to Redfin agents.
The overall rental market is also cooling because still-high rental costs, inflation, rising unemployment and recession fears are causing rental demand to ease. Rental vacancies are on the rise, prompting some landlords to cut rents and/or offer concessions like discounted parking.
Rents Declined in 13 Major Metro Areas
- Austin, TX (-11%)
- Chicago, IL (-9.2%)
- New Orleans, LA (-3%)
- Birmingham, AL (-2.9%)
- Cincinnati, OH (-2.9%)
- Sacramento, CA (-2.8%)
- Las Vegas, NV (-2.4%)
- Atlanta, GA (-2.3%)
- Phoenix, AZ (-2.1%)
- Baltimore, MD (-2%)
- Minneapolis, MN (-1.6%)
- Houston, TX (-1.5%)
- San Antonio, TX (-1.3%)
“A lot of people in Chicago became landlords during the pandemic,” Close said. “Some were looking to cash in on soaring rents. Some rented out their homes because selling would’ve meant giving up their rock-bottom mortgage rate. Others tried to sell but didn’t get a satisfactory offer due to slowing homebuyer demand. Now we have a lot of rental supply, which is bringing prices down because renters have more options.”
Raleigh, Cleveland Saw Largest Rent Increases
- Raleigh, NC (16.6%)
- Cleveland, OH (15.3%)
- Charlotte, NC (13%)
- Indianapolis, IN (10.5%)
- Nashville, TN (9.6%)
- Columbus, OH (9.4%)
- Kansas City, MO (8.1%)
- Riverside, CA (7.2%)
- Denver, CO (7%)
- St. Louis, MO (4.2%)
Three factors have driven up rents in Nashville, according to local Redfin real estate agent Jennifer Bowers: investors, high home prices and a strong local job market.
“Tons of investors bought homes in Nashville and turned them into rentals during the pandemic in order to take advantage of low mortgage rates and rising rental demand—which allowed them to jack up rents. While investors have since pumped the brakes on purchases, they haven’t cut rents, ” Bowers said. “Demand for rentals rose in part because skyrocketing housing prices pushed homeownership out of reach for many families. Elevated mortgage rates over the last year-and-a-half have also priced buyers out.”
The average 30-year-fixed mortgage rate is now 6.27%, down from a fall peak of 7.08% but up from 5% in April 2022, which has sent the typical homebuyer’s monthly payment up by nearly $300 from a year ago. While home prices have started falling on a year-over-year basis, they remain more than 30% higher than they were when the pandemic started.
Median Asking Rents: March 2023
| U.S. Metro Area | Median Asking Rent | Year-Over-Year Change in Median Asking Rent |
| Atlanta, GA | $2,055 | -2.3% |
| Austin, TX | $2,104 | -11.0% |
| Baltimore, MD | $1,983 | -2.0% |
| Birmingham, AL | $1,590 | -2.9% |
| Boston, MA | $3,839 | 3.3% |
| Buffalo, NY | $1,637 | 1.3% |
| Charlotte, NC | $1,969 | 13.0% |
| Chicago, IL | $2,206 | -9.2% |
| Cincinnati, OH | $1,564 | -2.9% |
| Cleveland, OH | $1,530 | 15.3% |
| Columbus, OH | $1,618 | 9.4% |
| Dallas, TX | $2,133 | 1.0% |
| Denver, CO | $2,797 | 7.0% |
| Detroit, MI | $1,643 | 2.0% |
| Hartford, CT | $2,031 | 2.0% |
| Houston, TX | $1,723 | -1.5% |
| Indianapolis, IN | $1,539 | 10.5% |
| Jacksonville, FL | $1,633 | 1.7% |
| Kansas City, MO | $1,558 | 8.1% |
| Las Vegas, NV | $1,759 | -2.4% |
| Los Angeles, CA | $3,412 | 1.4% |
| Louisville/Jefferson County, KY | $1,378 | 0.3% |
| Memphis, TN | $1,618 | 2.7% |
| Miami, FL | $3,074 | 0.7% |
| Milwaukee, WI | $1,724 | 4.1% |
| Minneapolis, MN | $1,758 | -1.6% |
| Nashville, TN | $2,160 | 9.6% |
| New Orleans, LA | $1,792 | -3.0% |
| New York, NY | $4,022 | 2.9% |
| Orlando, FL | $2,128 | 2.0% |
| Philadelphia, PA | $2,333 | 1.3% |
| Phoenix, AZ | $2,088 | -2.1% |
| Pittsburgh, PA | $1,873 | 2.1% |
| Portland, OR | $2,479 | 0.3% |
| Providence, RI | $2,361 | 3.5% |
| Raleigh, NC | $2,080 | 16.6% |
| Richmond, VA | $1,749 | 0.5% |
| Riverside, CA | $2,801 | 7.2% |
| Sacramento, CA | $2,625 | -2.8% |
| Salt Lake City, UT | $1,891 | 2.1% |
| San Antonio, TX | $1,435 | -1.3% |
| San Diego, CA | $3,410 | 2.0% |
| San Francisco, CA | $3,716 | 2.6% |
| San Jose, CA | $3,609 | 3.2% |
| Seattle, WA | $2,861 | 0.7% |
| St. Louis, MO | $1,552 | 4.2% |
| Tampa, FL | $2,222 | 3.9% |
| Virginia Beach, VA | $1,703 | 0.5% |
| Washington, D.C. | $2,628 | 1.1% |
Methodology
Redfin’s national rent figure represents a weighted average of median rents across the 50 most populous U.S. cities, weighted by number of rental listings. We analyzed rent prices from Rent. For the metro-level section of this report, we analyzed rents across the 50 most populous U.S. metro areas. The Oklahoma City, OK metro is excluded from the metro section as we investigate the data to ensure accuracy.
Prices reflect the current costs of new leases during each time period. In other words, the amount shown as the median rent is not the median of what all renters are paying, but the median asking price of apartments that were available for new renters during the report month.
 United States
 Canada