Despite the fact that the coronavirus-driven recession disproportionately impacted women in 2020, single women purchased 9% more homes in the fourth quarter than a year ago, compared with a 4.5% uptick for single men.
Single women purchased 8.7% more homes in the fourth quarter of 2020 than a year earlier. That’s a larger increase than single men, who purchased 4.6% more homes in the fourth quarter than a year earlier. Couples bought 11.5% more homes than a year earlier.
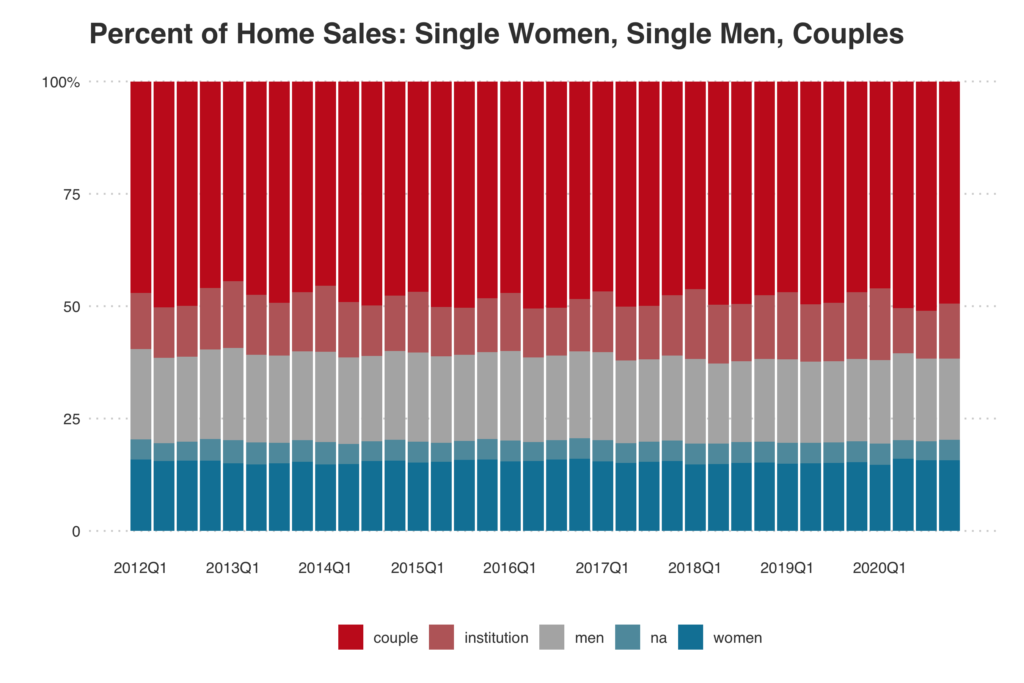
Single women made up 15.7% of total home purchases nationwide in the fourth quarter of 2020, compared with 15.3% a year earlier. The share has remained stable between 14.8% and 16.1% over the past eight years.
Single women bought more homes at the end of 2020 than the year before and the share of home purchases by single women held steady throughout throughout the year, even as the pandemic-driven recession forced women out of the workforce at a greater rate than men, especially women of color. Even before the pandemic, women earned just 82 cents for every dollar earned by men. The recession hit women-dominated industries—including restaurants, retail and healthcare—hardest, and many women have chosen to leave paying jobs to take care of children.
“This is another illustration of America’s uneven financial recovery,” said Redfin Chief Economist Daryl Fairweather. “While millions of women have lost their jobs during this recession, the impact has largely been on lower-income women. Meanwhile, most women who were able to afford homes before the pandemic are likely still able to afford homes, and low mortgage rates—especially at the end of 2020—have been incentivizing them to buy.”
Single men made up 18.1% of home purchases in the fourth quarter, essentially flat from 18.3% a year earlier. The share of home purchases by single men also hasn’t varied much since 2012, spanning from 17.8% to 20.1%.
Couples—two (or more) people buying a home together—made up 49.4% of purchases in the fourth quarter, up slightly from 46.9% the year before.
The remainder of home purchases were either made by institutions or they fall into the “other” category.
“I was originally saving for a down payment with a goal of buying my own home in 2021, but interest rates dropped so much with the pandemic that I was able to buy a condo over the summer,” said Sarah Stecker, who bought a two-bedroom condo in Los Angeles in July. “The down payment was the biggest hurdle, but now my monthly mortgage, including HOA fees and property taxes, is just slightly more than I was paying in rent on an apartment in the same neighborhood, and my condo is twice the size. Now, instead of paying my landlord’s mortgage, I’m building equity for my own bank account. I hope to eventually use some of the equity to buy a bigger home for myself and hold onto the condo as a rental property.”
Women tend to buy less expensive homes than men. The typical home purchased by single women in the fourth quarter sold for $294,000, up 15% year over year. That’s compared with $310,000 for single men, up 17% year over year, and $430,000 for couples, up 15%. The median monthly mortgage payment for single women was $1,052 in the fourth quarter, compared with $1,125 for single men and $1,535 for couples.
Single women made up more than one-quarter of home purchases in Boston in 2020
Single women make up a larger share of homebuyers than single men in just two of the 43 metro areas included in this analysis. In Boston, single women made up 25.4% of home purchases in 2020, compared with 23.3% for single men. And in West Palm Beach, single women made up 16.8% of home purchases, versus 15.6% for single men.
Boston also had the highest share of home purchases by single women last year of any metro. Forty-seven percent of women in Boston have a college degree or higher, the fourth-highest share of any major metro in the U.S., behind San Francisco, San Jose and Washington, D.C. Boston also has a lot of well-paying jobs that tend to be dominated by women, such as higher education and healthcare.
Boston is followed by Providence—located just about 50 miles away from Boston—where single women made up 21.2% of home purchases in 2020. Next come Detroit (20.6%), Atlanta (19.4%), Cleveland (18.9%) and Philadelphia (18.9%). The median sale price of homes purchased by single women in 2020 was less than $400,000 in all six of those metros, and it was under $200,000 in Detroit and Cleveland.
On the other end of the spectrum, single women made up just 6.3% of home purchases in San Jose in 2020, a lower share than any other metro. Next come a handful of other expensive California and New York metros: San Francisco (8%), Anaheim (10.3%), Oakland (10.6%), New York, San Diego and Nassau County, NY (11.2% apiece).
Share of homes purchased by single women by metro area, 2020
| Redfin metro | Percent of home purchases by single women | Homes purchased by single women, YoY | Percent of home purchases by single men | Homes purchased by single men, YoY | Median monthly mortgage payment (women) | Median sale price (women) |
|---|---|---|---|---|---|---|
| Boston, MA | 25.4% | -1.7% | 23.3% | 6.1% | $1,256 | $384,900 |
| Providence, RI | 21.2% | 0.4% | 26.1% | -2.1% | $1,007 | $270,000 |
| Detroit, MI | 20.6% | -30.1% | 28.3% | -30% | $564 | $140,000 |
| Warren, MI | 19.6% | -5.6% | 27.8% | -8.5% | $704 | $185,000 |
| Atlanta, GA | 19.4% | 0.0% | 23% | -2.5% | $911 | $233,000 |
| Cleveland, OH | 18.9% | -17.4% | 23% | -12.3% | $554 | $144,000 |
| Philadelphia, PA | 18.9% | -9.1% | 20.5% | -8.8% | $824 | $209,900 |
| St. Louis, MO | 18.6% | -45.3% | 23.4% | -35.7% | $494 | $127,000 |
| Milwaukee, WI | 18.0% | 3.3% | 21.7% | 2.9% | $717 | $195,000 |
| Chicago, IL | 18.0% | -6.8% | 21% | -11.2% | $836 | $220,000 |
| Minneapolis, MN | 17.6% | 1.9% | 19.5% | 1.6% | $935 | $249,900 |
| Virginia Beach, VA | 17.6% | 15.7% | 24.2% | 16% | $901 | $225,000 |
| Baltimore, MD | 17.1% | -15.4% | 18.9% | -13.1% | $1,014 | $260,000 |
| Cincinnati, OH | 17.0% | -16.0% | 20.4% | -7% | $624 | $160,000 |
| West Palm Beach, FL | 16.8% | -3.7% | 15.6% | -3.5% | $938 | $240,000 |
| Tampa, FL | 16.7% | 0.8% | 17% | 2.8% | $819 | $208,000 |
| Phoenix, AZ | 16.6% | -5.8% | 24.8% | -10.1% | $1,051 | $285,000 |
| Las Vegas, NV | 16.6% | 2.4% | 21.7% | -3.8% | $1,063 | $280,000 |
| Pittsburgh, PA | 16.5% | -41.8% | 21.7% | -43.3% | $588 | $153,000 |
| Washington, DC | 16.5% | 1.5% | 17.2% | -2.8% | $1,401 | $365,000 |
| Columbus, OH | 16.3% | -8.4% | 18.1% | -8.7% | $710 | $191,500 |
| Fort Lauderdale, FL | 15.8% | -0.3% | 16.5% | -2% | $978 | $238,000 |
| New Brunswick, NJ | 15.6% | 7.7% | 16.9% | 3.6% | $1,054 | $285,000 |
| Denver, CO | 15.6% | -0.7% | 19.1% | -3.1% | $1,360 | $385,000 |
| Nashville, TN | 15.5% | -5.7% | 17.5% | -5.1% | $1,002 | $265,000 |
| Charlotte, NC | 15.0% | 3.6% | 15.1% | 2.5% | $868 | $227,500 |
| Sacramento, CA | 14.9% | 2.1% | 15.8% | 2.3% | $1,411 | $396,000 |
| Jacksonville, FL | 14.7% | -9.5% | 15.2% | -4.5% | $819 | $215,000 |
| Portland, OR | 14.4% | -16.6% | 15.9% | -13% | $1,382 | $381,177 |
| Orlando, FL | 14.0% | 2.1% | 20.5% | -4.9% | $914 | $236,000 |
| Montgomery County, PA | 13.9% | -10.0% | 15.6% | -12.1% | $1,021 | $280,000 |
| Newark, NJ | 13.0% | 3.1% | 16.8% | 0.8% | $1,194 | $320,000 |
| Riverside, CA | 13.0% | -2.0% | 19.3% | -2.4% | $1,329 | $358,000 |
| Los Angeles, CA | 12.5% | 0.0% | 15.4% | -7% | $2,014 | $585,000 |
| Seattle, WA | 11.5% | -20.4% | 13% | -20.9% | $1,699 | $492,000 |
| Miami, FL | 11.3% | -2.3% | 15.2% | 2.2% | $1,105 | $287,000 |
| Nassau County, NY | 11.2% | -10.7% | 14.1% | -11.6% | $1,643 | $449,998 |
| San Diego, CA | 11.2% | 3.5% | 15.7% | 7.8% | $1,807 | $520,000 |
| New York, NY | 11.2% | -9.7% | 14.5% | -9.6% | $1,682 | $485,000 |
| Oakland, CA | 10.6% | -4.0% | 11% | -14% | $2,062 | $600,000 |
| Anaheim, CA | 10.3% | -1.1% | 12.1% | 0.3% | $1,997 | $625,000 |
| San Francisco, CA | 8.0% | -9.0% | 10.5% | -14.9% | $3,128 | $1,070,000 |
| San Jose, CA | 6.3% | 2.8% | 8.8% | 2.2% | $2,510 | $819,500 |
Methodology
For this analysis, we looked at county sale records for homes purchased from January 2012 to December 2020. We classified institutional buyers using ownership codes in the county records as well as key words “LLC”, “INC”, “TRUST”, “CORP” and “HOMES.” We then separated out buyers with more than one joint buyer and classified that group as “couple” purchases. These can be more than two buyers, irrespective of gender. For the sample with a single buyer, we examined the first names using the gender package in R, which computes the proportion a name was male or female using a historical database from the U.S. Social Security Administration.
We understand the limitations in the gender data. Gender is not a binary construct and this data does not represent nonbinary individuals who may identify as genderfluid, agender, genderqueer, or gender nonconforming.
We assume the homebuyer was born between 1960 and 2000. We only assigned a gender to the name if more than 80% of the name’s usage was for one particular gender. The remainder of the home sales were categorized as “n/a” if they didn’t fall under any of the above classifications. Those make up roughly 5% of total home sales.
 United States
 Canada