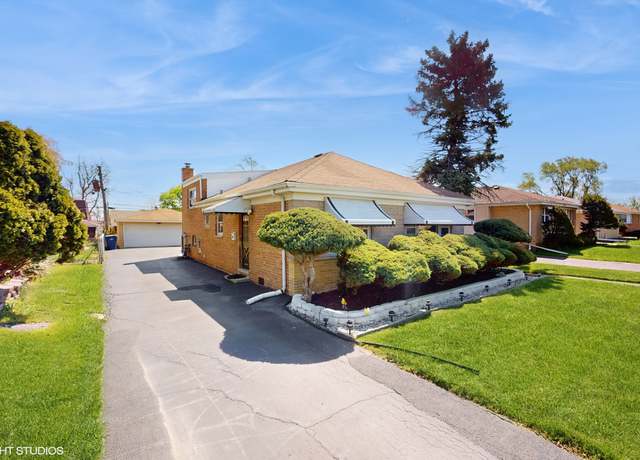
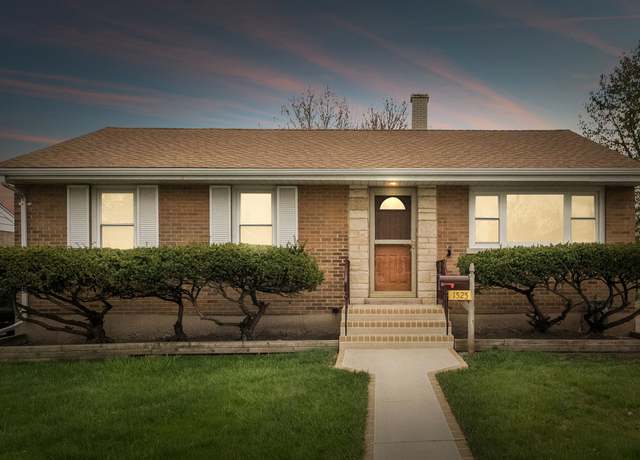
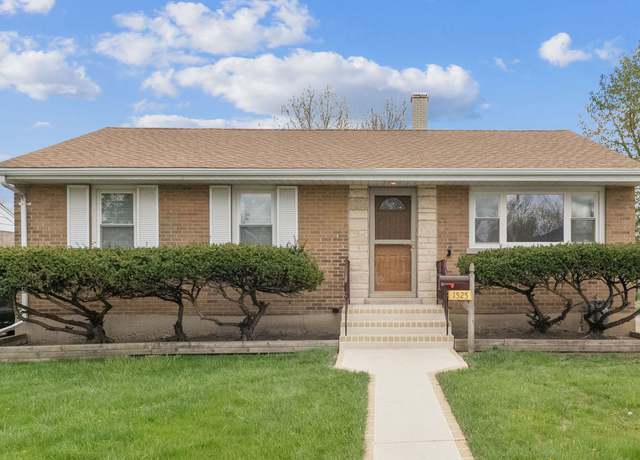
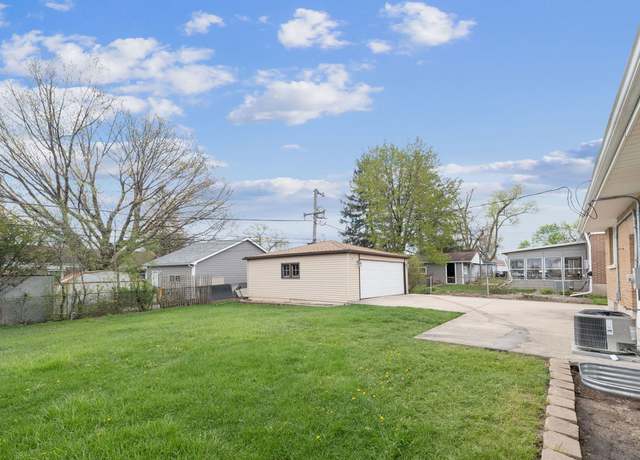
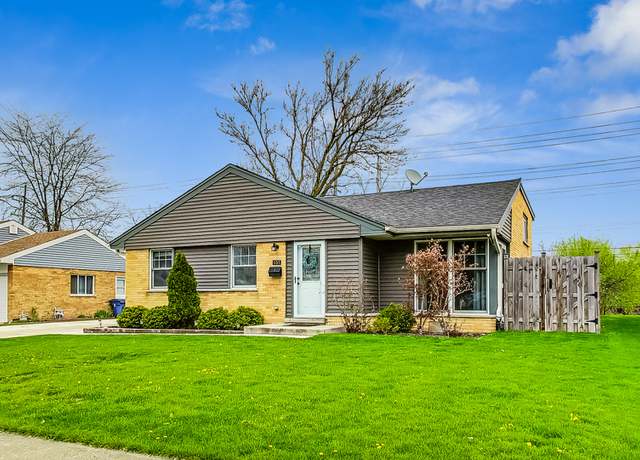
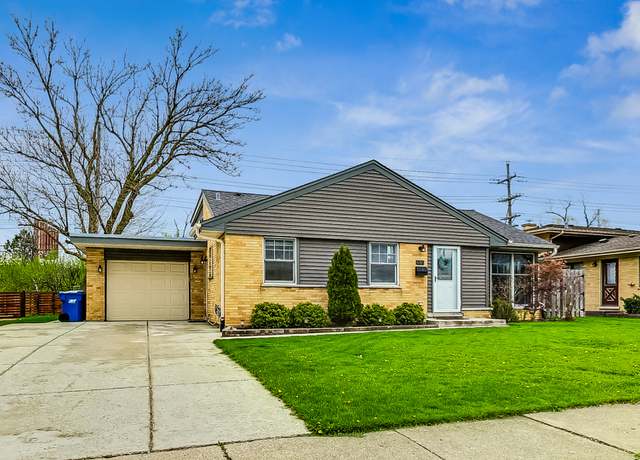
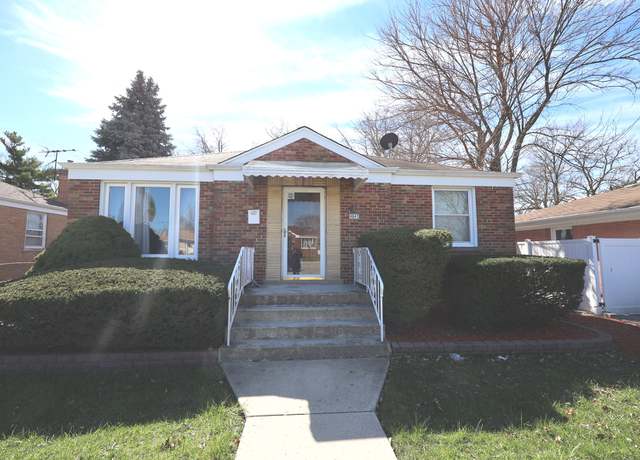
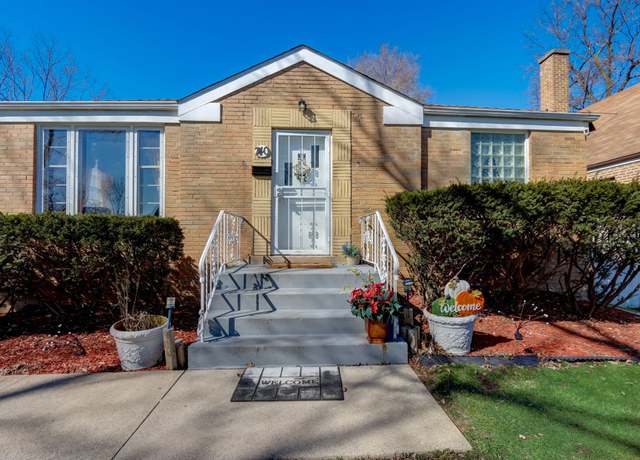
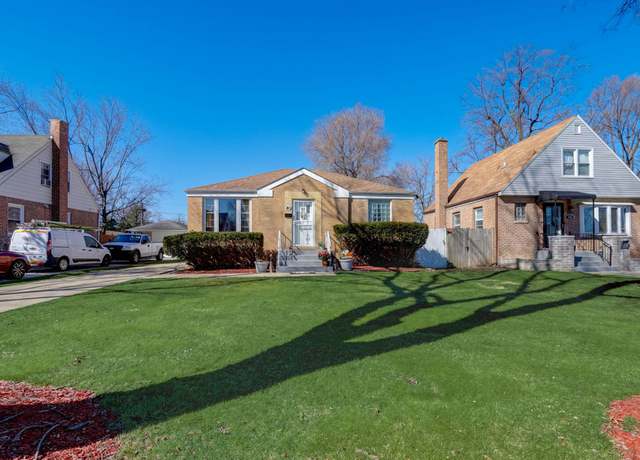
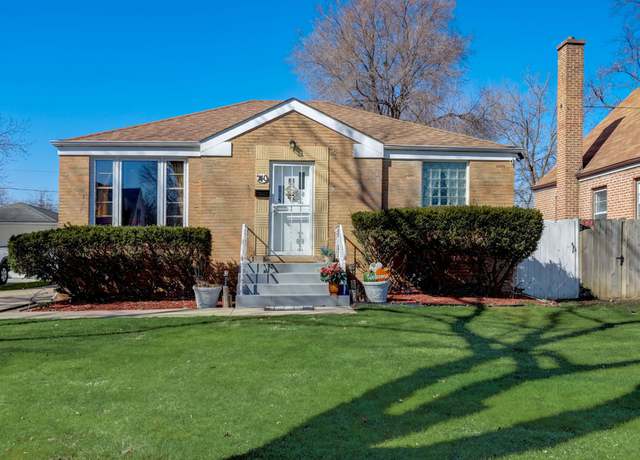
DON'T MISS OUT ON THIS WELL KEPT HOME INSIDE AND OUT, THAT IS MOVE IN READY. UPDATES INCLUDE FURNANCE 2020, CONCRETE PATIO 2023, 2 BEDRM WINDOWS & CARPET 2023, OVEN/RANGE 2023, KITCHECN GRANITE COUNTER TOP, LOWER LEVEL OFFERS FAMILY ROOM, 1/2 BATH, UTILITY ROOM AND WALK OUT TO FENCHED YARD. HARDWOOD FLOORS UNDER CARPET IN BEDRMS AND LIVING ROOMS. THIS GREAT HOME IS SITUATED IN A PRIME LOCATION, ONLY BLOCKS FROM EXPRESSWAY, TRAIN AND SHOPPING. HURRY, DON'T MISS THIS ONE.
Welcome to Elmhurst, a location, lifestyle, and house you will love. This Elmhurst split-level has all your must-haves and wants. 481 East Park is warm and inviting from the moment you arrive. Enjoy curb appeal, an oversized driveway, and an attached 1-car garage, but not a regular garage, a, "cool. " garage with storage, wainscoting, extra lights! Perfect man cave, home gym or craft center. From the moment you walk in, you're greeted by beautiful hardwood floors, natural light, and an open-concept kitchen. If it's formal dining you're seeking or a casual space to host girls' night, this kitchen and dining setup is just what you wanted. A breakfast bar to display all the snacks fo
Welcome to your new home at 206 S Roberta Ave in the charming Northlake neighborhood. This lovely property boasts 3 bedrooms, 1 bathroom, a 2-car garage, and a huge yard that is perfect for outdoor activities and entertaining. As you step inside, you'll be greeted by a newly renovated kitchen that is sure to impress. With modern appliances, sleek countertops, and plenty of storage space, this kitchen is perfect for preparing delicious meals and hosting guests. The living room is spacious and inviting, with plenty of natural light and ample space for relaxing with your family or hosting gatherings. The bedrooms are cozy and comfortable, with plenty of closet space for storage. The bathroom i
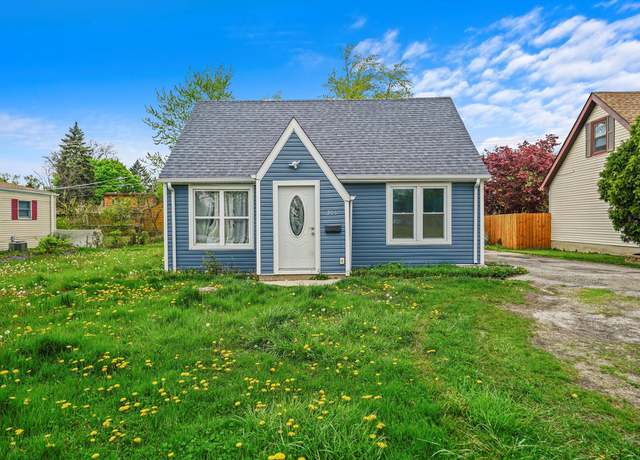
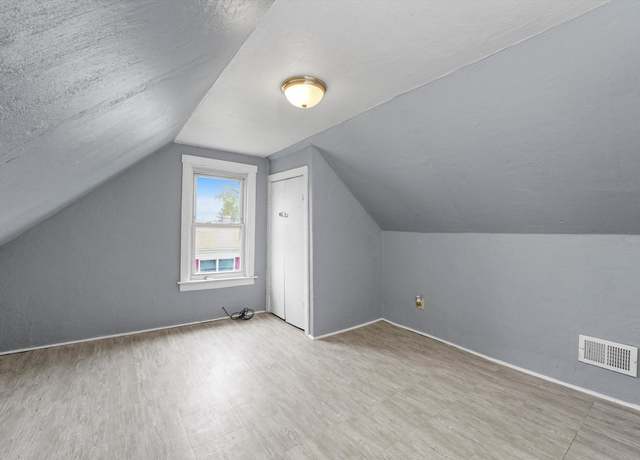
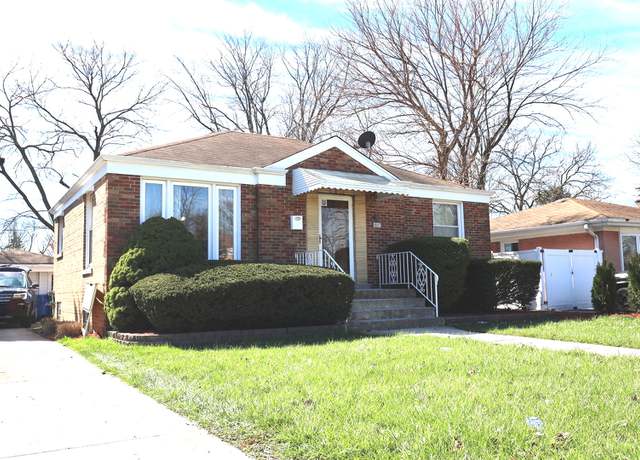
Spacious 4 Bedroom Brick Cape Cod Home. Brand New Eat In Kitchen With French Doors Leading To Yard And Walk In Pantry. 2 Spacious Second Floor Bedrooms With Full Bathroom. Full Finish Basement With Ample Storage. Fenced Yard
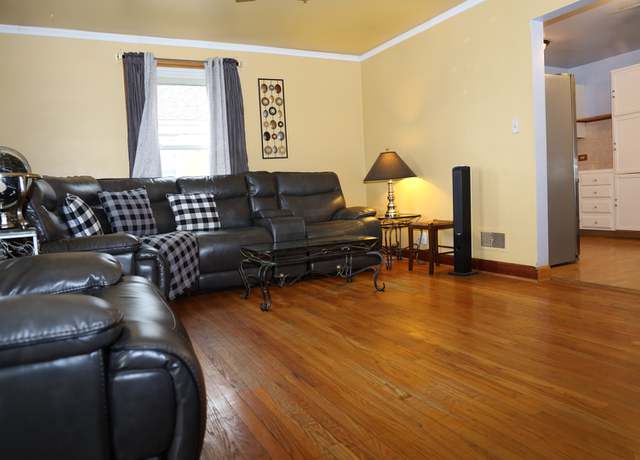
YOU WILL FALL IN LOVE WITH THIS RECENTLY UPDATED 4 BDRM 2 BATH HOME LOCATED IN HILLSIDE. THIS HOME FEATURES A NICE OPEN SPACE CONCEPT IN THE KITCHEN THAT LEADS TO THE FAMILY ROOM. WALK OUT FROM THE FAMILY ROOM AND ENJOY THE LARGE DECK FOR GREAT ENTERTAINING AND RELAXATION, A SPACIOUS LIVING ROOM, BONUS ROOM FOR STORAGE/PLAYROOM, A BEAUTIFUL MASSIVE YARD, LOTS OF EXTERIOR STORAGE SPACE, A WONDERFUL 3 CAR GARAGE, LARGE DRIVEWAY, SPACIOUS LOT, CLOSE TO SHOPPING, PARK AND EXPRESSWAYS.
$329,900
4 beds2 baths1,444 sq ft
527 Clayton Rd, Hillside, IL 60162
Based on information submitted to the MLS GRID as of Sun Apr 28 2024. All data is obtained from various sources and may not have been verified by broker or MLS GRID. Supplied Open House Information is subject to change without notice. All information should be independently reviewed and verified for accuracy. Properties may or may not be listed by the office/agent presenting the information.
School data is provided by GreatSchools, a nonprofit organization. Redfin recommends buyers and renters use GreatSchools information and ratings as a first step, and conduct their own investigation to determine their desired schools or school districts, including by contacting and visiting the schools themselves.Redfin does not endorse or guarantee this information. School service boundaries are intended to be used as a reference only; they may change and are not guaranteed to be accurate. To verify school enrollment eligibility, contact the school district directly.
Berkeley, Illinois, offers a variety of transportation options for its residents. The town is well-connected with roads and often experiences moderate traffic levels, making driving by car a common way to travel. Public transportation is available, providing another convenient option for commuting. Additionally, Berkeley is conveniently located near several major highways and freeways, facilitating easy access to surrounding areas.
What types of properties are available in Berkeley?
Berkeley, Illinois offers a variety of single-family home options, including ranch-style homes, split-level homes, and contemporary-style homes. These homes can be found throughout the town, with some located near the downtown area and others in residential neighborhoods. Most properties in Berkeley, Illinois feature two to four bedrooms and were built in various years. To explore different property types for sale in Berkeley, Illinois, use the 'Home type' filter located above the active listings. Customize your search by selecting options like single-family homes, condos, townhomes, and more.
What is life like in Berkeley?
Living in Berkeley, Illinois offers a vibrant and dynamic experience. The landscape is characterized by a mix of urban and suburban elements, with a range of residential and commercial areas. The weather in Berkeley varies throughout the year, with warm summers and cold winters, providing a diverse climate. Job opportunities in Berkeley are diverse, with a variety of industries and businesses present in the area. Residents can enjoy a wide range of activities, including shopping, dining, and exploring local parks and recreational facilities.
What are the schools and amenities like in Berkeley?
Berkeley, Illinois, provides a range of public amenities for its residents. You'll find a variety of restaurants offering diverse culinary experiences. Parks are also available, providing open spaces for relaxation and recreation. For your shopping needs, there are several grocery stores within the town. Additional amenities include educational institutions, healthcare facilities, and a public library, all designed to cater to the diverse needs of Berkeley residents.
In the past month, 7 homes have been sold in Berkeley. In addition to houses in Berkeley, there were also 0 condos, 1 townhouse, and 1 multi-family unit for sale in Berkeley last month. Find your dream home in Berkeley using the tools above. Use filters to narrow your search by price, square feet, beds, and baths to find homes that fit your criteria. Our top-rated real estate agents in Berkeley are local experts and are ready to answer your questions about properties, neighborhoods, schools, and the newest listings for sale in Berkeley. Our Berkeley real estate stats and trends will give you more information about home buying and selling trends in Berkeley. If you're looking to sell your home in the Berkeley area, our listing agents can help you get the best price. Redfin is redefining real estate and the home buying process in Berkeley with industry-leading technology, full-service agents, and lower fees that provide a better value for Redfin buyers and sellers.


 REDFIN IS COMMITTED TO AND ABIDES BY THE FAIR HOUSING ACT AND EQUAL OPPORTUNITY ACT. READ REDFIN'S FAIR HOUSING POLICY AND THE NEW YORK STATE FAIR HOUSING NOTICE.
 United States
 Canada