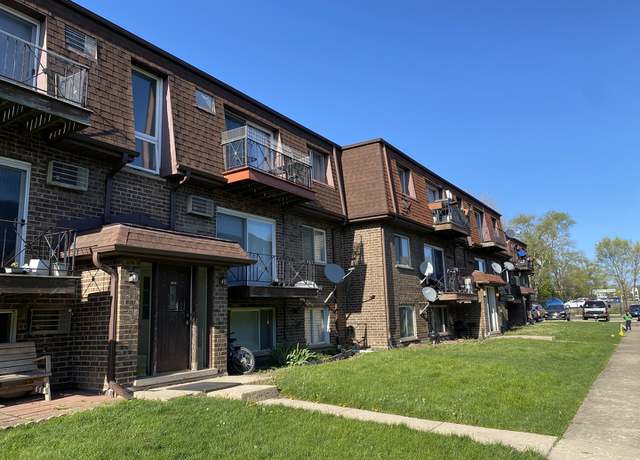
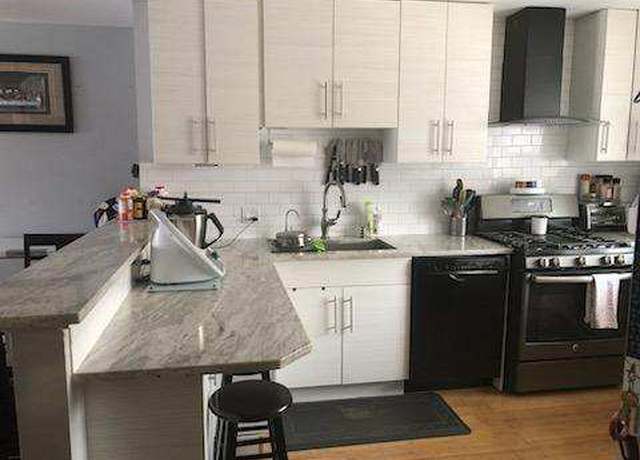
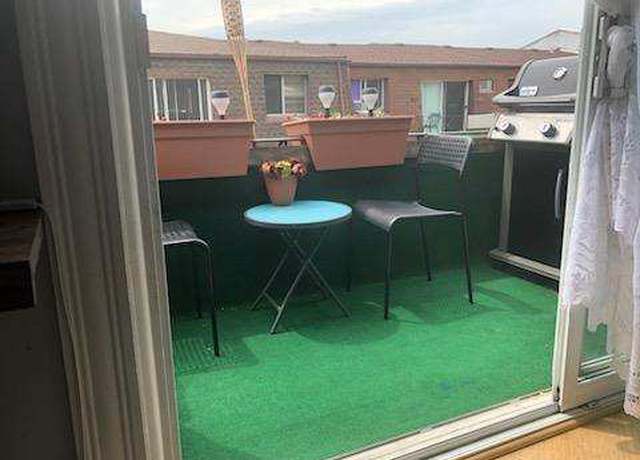
Presenting luxury 2 bedroom, 1 bath unit in sought-after Glenview Manor community. Renovated in 2022. Stepping inside you will be welcomed by popular open floor concept that combines kitchen, living and dining room. Beautifully remodeled kitchen with modern features includes: white kitchen cabinets, granite countertop, ceramic backsplash and stainless steel fridge, sink, black finish dishwasher and rangehood. High quality solid hardwood floors throughout. Spacious living room combined with dining room. Recessed lights. Balcony off the living room. Generosly sized bedrooms with lots of closet space. Updated bathroom with new bathroom fixtures including vanity, bathtub, tempered glass shower
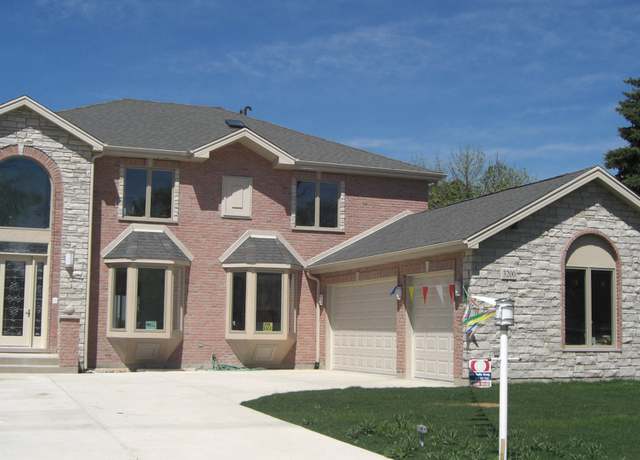
AVAILABLE IMMEDIATELY !!!! GRT LOCATION CLOSE TO GLENBROOK S. HS, THE GLEN & TRI-STATE. BRICK & STONE CONSTRUCTION W/ 5 BEDRM & 4 FULL BATH. LARGE KITCHEN W/ EURO SOFT-TOUCH DRAWERS & CABINETS, GRANITE COUNTER TOPS & CENTER ISLAND. CHINA CABINETS IN DINING RM. 1ST FLOOR OFFICE/BEDRM W/ FULL BATH, MUD RM/LAUNDRY. REAL WOODBURNING STONE & GRANITE FIREPLACE W/ GAS STARTER, CENTRAL VAC, INTERCOM. ALL WINDOWS & DOORS ARE ENERGY EFFICIENT TRIPLE TRACK PELLA WITH ARGON GAS. ALL OUTSIDE WALLS HAVE HIGH EFFICIENCY BLOW-IN INSULATION. ALL HARDWD FLOOR ON 2FLOOR. MASTER BATH WITH WALK-IN CLOSET, DOUBLE VANITY, JACUZZI & STEAM SAUNA. ALL BATHRMS W/ WHIRLP
This spacious residence boasts four bedrooms, 2.5 bathrooms, and numerous recent upgrades for modern comfort and style. New vinyl windows throughout the home were installed in 2018. The HVAC system, which underwent a complete update in 2008, now features a brand-new smart Wi-Fi thermostat. A brand new roof, along with new gutters and fascia, was completed in 2023, further enhancing the property's appeal. The first-floor master suite, measuring 15x15, offers ample storage and a picturesque view of the expansive front yard. Its accompanying master bath exudes luxury with a large whirlpool bathtub, separate shower, and elegant granite tiles. Upon entry, the foyer showcases built-in cabinetry,
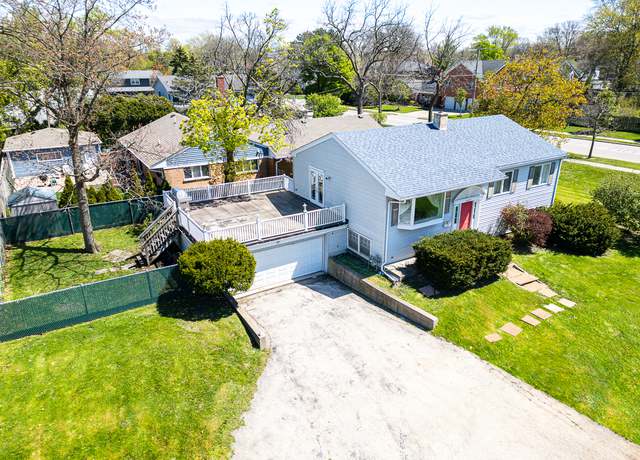
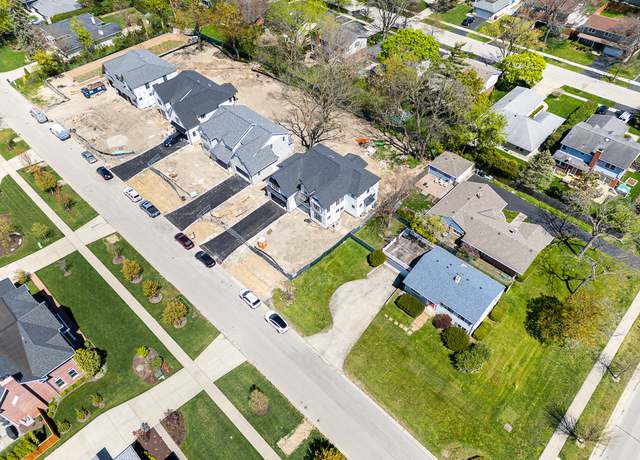
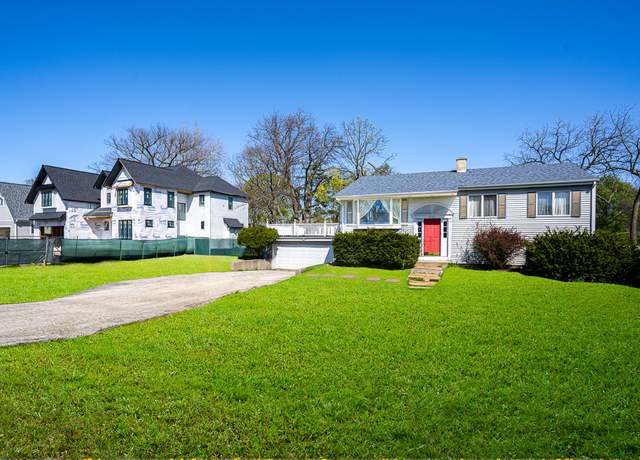
Nestled in a coveted enclave surrounded by multimillion-dollar new constructions, this charming property at 1007 Prairie Lawn presents an exceptional opportunity for discerning buyers. This house is Ideal for those envisioning their dream home seeking a residence with potential for personal touches, this home offers versatility and promise. Significant updates have been undertaken overtime to enhance both functionality and aesthetic appeal. These include a recently replaced roof, a new sewer line, updated electrical systems, and newer windows and much more. This home features an open floor plan, seamlessly integrating living, dining, and kitchen areas-perfect for modern lifestyles. The kitc
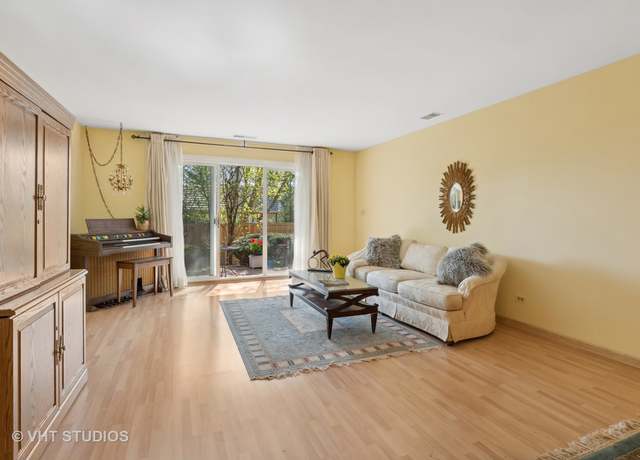
Rarely available large 2 bed 2 bath condo in a convenient East Glenview location near downtown awaits your decorating ideas. This 1st floor G unit offers a private entry and an expanded outdoor patio perfect for entertaining and enjoyment. The cozy chef's kitchen has appliances from 2017 Whirlpool refrigerator, electric oven, dishwasher plus GE microwave and plenty of cabinetry. A large dining room opens to the family room with east facing sliding doors out to the large patio. The primary suite offers its own walk-in closet & bathroom with shower & tub combo. The 2nd bedroom shares the hall bathroom with tub & shower. A large front foyer closet plus a separate private loc
Stunning remodel in one of Glenview's most coveted neighborhoods! 2331 Swainwood offers 4beds/2.1 of beautifully rehabbed space. Massive private backyard with brand new covered porch! Walkability to Roosevelt Park and Pool, The Glen, Downtown Glenview, Shops Restaurants, Metra and more!
Welcome to 653 Elmgate Drive nestled in the Country Club Garden Neighborhood of popular Glenview. Spanning over 4,200 SQ of living space, this meticulously maintained residence features 4+1 bedrooms, 4.5 bathrooms, and an array of amenities that redefine modern living. As you step inside, you'll be greeted by an inviting foyer adorned with hardwood floors leading to the living room and dining room - setting the tone for the sophisticated ambiance that permeates throughout the home. The main level exudes warmth and functionality, with a well-appointed open kitchen showcasing cherry cabinets, granite countertops, and ss appliances. Enjoy casual dining at the breakfast island or entertain gues
Great 4 bed w 3 full bath home in New Trier HS district. Close to shops and express way. Tenant occupied until May 10th. 24 hr notice required for showing. Property sold as-is. Some work needed. Tenant occupied the property for 8 years.
Spacious two story colonial in desirable Glenview. Four large bedrooms plus a first floor den. Hardwood floors grace most of the first floor including living & dining rooms large enough for sizeable entertainment events. Kitchen features stainless appliances, quartz countertops and a bright & airy eating area. The U shaped counter provides loads of preparation space. A first floor office includes beautiful wood decor and unique built ins. Primary bedroom suite has a private bath, walk-in closet, ceiling fan and recessed lighting. Convenient first floor laundry/mud room. Don't miss the finished basement with a wet bar and and plenty of extra storage. The large deck extends your e
Walk through the house with the 3d tour here or use virtual tour for latest photos Stunning East Glenview red brick colonial with Wilmette schools boasts 5 bedrooms, 4.1 baths plus an inviting fenced backyard with deck, patio & dog run. Step inside and the foyer welcomes you with natural light from a skylight. This 2001 built home with hardwood floors throughout offers a refined and sophisticated look. The gourmet kitchen is well organized with rich cherry wood cabinetry, decorative built-ins, a center granite island, an undermount sink + a separate prep sink, SubZero refrigerator, Thermador double ovens, 5 burner gas stove with professional exhaust fan plus a convenient workstation.
Discover the Ultimate in Luxury Living in the Glen's Prime Location! Nestled on one of the largest premium lots in the Glen, this residence offers unparalleled design, exclusivity and comfort. Step into the grand two-story foyer, setting the tone for the home's expansive layout designed for both entertaining and everyday living. The designer kitchen is a culinary masterpiece, featuring a large center island with custom built-in bench, top-of-the-line appliances, a walk-in pantry and easy access to the backyard, it's perfect for hosting gatherings or enjoying casual meals. Entertain in style in the family room, with a captivating stone fireplace, and an abundance of natural light streaming
Discover the Perfect Blend of Luxury and Location! Step into a world of elegance with this stunningly updated home, perfectly situated in a prime location in the heart of The Glen. Welcome to 2215 Patriot Blvd boasting an open and flexible floorplan, this residence offers the epitome of luxury living. Enter into the grand sunlit living room, featuring a sleek fireplace and access to a balcony, seamlessly flowing into the dining room, ideal for hosting gatherings with ease. Prepare gourmet meals in the custom kitchen, adorned with Laminam countertops, a waterfall island with seating, Omega cabinets, and top-of-the-line appliances, including a double oven and wine fridge. On the main level,
Rarely available pristine Glenlake Estates Townhome! Open floor plan with first floor primary suite. Bright sunny end unit surrounded by professional landscaping and mature trees. Updated kitchen with newer stainless appliances, refaced cabinets, granite counters and island. Kitchen opens to eating area and oversized great room with fireplace flanked by French doors to access deck. Great room with skylights, vaulted ceiling and huge picture window overlooking scenic yard. First floor powder room and generous sized laundry room with access to two car attached garage. Upstairs you will find two bedrooms with full bath and a large loft area. Finished English basement with views of yard and wal
Welcome to Glenview!! This raised ranch house in Glenview with three bedrooms and two baths, including a full bathroom in the master room, it offers comfort and convenience. The new shower installation in 2022 adds a modern touch and ensures a fresh feel. The spacious living room provides ample space for family time, and the option to reveal hardwood floors underneath the carpet adds versatility and charm. The family room sounds like the perfect spot for gatherings and quality time together, enhancing the home's livability. An unfinished basement offers potential for customization and personalization, allowing the new owner to tailor the space to their needs and preferences. There is a big
Welcome to the Village of Glenview with a perfectly located home on a private cul-de-sac. This single-family home features 5 bedrooms, with three on the second floor and two on the lower level, complemented by 2 full baths, and a huge sub-basement. Enjoy the flow of the main level with a cozy living room, formal dining room, and a functional kitchen. The lower level includes a family room and an additional two bedrooms, enhancing this home's versatility. Additional amenities include a laundry room and work space in the sub-basement with high ceilings that could easily be finished with extra rooms. The exterior includes a fenced yard for privacy, a single-car attached garage, a fully enclose
Welcome to your serene retreat nestled in a quiet, tree-lined cul de sac! This stunning 2-story Colonial single-family home boasts a spacious open floor plan spread across 2700 sq ft, providing ample space for comfortable living and entertaining. With 4 bedrooms and 3 bathrooms, including a luxurious master suite, this residence caters to both relaxation and practicality. A 2.5 car attached garage offers convenience and storage space. This home was entirely renovated and modernized in 2013 including the kitchen which is a chef's delight, featuring all stainless steel appliances and elegant quartz countertops. Step into the finished recreation room in the basement, complete with separate out
Welcome to 411 Woodland Ct. in picturesque Glenview, IL. Step into a grand entryway illuminated by an abundance of natural light, setting the stage for an awe-inspiring living experience. This remarkable property offers 6 bedrooms and 6.5 bathrooms, ensuring ample space for luxurious living. Nestled within the confines of a 3-car attached garage and gorgeous, this sprawling 7800 sq ft home is adorned with elegant hardwood flooring throughout. Culinary enthusiasts will delight in not one, but two kitchens, both equipped with top-of-the-line appliances, promising an elevated cooking experience. Descend into the fully finished basement and living area, where entertainment knows no bounds. Whet
ARCHITECTUALLY STUNNING ALL BRICK HOME w/ highest level finishes & beautiful mill-work throughout on over 1/2acre! Gracious Foyer entryway with bridal staircase and flanked by Living & Dining Rooms, gourmet kitchen open to family rm w/ floor to ceiling stone fireplace, sliders to patio & expansive yard. 1st floor bdrm w/ full bath. Amazing LL w/ theatre, wet bar, wine cllr, rec area w/ builtins, bed & full bth. ,generator, 3 car garage! Too many gorgeous details to list. Butlers Pantry, Powder Room, optional 5th bedroom en suite, Mud/Laundry Rooms complete the main floor. Jr Suite with walk-in closet and en suite with bathtub. Jack & Jill Bedrooms each offer sp
Rare opportunity presents itself to purchase a one owner, custom built home that sits on ONE ACRE on prestigious and private Lawson road! This home features stunning landscaping with over 4,000 perennials on the premises complemented by artistic mature trees and fabulous outdoor space for all of your needs. Greeted by a lovely driveway, you walk into an open living room with sight lines going right out into the yard. Spacious living room w/ gas fireplace leads into an eating and bar area and sliding door out to the back yard. As you enter the newly updated eat - in chef's kitchen you are met with an expansive island with Caesarstone countertops, custom backsplash, ss appliances, custom cabi
Desirable & rarely available 1st floor condo in La Salceda del Norte Condominiums in the heart of Northbrook. Spacious, bright, and freshly updated 1 bedroom, 1 bath that is move-in ready. Master bedroom with a walk-in closet. Light and bright living room and dining room combination. Brand new carpet and tiles throughout. Sliding doors to a relaxing patio. This condo is in a terrific location near shopping, Metra Station, Downtown Northbrook, Glenbrook North High School, The Glen, and easy access to the expressway from Willow Road. Includes 1 garage space for comfortable parking year-round. Amenities include in-ground pool, party room, and tennis court. New furnace and air conditioner
IF YOUR LOOKING FOR MORE SPACE, THIS IS THE PLACE. So Much Larger Than It Looks. 3800sf above grade. 1000sf in the basement. Sprawling Colonial in Sought After Canterbury Park in East Glenview. Easy walk to shops, restaurants, and grocery stores. Award Winning School District. This is the perfect home for entertaining with its 43x19 Great Room w/ 10ft trayed ceiling, wide custom moldings, stunning mantle over the fireplace, wet bar, gorgeous wood floor, and large bay window overlooking the patio and private yard. Beautiful 20x14 Family Room w/ wood floor, custom mantle, and fireplace. 17x15 office with a large walk-in closet can also be used as a 5th bedroom with a private full bath, marble
UNIQUE LOCATION, BETWEEN THE FOREST PRESERVES AND BACKS UP TO WILMETTE GOLF CLUB. CAPE COD STYLE HOME WITH THREE BEDROOMS AND 3 FULL BATHS, FULL FINISHED BASEMENT, 2 WOOD-BURNING FIREPLACES, LOTS OF STORAGE AREA, FENCED YARD, YOUR PRIVATE OASIS IN TOWN. BEAUTIFUL SUNNY HOME. THIS IS AN ESTATE SALE. HOME IS BEING SOLD "AS IS" BUT EVERYTHING IS IN WORKING ORDER. NO HOME TO SELL CONTINGENCY OFFERS, PLEASE.
Step into this beautifully updated 2-story townhome, boasting a bright and contemporary design with a finished basement and backyard. On the main level, you're greeted by a spacious living room and kitchen flooded with natural light, offering a picturesque view through large windows. A convenient half bath adds to the functionality of the space, while an exit to the backyard beckons for summer gatherings and relaxation. Upstairs, three dreamy bedrooms await, along with a full bath. Descend to the lower level, where you'll find a generously sized family room, laundry room, and ample storage space, perfect for practicality and organization. The home's recent renovations include a modern kitch
Don't miss this quiet, top floor condo on the desirable east side of Glenview! Perfect for a single person who is tired of renting, snowbirds, or a new couple just starting out! Two bedrooms and newer bamboo hardwood floors throughout, except in the beautifully remodeled bathroom. Brand new kitchen (April 2024)! New cabinets, quartz counter tops, backsplash, stainless steel appliances. Kitchen air conditioner, also brand new! Lots of closets within and additional (13'x7') attic storage space. Newly updated bathroom (2 years)! Everything except bathtub, redone and replaced. 1 garage parking space #74. Plenty of parking, plus your own enclosed garage space comes with this unit. Radiant heat
Well cared for 3 BR, 2 BA split level in a quite cul-de-sac street in Glenview. Red Oak hardwood floors in living room and dining room. Living room and dining room are in an "L" shaped configuration. Gas fireplace in living room. Open newer kitchen with granite counters. Bath updated with whirlpool tub, seamless sink, and countertops. Updated bath with shower on the lower level. Primary bedroom with engineered wood floors. Large family room on the lower level with nearby laundry room. Great closet space. Newer windows. New roof 2024. Central air (2017), hot water heat. Hot water heater 2021, new sump 2022 battery back-up 2019, new concrete patio and concrete by front door. Large e
Don't miss this unit! Situated in the heart of the Glen across the street from The Glen Club and within 3 min walk to the shopping and restaurants. This 4,241 sq ft unit features all the bells and whistles. Stylish kitchen with neutral cabinetry coupled with granite countertop and stainless-steel appliances with butler pantry. Master bedroom with separate his and her walk-in closets with upgraded custom sheveling unit. Master bathroom with dual sink with separate steam shower with jet sprays, and jetted tub with ample storage space. Attached 2 car garage with tiled flooring, dual zoned HVAC, and a ton of storage space.
Welcome to 1130 Terrace Lane in Glenview, a community where properties are highly sought after and inventory low. This three-bedroom, two-bathroom tri-level home combines comfort with great potential, standing on a corner lot that commands attention with its curb appeal. It's the ideal setting for those ready to tailor a home to their taste, either immediately or in stages. Step inside to an open and inviting living room that flows effortlessly into the dining area, making it ideal for both family life and entertaining. Adjacent to this, the sunroom provides a light-filled space for relaxation or hosting, with direct access to the yard that awaits your transformation into a personal oasis.
Great looking unique bi level hillside home fully renovated in 2020 situated on the largest lot (0.6 Acre) in a private drive as part of Valley Lo Subdivision. Inviting open concept floor plan with Living room open to Dinning Room and Kitchen. Partial Lake views from the living room. Dinning room with a sliding glass door opening to the patio and huge back yard. Living room featuring vaulted ceilings, hardwood floors and wood burning fireplace (and you can easily add gas to that fireplace). Beautiful custom kitchen and baths from STUDIO 41, all stainless steel appliances are from ABT. Gorgeous quartz countertops along with a great breakfast bar for entertaining (comfortable seating for thre
Welcome to this new construction modern home in Glenview, offers the perfect blend of contemporary design and functionality. With its spacious living areas, custom kitchen, luxurious primary suite, and entertainment-ready basement, it provides an exceptional living experience for the modern homeowner. As you step into the foyer, you'll immediately notice the attention to detail, with heated floors and an abundance of natural light flooding in. The designer staircase, surrounded by glass panels, adds a touch of elegance and sophistication. The living room is adorned with remote control fireplace, adding warmth and elegance to the space. Formal dining room with tray ceilings. Floor to ceiling
BEAUTIFUL, two-story stone and cedar home located on a quiet tree-lined street in an incorporated area of the highly desirable Village of Glenview! This 5 bedroom, 3.1 bathroom home features a generous layout with 4,178 square feet of living space! The main level offers a gracious open floor plan with high ceilings, hardwood flooring, and plenty of windows that fill the interior with ample natural light. The main floor offers a large, sun-filled living room that includes a built-in dual gas/wood fireplace with a stone mantelpiece, ideal for relaxing! The main floor provides a spacious separate dining room, perfect for entertaining. The kitchen features plenty of cabinetry blended with grani
This is a rare and unique home that offers a park-like living experience while being conveniently located within walking distance of all of Glenview's amenities. These include Gallery Park and Lake, the Glen Town Center, Metra station, and Kohl Children's Museum. The first floor boasts an open-concept design with generously sized rooms, perfect for entertaining guests. There is a cozy family room with a gas log fireplace, a 23' kitchen with all-new stainless steel appliances, a great dining space, an island, and a half bath. The second floor features a spacious primary bedroom with an en-suite bathroom with a double-bowl vanity, a separate shower, and a walk-in closet. There are two additio
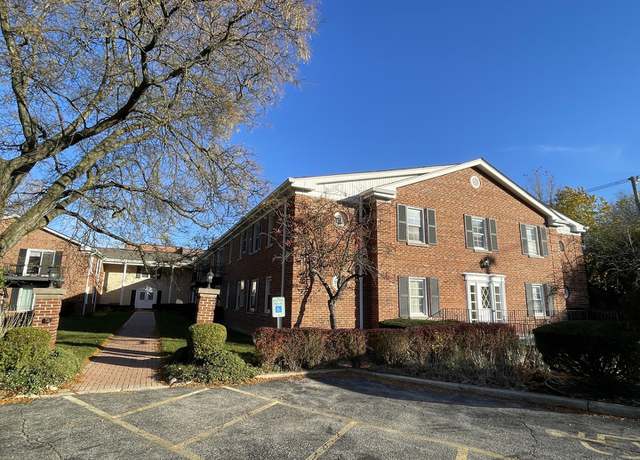
MULTIPLE OFFERS-HIGHEST AND BEST DUE BY 4-26 @ 6 PM. CABOT HOME BUILDERS AWARD WINNING QUALITY AND DESIGN! INVESTORS WELCOME! RENTAL ALLOWED! FLEXICORE CONSTRUCTION, DESIRABLE DISTRICT 34 & 225 SCHOOLS, RARELY AVAILABLE, 2ND FLOOR UNIT, ALL FRESHLY PAINTED THROUGHOUT, NEWER FURNACE AND CENTRAL AC, NEW CARPETING, NEWER REFRIGERATOR AND MICROWAVE, STORAGE, LAUNDRY ON-SITE, MOVE IN READY!
This rarely available first-floor condominium, featuring bright 2 bedrooms and 2 full bathrooms, is a perfect combination of relief and convenience. This unit boasts all-new (2019) large windows - including a huge sliding door - which frame a year-round scenic view with ample sunlight and a corridor of trees beautifully maintained by professional landscaping services. Two full bathrooms, a spacious living room, and versatile kitchen appliances mean you will be equipped for any occasion. With an updated in-unit laundry room and plenty of space in the numerous closets, storage room, and garage, this home will cater to any stage of life. The elementary and middle schools are safe and rigorous,
New luxury home in Village of Glenview with summer 2024 delivery with finest custom finishes by well know home builder. Stunning stone, frame on a large 72 by 150 lot. Aprx 4200 SF above ground, 5 Bedrooms, 4 1/2 baths with 2 car heated garage and 2nd floor Laundry. Gym, Dual HVAC system, 9'6"foot first floor ceilings, smart system ready, Pella windows, gas fireplace, cabinetry, decorative molding, hardwood floors, quartz counter tops, top of the line appliances, brick patio, porch & more. Close to 94, Metra, parks, schools and shopping! Still time to pick finishes to make this your dream home in most desire location!
Over $420,000 in custom quality upgrades invested by the seller, transforming this already stunning home into a breathtaking showcase of luxury and design. This substantial investment and unique blend of elegance and style makes this property a standout. Updates include NEW Anderson Windows (3/2022), two NEW HVAC systems (3/2022), a NEW Roof (6/2021), impressive kitchen and bathroom remodels (2020), custom closet factory shelving done in office and the garage, high-end appliances, designer light fixtures, NEW blinds and motorized shades, crown molding, amazing architectural details, and an interior freshly painted in a modern color palette (check out the attached list for all the improvemen
FANTASTIC OPPORTUNITY TO BUILD YOUR DREAM HOME ALONGSIDE AN EXPERIENCED & METICULOUS BUILDER. SOPHISTICATED STYLES & MODERN ARCHITETUAL DETAILS. HIGH END FINISHES & INCREDIBLE ATTENTION TO DETAILS ARE THE SPECIALTY OF THIS WELL EXPERIENCED NORTH SHORE BUILDER. BRING US YOUR IDEAS OR CHOOSE FROM MULTIPLE DESIGNS, FLOOR PLANS & FINISHES AND WE CAN BUILD UPTO 6500 Sq. Ft. ( Including Bsmt. ) CUSTOM HOME FOR $410.00 PER SUARE FOOT, COMPARED TO AVERAGE CONSTRUCTION COST OF $490.00 / Sq. ft. IN ANY NORTH SHORE SUBURBS. CORNER LOT FACING EAST OFFERS TON OF SUNLIGHT IN THIS CUSTOM HOME. EXCEPTIONAL 4 BEDROOMS, 3.1 BATHS AND TOTAL OF 3600sf HOME WITH OPEN FLOOR PLAN FOR TODAY
We will have you at location. .. but that is just the beginning. This light filled custom built 5 Bedroom 5.5 Bath home features a sprawling floor plan with approximately 7200 sq. ft. , which includes a 2000 sq. ft. lower level. soaring 20 foot ceilings in the main floor family room. And a sublime park like yard, on a 74 x 190 lot, perfect for the kids and entertaining. Some of the highlights of this stunning custom home include: custom cabinetry and millwork throughout, Brazilian cherry floors, 16 foot glass doors/windows showcasing the breathtaking yard, 4 bedrooms up that are all en-suite with heated floors, a vaulted 15 foot ceiling in the primary along with a private balcony, a fully f
Based on information submitted to the MLS GRID as of Sun Apr 28 2024. All data is obtained from various sources and may not have been verified by broker or MLS GRID. Supplied Open House Information is subject to change without notice. All information should be independently reviewed and verified for accuracy. Properties may or may not be listed by the office/agent presenting the information.
School data is provided by GreatSchools, a nonprofit organization. Redfin recommends buyers and renters use GreatSchools information and ratings as a first step, and conduct their own investigation to determine their desired schools or school districts, including by contacting and visiting the schools themselves.Redfin does not endorse or guarantee this information. School service boundaries are intended to be used as a reference only; they may change and are not guaranteed to be accurate. To verify school enrollment eligibility, contact the school district directly.
Glenview, Illinois boasts a well-structured transportation system, with numerous options for residents. The town experiences moderate traffic levels, making driving a car a convenient option for getting around. Public transportation is readily available, with Metra rail service and Pace bus routes serving the area. Additionally, Glenview is conveniently located near major highways, including Interstate 294 and Interstate 94, providing easy access to surrounding regions. Learn more on our Glenview city guide.
What types of properties are available in Glenview?
Glenview, Illinois offers a variety of single-family home types, including ranch-style homes, split-level homes, and contemporary homes, among others. These homes can be found throughout the different neighborhoods of Glenview, such as The Glen, East Glenview, and West Glenview. Most properties in Glenview feature 3 to 5 bedrooms and were built in various years. To explore different property types for sale in Glenview, Illinois, use the 'Home type' filter located above the active listings. Customize your search by selecting options like single-family homes, condos, townhomes, and more.
What is life like in Glenview?
Glenview, Illinois offers a charming and peaceful living experience with a picturesque landscape that combines lush greenery and serene neighborhoods. The area enjoys a moderate climate, with warm summers and snowy winters, providing a diverse range of outdoor activities throughout the year. The town boasts a thriving job market, with various industries and professional opportunities available, ensuring residents have ample employment options. Glenview offers a vibrant social scene with a plethora of entertainment options, including shopping centers, restaurants, and recreational facilities, catering to a wide range of interests. The community fosters a sense of togetherness, providing numerous opportunities for residents to engage in local events and activities that promote a strong sense of belonging.
What are the schools and amenities like in Glenview?
Glenview, Illinois offers a variety of public amenities to cater to the needs and preferences of its residents. Yes, there are numerous restaurants in the area, providing a diverse range of cuisines to satisfy every palate. The town is also home to several parks, offering green spaces for relaxation and recreation. Grocery stores are readily available, ensuring that residents can conveniently access their daily necessities. Additionally, Glenview boasts other amenities such as libraries, fitness centers, and shopping centers, enhancing the overall living experience in the town.
In the past month, 45 homes have been sold in Glenview. In addition to houses in Glenview, there were also 19 condos, 21 townhouses, and 1 multi-family unit for sale in Glenview last month. Glenview is a minimally walkable city in Cook County with a Walk Score of 39. Glenview is home to approximately 45,332 people and 31,415 jobs. Find your dream home in Glenview using the tools above. Use filters to narrow your search by price, square feet, beds, and baths to find homes that fit your criteria. Our top-rated real estate agents in Glenview are local experts and are ready to answer your questions about properties, neighborhoods, schools, and the newest listings for sale in Glenview. Our Glenview real estate stats and trends will give you more information about home buying and selling trends in Glenview. If you're looking to sell your home in the Glenview area, our listing agents can help you get the best price. Redfin is redefining real estate and the home buying process in Glenview with industry-leading technology, full-service agents, and lower fees that provide a better value for Redfin buyers and sellers.


 REDFIN IS COMMITTED TO AND ABIDES BY THE FAIR HOUSING ACT AND EQUAL OPPORTUNITY ACT. READ REDFIN'S FAIR HOUSING POLICY AND THE NEW YORK STATE FAIR HOUSING NOTICE.
 United States
 Canada