One of the largest townhouse in Westlake subdivision! 3 bedrooms, 2.5 bath with finished basement. Large storage room in the basement and space for a home office, game room or play room. The kitchen has been fully renovated in 2022, with a full gutting to ensure modern amenities and a fresh look. Beautiful stain less steel appliances and breakfast room. High end wood laminate flooring. throughout. And to top it off, the roof has also been replaced. Roofs are covered by the association and exterior paint. You are going to fall in love with the cathedral ceiling in the back. Tons of lighting and sliding doors leading to your own private patio with room to entertain or have a nice meal al fres
TERRIFIC 2 STORY TOWNHOME FEATURING IDEAL LOCATION BACKING TO PRIVATE POND AND JUST STEPS AWAY FROM WALKING/JOGGING PATH AROUND BLOOMINGDALE GOLF COURSE. FANTASTIC KITCHEN WITH GRANITE COUNTERTOPS, CERAMIC TILE BACKSPLASH, BEAUTIFUL HARDWOOD FLOORING WITH ADJACENT BREAKFAST AREA. HUGE MASTER BEDROOM WITH REMODELED BATHROOM IN 2020 AND WALK IN CLOSET. SPACIOUS 2ND BEDROOM WITH ITS OWN PRIVATE BATH REMODELED IN 2022. BEAUTIFUL FINISHED BASEMENT WITH ADDITIONAL 3RD BEDROOM OR OFFICE SPACE. PRIVATE POWDER ROOM IN BASEMENT JUST IN CASE YOU HAVE FRIENDS OR FAMILY WANTING TO STAY OVERNIGHT. RELAX OUTSIDE ON YOUR OWN 25X12 DECK OVERLOOKING PICTURESQUE POND. FURNACE AND CAC REPLACED APPROXIMATELY IN
Stylish 3Bed/2.1Bath END UNIT townhome with an attached 2 car garage and a list of updates that will capture today's buyer - NEW(2024) Interior Paint, (2023) Tear-off Roof and (2023) Furnace & AC! Over 3000SF of livable space, each bedroom features a spacious walk-in closet, ample storage and 3 private patio/balcony spaces, one including a convenient gas line connection. Vaulted ceilings, built in cabinetry and an updated kitchen add to fresh appearance of this beauty! Lower level wet bar can effortlessly convert into a small kitchen, providing an in-law arrangement option. Situated close to shopping, dining, major roads & expressways!
Well Maintained Home Features 3 Bedrooms, 2 Full Bathrooms and Lower Level Family Room. Family Room Features Laminate Flooring and Plenty of Windows. Home is Neutral Throughout And Move In Ready. Large Kitchen has Movable Island & Opens to Dining Area and Living Room. Living Room, Dining Room and All 3 Bedrooms Feature Beautiful Laminate Flooring. Living Room Features Recessed Lighting and Has a Sliding Glass Door for Natural Light and Extra Fresh Air Leading to Juliet Balcony. Kitchen Has Sliding Glass Door to Large Deck. Big Yard with Patio is Great For Entertaining or Just Relaxing by the Fire Pit. Kids Playset and Large Shed Too. 2 Car Attached Garage is Heated with Insulated Gara
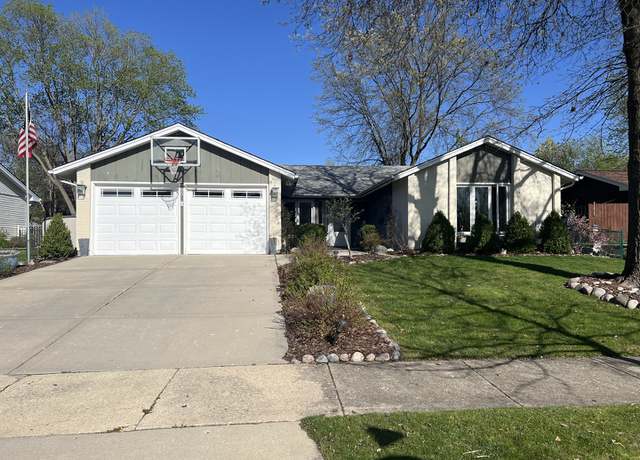
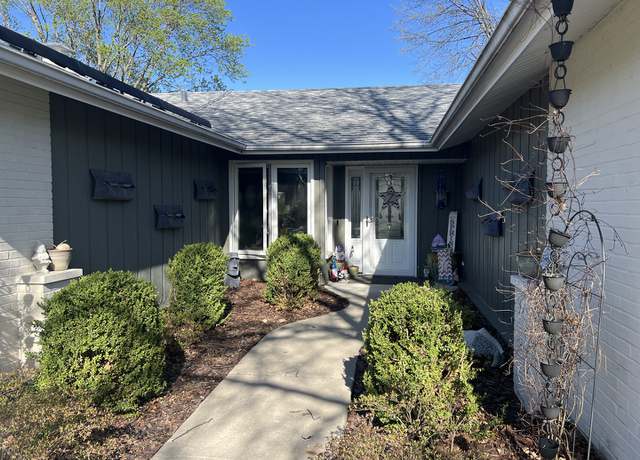
LOCATION, LOCATION, LOCATION! Located in highly sought after School District 13 and Lake Park High School District 108. This U-shaped ranch with 2 car garage is ideally located in walking distance to Bloomingdale Park District, Library, DuJardin Elementary, Westfield Middle School and numerous parks and playgrounds. New roof, windows, kitchen, driveway and back patio installed in 2011, Laminate wood flooring installed 2012, Brick patio installed 2017, Brick Mailbox installed 2020, Garage floor professionally epoxied in 2020, 18ft round above ground pool installed 2021, New furnace installed 2021, Solar Panels installed by Sunrun 2021, Smart Home items installed 2021-2022 (3 Hue ceiling lig
Discover the perfect blend of comfort and convenience in this delightful first-floor condo nestled in the vibrant heart of Glendale Heights. This property features two bedrooms and two full bathrooms, making it an ideal choice for anyone looking for a modern and manageable living space. New Window blinds, new Washer & Dryer, New ceiling lights in living room, Microwave one year old are recent updates. Step inside to find an open, spacious living area that seamlessly combines the dining and living rooms, creating an inviting atmosphere perfect for relaxation and entertainment. The entire unit is adorned with sleek laminate flooring that enhances the aesthetic . The master suite is a tr
1/14
$195,000
2 beds2 baths988 sq ft
171 N Waters Edge Dr #101, Glendale Heights, IL 60139
Exceptional opportunity to own a meticulously maintained 2.1-acre property situated on sought-after Army Trail Road. This rare offering features a 3,367 SF brick ranch home that served as office headquarters for several years, boasting sturdy structure and excellent potential for conversions and many different uses. Versatile Possibilities Await: Home Business Hub: Explore the potential for operating a salon, spa, truck parking, landscaping service, tree cutting service. The location is perfect for construction services that need space to park their equipment and materials. There are endless opportunities for what business could operate out of this location. With ample room, this property c
This exquisite Cambria home, constructed in 2023, offers over 3000 square feet of impeccable living space and is available for a March move-in within the Springfield Pointe community in Bloomingdale. Boasting 4 bedrooms, 3 full bathrooms, and a first-floor den conveniently located near one of the full baths, along with a loft, this captivating home design caters to modern living. The open-concept kitchen features stunning quartz countertops, stainless steel appliances, and is complemented by a breakfast area that separates it from the spacious sunroom. With 9-foot ceilings and elegant wood laminate flooring throughout the first floor, the home exudes style and comfort. Upon entry on the upp
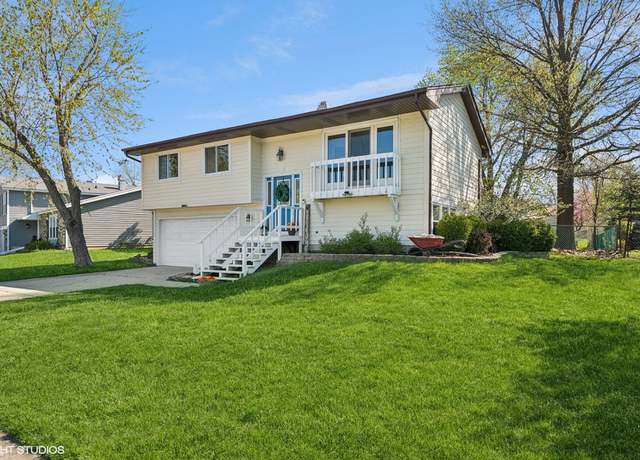
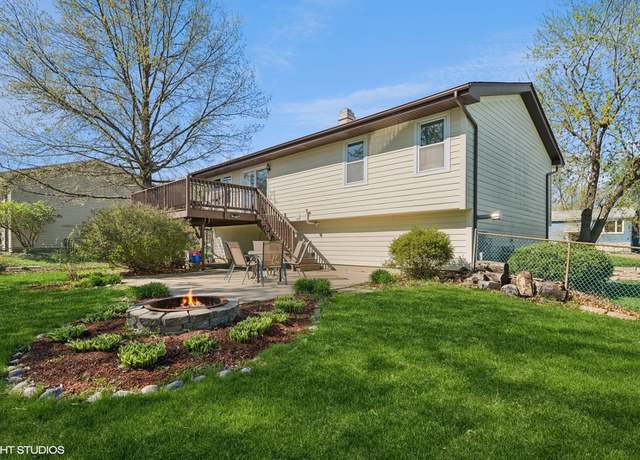
Beautiful meticulously maintained all brick raised ranch home on nearly a half acre property. Three bedrooms, two full baths, kitchen, living and dining room on second level and one bedroom, one full bath, kitchen, dining area and two family rooms on main level make this a perfect in-law arrangement. Solidly built with lots of storage! New roof in 2019!
2024 Completely remodeled 2 bedroom/2 Bath condo! No expense was spared in this rehab with gorgeous kitchen cabinets, quartz counter tops, beautiful glass backsplash & stainless steel appliances. Brand new flooring throughout. 2 full stunning bathrooms will make you fall in love instantly. Freshly painted home throughout. And, even a double balcony & storage closet! THIS IS A CAN'T MISS! HOA Fees includes water, cable TV, pool, lake & private beach. Party Room with wood burning fireplace! Clubhouse with workout room.
Excellent opportunity to own a spacious 3rd floor condo unit in the Park Bloomingdale community that offers many amenities. The unit features many recent updates including brand new flooring throughout, a brand-new furnace/AC combo unit, and has been freshly painted. Additional features include in unit washer & dryer and storage room (#26) adjacent to unit entrance. The condo comes with two assigned parking spaces, #398 & 399. The community amenities include clubhouse, exercise facility, and pool.
Great Location - large 3 Bedroom - 2 baths; 3rd floor, 2 assigned parking spaces. In unit full size washer/dryer. Eat-in kitchen with stainless appliances, granite counters, 42 inch upper cabinets. Newer furnace, stove & dishwasher. Clubhouse has exercise room; outdoor pool. Pictures pre-date last tenant. Patching and painting in progress. Association notified us. They are planning on roofs and balconies this year. They have a one million dollar line of credit for the roofs. Owners will be responsible for their balconies. At this time they have no idea what the total cost is going to be or how balconies and the line of credit will be repaid.
This home is a gem, and the space is amazing! Walk into an inviting foyer area with its welcoming staircase, which flows right into a combined living room and dining room area with its high vaulted ceilings, recessed lighting and tastefully contrasted colors for that modern vibe. Then, use the adjoining room as a bonus room and witness that natural sunlight permeate this space as it also connects to the sun room. It is a magnificent space. This intelligently designed home also features a first floor bedroom with a neighboring bathroom and laundry room. And the second best part of this home is the kitchen! Yes, the second best part. The kitchen has it all: from its white shaker-style cabine
Beautiful 3Bed/2Bath Bloomingdale ranch! Sun-filled home has living room with cathedral ceilings, hardwood floors, fireplace, separate dining area, large eat-in kitchen with walk-in pantry, laundry room with storage & mud sink, and sliding glass doors that lead to spacious deck off of the kitchen that's perfect for entertaining. Huge primary suite has customized walk-in closet, enormous bathroom with walk-in shower, oversized whirlpool tub, two separate vanities, and makeup vanity table. Generously-sized 2nd and 3rd bedrooms share full hall bath. Finished basement has large living space and multiple storage rooms. Attached 2-car garage and ideal location near restaurants, shopping, pa
Luxury resort-like living! This home has everything and close to all the many area amenities that Bloomingdale has to offer. Enter this home and be stunned by all the custom features throughout. This home is an entertainers dream with the conveniences of today's buyers. Tall ceilings and marble staircases on either side of the home allow easy access to both the upstairs and basement. The kitchen has everything you will need at your fingertips, including a coffee bar inside the pantry along with laundry facilities. Plenty of beautiful custom cabinets and top quality appliances, accompanied with an oversized island, make this kitchen simply breathtaking. The living room has two sets of french
Welcome Home! This top (8th) floor, East facing, 1-bedroom, 1-bath condo, in the highly sought after Bloomingdale Place Condo Community, offers one of the best views Bloomingdale has to offer. Upon entering this well cared for condo, you will be immediately drawn to the spacious living area which boasts an abundance of natural daylight. The open-concept design seamlessly connects the living room, kitchen and dinette, creating the ideal space for both everyday living and entertaining. The large en-suite master bedroom includes double closets for ample storage, full bathroom and in-unit laundry. Enjoy your morning coffee or evening sunset from your large, private balcony, where you can un
Construction Has begun on this New Home in Bloomingdale! All Brick Ranch with 2 Bedrooms, 2 Baths, and a Office, a Custom Open Floor Plan. WK Home Builders introduces the Boulder Model. This new home is Located in the Springfield Place Subdivision, a Exclusive Enclave of all Brick Custom Ranch Homes offering a Maintenance Free Living Environment with No Age Restrictions. This Home features Engineered Hardwood Flooring Throughout the Entire 1st Floor, except Tile in Bathrooms and in the Laundry Room. A Dramatic Cathedral Ceiling in the Living Room/Dining ! The Kitchen offers Furniture Quality Cabinetry, and all Countertops are Granite, also there is a large Island! A Appliance Package is
* * This home is currently under construction * * Ask about our reduced interest rate financing * * . The Cambria home design is an impeccable 2,813 square-foot home in Bloomingdale located within the Springfield Pointe community. This captivating home design includes 4 bedrooms and 2.5 bathrooms with an upstairs loft. The home opens to a flex room, designed for you to choose its purpose- a formal dining space or a home office. The open-concept kitchen has beautiful granite countertops and is separated from the spacious great room by a breakfast area. The first floor boasts 9' ceilings and stunning wood laminate flooring. You'll love the convenient second-story laundry room, the luxuriou
Four parcels of land 4.57 acres zoned R-4. Each parcel over an acre. Parcels back up to Bayview Crossings in Bloomingdale and it could be possible to annex into Bloomingdale and obtain water rights. Another option is to build custom homes on 1/2 acre - 1 acre each and remain unincorporated. Home values in area vary but recent comps show easily over $400,000 value in area. Cloverdale is bordered on the west side by protected lands/forest preserve. No future development is possible. Enjoy true country living just minutes from Stratford Square. This is truly a unique opportunity to build your dream home. Possibility to subdivide this parcel into smaller lots. These four lots do not have their
LAND DEVELOPMENT OPPORTUNITY ON LAKE ST. IN BLOOMINGDALE. 121 feet of frontage on this high traffic area, with over 40,000 vehicles per day. This property is a . 76 acre parcel which could be purchased together with the adjacent property at 178 W. Lake St, MLS #12002004, with 3.55 acres. Highly visible location with a 3-way stop light by the property. Currently zoned Commercial B-3. Potential for Multi-family, Townhomes, Single Family, Senior Housing, Commercial, Medical, or Office. Previously approved by the Village for a Senior Housing Memory Care Community. Desirable Bloomingdale School District #13 and Lake Park High School District #108. Convenient to expressways, Metra Train, and O'
LOT IS LOCATED ON NORTH SIDE OF ADDRESS 6N051 - CAN'T FIND THE HOME OF YOUR DREAMS? IT'S TIME TO BUILD! OVER 1/2 ACRE LOT INCLUDES STORAGE SHED. GREAT LOCATION WITH ROOM TO ROAM IN THIS GREAT COUNTRY ATMOSPHERE, YET CLOSE TO SHOPPING, DINING, AND EXPRESSWAYS. THE BEST OF ALL WORLDS! OWNER IS FLEXIBLE HELPING WITH FINANCING.
Look no further! Build your dream home in one of the best location in Roselle. This property of 3.5 acres is currently Zoned R-1 Roselle. The land can be divided into two independent parcels. Great location with 166.49 feet of frontage on busy Roselle Rd. Convenient to shopping, restaurant, expressways, and O'Hare Airport!!! Attention all builders!!!. Option to purchase the lot next door 733 S Roselle Rd and 641 S Roselle Rd (7.2 acres). Potential for Single Family or Multi-Family with the need for Zoning change.
PRIME DEVELOPMENT OPPORTUNITY ON LAKE ST. IN BLOOMINGDALE. Highly visible location from a 3-way stop light intersection located just West of Bloomingdale Rd. Prime 614 feet of frontage. Potential for Multi-family, townhomes, Senior Housing, Commercial, Medical, or Office. Property is 3.55 acres and currently zoned B-3. Previously approved by Village for Senior Housing Facility. High traffic count on Lake St. exceeds 40,000 vehicles per day. Desirable Bloomingdale School District 13 & Lake Park High School District 108. Convenient to Expressway access, Metra Train, and O'Hare Airport.
Attention Builders, Investors, and anyone looking to build their dream home. This lot is close to everything shopping, dinning, and highway access. All utilities are nearby. Run your numbers.
Tired of Yard Work! Want More Play Time! Introducing Springfield Place, An Exclusive Enclave of 23 Homesites, of which 13,Homesites are Sold, and 11 Homes Built! These are 0 Lot Homesites, with an Association which provides for Lawn Maintenance and Snow removal ! There are no Age Restrictions! You Can Purchase the Lot Outright and Use Your Own General Contractors or Employ the Services of WK Home Builders! Build your Dream Home! Ranch Homes Only Can be Built and Do Require Brick Exterior! Highly rated Bloomingdale School District 13/108. Minutes to Metra and Lake Street Extension and I-355! Awesome Springfield Park Directly to the East of the Subdivision! Contact Listing Agent Regarding Ot
Redevelopment opportunity in the heart of the Bloomingdale Commercial district on 2 buildable acres of land located just South of Stratford Square regional mall, across the street from Lowe's and just East of Costco. Subject property is located on Army Trail Rd. just west of Gary Avenue. Currently zoned as B-4/SU/PD, Bloomingdale would consider re-zoning the property to B-3, General Business District. Already approved for for a Hospice Care Facility but Village open to other development. Owner willing to Build to Suit.
CAN'T FIND THE HOME OF YOUR DREAMS? IT'S TIME TO BUILD! OVER 1/2 ACRE LOT. CUL DE SAC/DEAD END STREET WITH HOMES BUILT IN THE LAST 20 YEARS OR SO. GREAT LOCATION WITH ROOM TO ROAM IN THIS GREAT COUNTRY ATMOSPHERE, YET CLOSE TO SHOPPING, DINING, AND EXPRESSWAYS. EXCELLENT AND HIGHLY DESIRED SCHOOL DISTRICTS 13 AND 108. THE BEST OF ALL WORLDS! SELLER OF HOME TO THE WEST WOULD ALSO BE INTERESTED IN SELLING IF IT WAS A PACKAGE. CALL LISTING AGENT FOR DETAILS.
Based on information submitted to the MLS GRID as of Thu May 02 2024. All data is obtained from various sources and may not have been verified by broker or MLS GRID. Supplied Open House Information is subject to change without notice. All information should be independently reviewed and verified for accuracy. Properties may or may not be listed by the office/agent presenting the information.
School data is provided by GreatSchools, a nonprofit organization. Redfin recommends buyers and renters use GreatSchools information and ratings as a first step, and conduct their own investigation to determine their desired schools or school districts, including by contacting and visiting the schools themselves.Redfin does not endorse or guarantee this information. School service boundaries are intended to be used as a reference only; they may change and are not guaranteed to be accurate. To verify school enrollment eligibility, contact the school district directly.
Bloomingdale, Illinois offers a variety of transportation options, including a robust public transportation system. The village is served by Pace Bus, which provides convenient and reliable bus services. For those who prefer to drive, traffic levels in Bloomingdale can range from moderate to heavy, especially during rush hours. Additionally, Bloomingdale is conveniently located near several major highways, including Interstate 355, making car travel to neighboring cities and towns efficient. Learn more on our Bloomingdale city guide.
What types of properties are available in Bloomingdale?
Bloomingdale, Illinois offers a variety of single-family home types, including ranch-style homes, split-level homes, and contemporary homes, among others. These homes can be found throughout the town, with many located in established neighborhoods and newer developments. Most properties feature 3-4 bedrooms and were built in various years. To explore different property types for sale in Bloomingdale, Illinois, use the 'Home type' filter located above the active listings. Customize your search by selecting options like single-family homes, condos, townhomes, and more.
What is life like in Bloomingdale?
Bloomingdale, Illinois offers a peaceful and tranquil living experience with its picturesque landscape. The region boasts a variety of natural beauty, including lush green parks, serene lakes, and charming walking trails. The weather in Bloomingdale is characterized by distinct seasons, with warm summers and cold winters, allowing residents to enjoy a diverse range of outdoor activities throughout the year. The town provides a range of job opportunities across various industries, ensuring a thriving local economy. Residents can engage in a vibrant social scene, with numerous entertainment options such as dining at local restaurants, exploring boutique shops, and participating in community events.
What are the schools and amenities like in Bloomingdale?
Bloomingdale, Illinois offers a variety of public amenities to cater to the lifestyle needs of its residents. The town boasts a number of restaurants, providing a range of culinary options. For outdoor enthusiasts, there are several parks available for leisure and relaxation. Daily necessities can be easily obtained from the local grocery stores scattered throughout the town. Additionally, the town provides other amenities such as fitness centers, libraries, and shopping centers for the convenience of its residents.
In the past month, 30 homes have been sold in Bloomingdale. In addition to houses in Bloomingdale, there were also 18 condos, 28 townhouses, and 1 multi-family unit for sale in Bloomingdale last month. Bloomingdale is a minimally walkable city in Illinois with a Walk Score of 43. Bloomingdale is home to approximately 22,083 people and 15,049 jobs. Find your dream home in Bloomingdale using the tools above. Use filters to narrow your search by price, square feet, beds, and baths to find homes that fit your criteria. Our top-rated real estate agents in Bloomingdale are local experts and are ready to answer your questions about properties, neighborhoods, schools, and the newest listings for sale in Bloomingdale. Our Bloomingdale real estate stats and trends will give you more information about home buying and selling trends in Bloomingdale. If you're looking to sell your home in the Bloomingdale area, our listing agents can help you get the best price. Redfin is redefining real estate and the home buying process in Bloomingdale with industry-leading technology, full-service agents, and lower fees that provide a better value for Redfin buyers and sellers.


 REDFIN IS COMMITTED TO AND ABIDES BY THE FAIR HOUSING ACT AND EQUAL OPPORTUNITY ACT. READ REDFIN'S FAIR HOUSING POLICY AND THE NEW YORK STATE FAIR HOUSING NOTICE.
 United States
 Canada