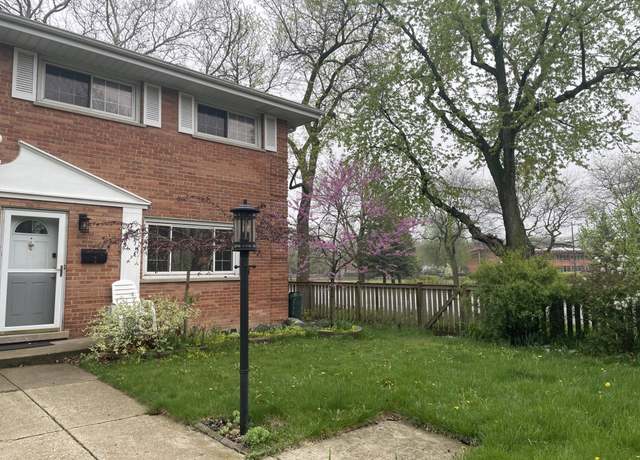
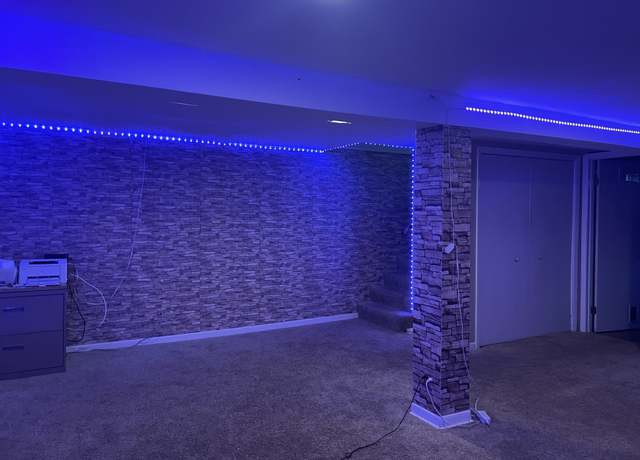
NO Assessment Fee. Rarely available all brick end unit TownHouse with big front, back and side yards. Near Old Orchard Mall close to shopping, restaurant, supermarket, transportation, highway, gym and hospital. Spacious living/dining room with beautiful hardwood floors. Large front & west end windows providing abundant natural light. Skylight above stairs. Kitchen with corian counters, SS appliances. 2nd level features 3 bedrooms with hickory hardwood floors and a large hall bath. Finished rec/family room and laundry in basement. Backyard with brick paver patio, garden & green space ideal for entertaining. Private fence with easement for garbage pickup. Extra storage shed for or
Jumbo 3 Bedroom Brick Bungalow in McKenzie school district! Formal living room with fireplace. Separate dining room and spacious kitchen. 1st floor office and family room. 2nd floor has three bedrooms and a full bathroom. Large, unfinished basement and 2 car detached garage. Estate sale, being sold as-is. Village violations available upon request. Buyer to assume and needs to bring property up to code.
Beautiful brick home backing up to gorgeous Wilmette Golf Club. The unbeatable view from the back patio overlooking the 10th hole is just the icing on the cake for this expanded colonial. This home checks all your boxes. .. . spacious primary suite with double walk-in closets and spa like bathroom, 3 additional bedrooms (including another ensuite) with 2 more full bathrooms upstairs. Attached 2 car garage, well equipped "eat-in" kitchen with peninsula seating and lots of counter space, walk-in pantry, formal dining and open family room both overlooking lush backyard with golf course views. Basement has finished "hangout space" as well as a well-organized laundry room and
Don't miss this charming home and the chance to live in this premier east Wilmette location! Located on a quiet dead-end street and just a few blocks to Lake Michigan, Wilmette Harbor, Gillson Beach, Baker School, Northwestern University and so much more! If you're looking for a stately brick home full of architectural details, this is it! You'll find curved archways, exquisite millwork, hardwood floors throughout the first and second levels, built-in bookcases, large room sizes, a newly finished basement and 1 car attached garage. The main floor has soaring ceilings including a large living room with sun-filled French doors and wood burning fireplace and a heated sunroom for your relaxing
Prepare to be charmed by this beautifully constructed 4-bedroom, 2-bath split-level home graced with a sub-basement, nestled in the coveted New Trier High School district of Wilmette. The robust allure of brick welcomes you into a home where high ceilings in the living and dining rooms create an ambience of elegance and open space, perfect for hosting and enjoying life's moments. Anchoring this abode is a tasteful kitchen outfitted with granite countertops and stainless steel appliances, where functionality meets style. Retreat to the lower level, which features a walkout family room paired with a full bath, setting the stage for relaxation and family time. The sub-basement extends your liv
PROPERTY CURRENTLY LEASED UNTIL 8/24. SALE SUBJECT TO LEASE TERMS. Welcome to one of Kenilworth's most elegant and refined homes. At the end of a quiet street, set on TWO EAST KENILWORTH LOTS, this reconstructed historic brick Masterpiece is the fine combination of rarified quality and modern comfort. Luxury and thoughtful design abound in this 5 BR 7.1 BA & 1BR/1BA COACH HOUSE. Details include Sophisticated Storm/flood Control. Tile roof, copper gutters. Basement: 9' high basement w fully-equipped 7-seat Theater, large playroom, 2 laundries- basement/ 2nd Floor. 1st Floor: exquisite custom quarter sawn aged oak hand-carved Library & DR, Plaster work that will take your breathe
Welcome to your dream lakeside retreat. Don't miss out on this incredible opportunity to own a rarely available 2 bedroom, 2 bathroom condo boasting a lakeside balcony with stunning lake views. This gem has been recently updated with brand new carpet throughout and freshly painted walls, creating a cozy and inviting atmosphere. With a spacious living area, generously sized bedrooms, and ample storage space, this condo offers both comfort and convenience. Located in the highly sought-after community of Wilmette, you'll be right across from Plaza del Lago, fulfilling all your shopping desires. An elevator building with a newly renovated lobby, a community room with a patio, and access to a pr
Rare opportunity to indulge in luxury lake living in the highly sought-after East Wilmette location! Enjoy lake breezes in this timeless 6 bed, 5.2 bath renovated English Lannon stone home with an exquisite blend of classic charm and modern elegance. Situated on 1/3 acre of landscaped grounds, this solidly built residence boasts architectural details, grandly-scaled rooms and soaring ceiling heights, creating an impressive and inviting floor plan. From every room, enjoy incredible vistas of the surrounding beauty. The magnificent living room features a handsome wood-burning fireplace, elegant millwork, including crown moldings, and built-ins, opening into the spacious dining room with acces
Welcome to the heart of east Wilmette's CAGE neighborhood! 932 Ashland exudes richness and character without sacrificing openness and light! It lives like a new home with most elements renovated down to the studs in 2017. It has retained the charming elements that make this an architecturally interesting home. The gut-renovation and expansion of this 6 BR, 5.5 Bath home features stunning millwork coffered ceilings, original stained-glass details and built-ins throughout the 4 levels of modern living. The stunning chef's kitchen includes a 10-foot quartzite island, high-end appliances and tons of custom cabinetry. The kitchen opens to the family room with a fireplace anchoring the space an
Spacious and updated 3 bedroom (could be 4 bedroom) and 3.5 bath home with loads of natural light!! Gleaming hardwood floors throughout most of the living spaces. Renovated kitchen and breakfast room feature stainless steel appliances and quartzite countertops. Bright and light sunroom offers loads of natural light which opens to the patio perfect for entertaining ! Lower level has an oversized family room, spacious laundry room with extra refrigerator and as well as a full bath. Second level features huge master suite with ensuite private bath, two more family bedrooms and a hall bath. In addition there is a hallway closet and an oversized cedar closet for off season clothes. Spacious pa
Nestled in the heart of Wilmette's coveted McKenzie School district, this exquisite residence offers a lifestyle of unparalleled luxury and comfort. Step into the grand foyer with its sweeping center staircase, setting the tone for everything this home has to offer. Boasting 5 spacious bedrooms, PLUS a convenient bedroom/home office on the main floor, and 3.5 baths, this home is designed for modern living. The expansive layout offers ample space for both relaxation and entertaining, with a massive finished basement providing a perfect retreat for guests with an ensuite bedroom. The outdoor living spaces are truly exceptional, featuring a large heated pergola and deck that are ideal for host
NEW CONSTRUCTION HOME ON MASSIVE LOT (57x335) in Three-time National Blue Ribbon Romona Elementary School District. Professionally designed home with spectacular upgraded finishes and generous room sizes with hardwood throughout. The Chef's Kitchen and great room are flooded with light making this home ideal for entertaining indoors and out. Enormous backyard (57 x 190) offers endless possibilities to create your dream yard setup. Finished basement has high ceilings w/ Rec Room, Fitness Room, 5th Bedroom and full bath w seated shower. 3-Car plus Garage, Ample Storage, and Smart Home Infrastructure round this one out for even the most discerning buyers. Project by Falcon Development Partners
This updated 6 bedroom, 4 full bath, 2 half bath classic home is located in the prime Indian Hill Estate of Wilmette. The home is 4754 square feet in size and the lot is 23565 square feet which is over a half acre. As you enter the foyer of the home you will find a first floor bedroom with an adjoining full bath on the left. This room could also serve as a den. To the right is the dining room with the original parquet flooring. Straight ahead is the living room with a fireplace. Adjoining the living room is the Family Room with a fireplace and access to the backyard, patio and gazebo. The fully equipped kitchen with a large eating area adjoins the family room. Off the kitchen is Mud Room wi
Beautifully renovated East Wilmette home, with an over-sized lot on a quiet brick street. Stunning custom kitchen with large island, opening to enormous family room, overlooking beautiful yard with built-in fire pit and grill, and bluestone patio. 5 large bedrooms, finished basement with bath. A few steps to golf course, and short walk to Gilson beach, schools, train, and downtown Wilmette dining. Spacious formal dining room and living room. Enormous 75x196 lot. Wilmette has very highly ranked schools, including New Trier High School and private schools.
This Spacious bright 2 Bedroom condo has an outstanding Central Wilmette location near the train, town, shops, restaurants and excellent schools. It's freshly painted and includes updated Anderson thermopane windows and window treatments. The large primary bedroom has 2 closets. The updated Anderson sliding glass door off the living room leads to a spacious, west facing balcony. Eat-in kitchen includes updated appliances. Every room has a large bay with 3 windows that provide ample natural light throughout. Great closet space + Garage and storage locker included. Building is well managed and updates include: elevators (2021), fire alarm (2019); driveways (2016); common area improvements (20
Welcome to your dream home in the heart of Wilmette, near the vibrant downtown with awesome restaurants, shopping, schools, the Metra and more! This expansive updated home offers an unbeatable combination of convenience, comfort, and style - it is a true retreat! Fall in love with the thoughtful combination of architectural significance throughout, coupled with the transitional renovation! Welcome home and enjoy the lovely covered front porch and gracious foyer which lead to the formal living room and sun filled dining room adjoining all areas on the first level. You will find high ceilings, gorgeous updated windows, hardwood floors, updated plumbing, electrical and more! Prepare to be impr
Welcome to 218 Charles Place, tucked away off Skokie Boulevard, this CHARMING, UPDATED, IMMACULATE, FABULOUS TOWNHOME is most desirably located in the complex! 2300 sf, 3 bedroom 3.5 bath, three levels, fenced backyard and more that lives like a single-family home. Boasting sunny and bright, newer gleaming hardwood floors throughout all 3 levels and elegant stairway! The elevated porch leads you to the front door, stepping into the main level, it is the large living room which overlooks the backyard from two large Juliet balcony sliding doors, there's a separate dining room, a new half bath and an eat-in kitchen with granite tops. The top level features a spacious primary bedroom suite w
Check out this newly updated four-bedroom two, two-bath, open-concept home sitting on an 87 X 123 lot! Open concept 1st floor with island, granite counters and SS appliances, and a cozy WB fireplace. Hardwood floors throughout. Main floor also consists of two bedrooms, exposed staircase, a full bath and sliding patio doors leading to an expansive yard. The second level has two bedrooms, one of them has a sliding patio door leading to the roof top over the garage (currently no decking or railings) and an updated full bath. One-car attached garage, no basement. Home is in great condition sitting on a large lot ready for your vision.
Spacious single-family home embedded in desirable central Wilmette cul-de-sac. 5 bedrooms, 3.1 bath featuring large rooms, skylights and custom details throughout. Special features include a grand foyer w/ blue pearl granite and a custom chandelier, attached sunroom and large 1st floor pantry and laundry room. Kitchen boasts quartz countertops, oversized island with seating and breakfast nook. Family room showcases elaborate built-in mahogany cabinets and fireplace. Living room features a marble fireplace, french doors and window seating-area. Large dining room with buffet opens up to quaint sunroom. 1st floor bedroom highlights en-suite updated, full bathroom with granite and walk-in showe
This award-winning home with a stately iron fence and deep wraparound front porch commands the northeast corner of Lake Avenue & 8th Street. Renovated throughout, it is full of high-end amenities and carefully curated finishes. A 2005 gut renovation included replacement of plumbing and electric, as well as new walls, ceilings, and lighting. Then in 2009, architect Jeff Harting designed a significant expansion that seamlessly married the old with the new. Notably, a spectacular skylight now dominates a nuHaus kitchen with professional-grade appliances that serves as a hub for the home with its views to the bluestone terrace and adjacent family room with stone fireplace. In addition to
Welcome home! Located in the heart of Wilmette, 701 Harvard St. offers exceptional value for the money. Known for its award-winning schools, pristine parks and forest preserves, abundance of delicious restaurants, and short drive to Chicago, makes Wilmette one of the best places to call home in Illinois. This home is located perfectly! Just a quick two-mile bike ride or walk will get you to the gorgeous shores of Lake Michigan! This home features 4 bedrooms and 2.5 baths with a spacious detached two car garage. The kitchen was completely remodeled in 2018 and features a huge quartz island with built-in range and heated floors throughout the kitchen and family room! Schedule a showing today
Just starting, new construction by Sterling Wilson Design and Development, located in one of Indian Hill Estates' truly, most beautiful, oversized lots and locations (close to 1/2 an acre). Now is the time to customize and make this house your own. Some enticing features include: family room with cathedral ceiling, 5 bedrooms on second floor plus one in basement, 3 car attached garage, large mud room, large walk in pantry with counter and cabinets, gracious entry, large laundry on 2nd floor, large workout room in basement, finished swing space on 3rd floor, with 3 sets of French doors in the kitchen leading to a large raised patio. Possible additions could be a screened porch, or pool and p
This exceptional new construction by a premier Wilmette builder has wonderful architectural details. This highly upgraded home has tremendous light streaming through it. The stunning KITCHEN features a huge island that has a breakfast bar, quartzite counter & beautiful hanging light fixtures. Top of the line Stainless Steel appliances include a 48-inch Wolfe stove with six burners, griddle and 2 ovens; 48-inch Subzero refrigerator; Sharp microwave, and Bosch dishwasher. There are custom white shaker style cabinets that rise to the ceiling and have soft glide drawers. There is a very large walk-in pantry. The adjacent breakfast space has a built-in bench with storage and room for a tab
You will not see anything like this anywhere else. The Jewel Box of the North Shore. George Maher's "Sutton Home, " meticulously restored. Fireplaces from London, fixtures from Paris, Stained Glass Windows by Giannini & Hilgart, and a supremely rare Lotus Pond Mosaic make this house a rare and precious treasure for the discerning buyer. All modern amenities include:6br/6.5ba home in Prime East Kenilworth. Fully outfitted chef's kitchen, luxurious master bath suite, attached three-car garage, and full finished basement. This property has everything to offer combined with handwork and artistry that cannot be produced today. Walk to desired Joseph Sears (k-80 school), train, an
Seller says Sell! Charming, Modern and Fully Updated House located at the Heart of Wilmette! Award Winning Schools and close to one of the North Shore's finest downtowns! Brand New Windows all around allowing natural sunlight to come in, warm tones, and custom finishes on each corner. Ideal floor plan for all your needs. Soft Closing Shaker Style Cabinets wrapped up into Modern Quartz Countertop. Ultramodern Back-splash, High End Stainless Appliances, Hardwood Floors Extended throughout the entire Home with Recessed and Canned Lighting in every room. Beautiful, Custom Stone surround fireplaces in the Living Room and Lower Level Family Room. Gorgeously renovated Bathrooms feat. Designer Vani
BUILDER'S CUSTOM BUILT COLONIAL - FIRST OWNERS & FIRST TIME ON THE MARKET. HARDWOOD FLOORS ALL OVER. SOLID OAKWOOD STAIRWELL & RAILINGS. DRAMATIC 2 STORY STONE FIREPLACE. 2-ZONED HEATING/AC. DRAMATIC COVED CEILING IN DINING ROOM AND GOURMET KITCHEN WITH ALL STAINLESS STEEL APPLIANCES WITH SLIDING DOOR LEADING TO DECK FOR OUTDOOR EATING. GRANITE COUNTERTOPS W/ BUILT-IN WINE COOLER. PRIMARY BEDROOM WITH HIS & HER'S CLOSETS, JACUZZI & RADIANTLY HEATED FLOOR, ALL BEDROOMS W/ CATHEDRAL CEILINGS EXCEPT BASEMENT. FULL FINISHED BASEMENT IN RADIANT HEATED FLOORING AND BACKUP SUMP PUMP. 2-CAR HEATED GARAGE. SO MUCH MORE. BEAUTIFUL AMENITIES TO VIEW.
Discover the epitome of modern luxury living in this new construction home located in the prestigious neighborhood of Wilmette! This stunning new construction residence features 6 bedrooms and 5.5 baths, offering an expansive 6,300 square feet of meticulously designed space. Every detail is being carefully curated, showcasing all-new finishes that blend sophistication with contemporary style. From the gourmet kitchen to the spa-like bathrooms, this home exemplifies comfort and elegance. With a spectacular and unique parking arrangement you will be able to Indulge in the perfect fusion of upscale living and suburban charm with this unparalleled property.
Ready to occupy first floor in this thoughtfully renovated handsome Italianate two-flat in convenient Central Wilmette. Over 2700 sq ft, completely gutted to the studs and redesigned in 2018-2019 with all new electric wiring and service, 2 new forced-air furnaces and AC condensers, new quality kitchens and baths, Kohler fixtures, new 2 car garage '20, and parking pad for easy turnaround, new patio, totally painted inside and out. Lovely architectural details have been preserved while the living spaces and comfort are up to today's expectations. Consider possibility of conversion to single family! Current flexibility for use as a multi-generational living space or two separate apartments. Ea
Come see this fully updated 6 bedroom 4 bath house in the heart of Wilmette today! Kitchen includes all new soft close cabinetry, brand new Viking appliances, and quartz counters. The house includes two primary suites. The largest primary suite contains a soaker tub and gorgeous separate vanities. There are multiple living rooms for the family to spread out. Plenty of rooms for two offices or a playroom and an office if desired. Home is located just steps away from the elementary, middle school and junior high! It is directly across the street from a beautiful park with a playground, tennis courts and lots of greenery.
Fantastic new construction in Wilmette's sought after McKenzie Elementary. Artfully designed by a national architecture practice and built to the exacting standards of local builder Uncommon Residential. The custom home features 4 +1 bedrooms, 4 full bathrooms, half bath and huge finished lower level. Flow is designed for today's living, maximizing space and natural light. This 4,000+ square foot home includes 10 foot ceilings, expansive Marvin windows and gorgeous hardwood flooring. Chef's kitchen with custom cabinetry, butler's pantry and Thermador appliance package. The primary bedroom includes two walk in closets and luxury ensuite bathroom. Two additional bedrooms on the second level p
Do not miss this spectacular retreat with features and amenities that are outstanding and extensive throughout. 927 Romona Road is a remarkable home coupled with an incredible lifestyle experience. Situated on a 3/4-acre property with over 7,100 SQUARE feet on the first and second levels with a full finished lower level with all that you wish for. Count on falling in love! This beautiful brick home has been completely renovated and expanded by creating state-of-the-art living. Whether you are indoors or outdoors, you will experience privacy, peace, and tremendous space for family and entertainment. In 2002, a transformation to this exceptional home included a three-level addition to the Nor
Perfect large 4 bedroom 3 bath corner home in the much sought after New Trier School District. Truly remarkable open living concept with large living space opening up to formal dining room and open kitchen. Large dining room windows accompany bay window in living room that welcome natural light all day long. Lower level boasts an oversized family room that extends back into brightly naturally lit up area of sliding patio doors. Bonus room is situated next to family room on lower level providing opportunity to customize your daily living world with a private home office, kids room, crafts room etc. .. Convenient full size bathroom also accompanies rooms on lower level along with large laundr
Move right into this 2 bedroom, 2.1 bath condo overlooking Lake Michigan. The gracious wood paneled foyer welcomes you. The spacious living room offers fabulous views of the Lake and the beautifully manicured grounds. There is a large dining room that opens to the balcony. The family room is conveniently located between the dining room and the kitchen. The recently updated white kitchen sparkles. There is a pass through from the kitchen to the family room so it affords great views and easy interaction with family and friends. There is in-unit side-by-side washer and dryer. The large primary suite, has a walk-in closet and an updated bath. The spacious bath has a walk-in shower with a curb-l
This picturesque East Wilmette home is situated in the heart of the CAGE, just blocks from the beach, Gilson Park, the Metra and Plaza de Lago. Its classic colonial style with rich architectural detail and Craig Bergmann landscape design create a welcoming and elegant presence. A lovely bluestone front walkway with brick retaining walls and stairs lead to a terrazzo floored vestibule. The expansive first floor with large windows bathes the home in morning sun and overlooks the professionally landscaped grounds. Beautiful kitchen renovations include Miele and Wolf appliances, marble countertops, a butler pantry with an additional sink and two speed ovens, as well as a new back entryway off
Based on information submitted to the MLS GRID as of Sat May 04 2024. All data is obtained from various sources and may not have been verified by broker or MLS GRID. Supplied Open House Information is subject to change without notice. All information should be independently reviewed and verified for accuracy. Properties may or may not be listed by the office/agent presenting the information.
School data is provided by GreatSchools, a nonprofit organization. Redfin recommends buyers and renters use GreatSchools information and ratings as a first step, and conduct their own investigation to determine their desired schools or school districts, including by contacting and visiting the schools themselves.Redfin does not endorse or guarantee this information. School service boundaries are intended to be used as a reference only; they may change and are not guaranteed to be accurate. To verify school enrollment eligibility, contact the school district directly.
Homes for sale in Wilmette have a median listing price of $887K. Some of these homes are Hot Homes, meaning they're likely to sell quickly.
What are some of the most popular neighborhoods in Wilmette?
Popular neighborhoods include North Evanston, Northeast Skokie, Gross Point, North Shore, Devonshire Woods, Central Street, Siena at Old Orchard, and Optima Old Orchard Woods.
Wilmette, Illinois offers a variety of transportation options, including a robust public transportation system. The village is served by the Metra commuter rail line and the Chicago Transit Authority, providing easy access to downtown Chicago. For those who prefer to drive, traffic levels are typically moderate, although rush hour can be busier. Additionally, Wilmette is conveniently located near Interstate 94, offering a direct route for car travel to other parts of the state. Learn more on our Wilmette city guide.
What types of properties are available in Wilmette?
Wilmette, Illinois offers a variety of single-family home types, including ranch-style homes, split-level homes, and contemporary-style homes. These homes can be found throughout the different neighborhoods of Wilmette, such as East Wilmette, West Wilmette, and Indian Hill Estates. Most properties in Wilmette feature three to five bedrooms and were built between the 1950s and 1990s. To explore different property types for sale in Wilmette, Illinois, use the 'Home type' filter located above the active listings. Customize your search by selecting options like single-family homes, condos, townhomes, and more.
What is life like in Wilmette?
Wilmette, Illinois offers a charming village atmosphere with a mix of residential and commercial areas. The landscape is characterized by tree-lined streets and well-maintained homes. The weather in Wilmette experiences all four seasons, with hot summers and cold winters. Job opportunities are abundant, with a thriving local economy that includes a variety of industries. Residents can enjoy a range of activities, including shopping at local boutiques, dining at diverse restaurants, and exploring the numerous parks and recreational facilities.
What are the schools and amenities like in Wilmette?
Wilmette, Illinois offers a variety of public amenities to cater to the diverse needs of its residents. The region boasts a plethora of restaurants, offering a wide range of cuisines to satisfy all taste buds. For those who enjoy outdoor leisure, there are several parks available for recreational use. Daily necessities can be easily obtained from the numerous grocery stores scattered throughout the area. Additionally, Wilmette provides other amenities such as fitness centers, libraries, and public transportation facilities, ensuring a comfortable and convenient living experience for all residents.
In the past month, 43 homes have been sold in Wilmette. In addition to houses in Wilmette, there were also 14 condos, 6 townhouses, and 2 multi-family units for sale in Wilmette last month. Wilmette is a moderately walkable city in Cook County with a Walk Score of 58. Wilmette is home to approximately 26,972 people and 7,888 jobs. Find your dream home in Wilmette using the tools above. Use filters to narrow your search by price, square feet, beds, and baths to find homes that fit your criteria. Our top-rated real estate agents in Wilmette are local experts and are ready to answer your questions about properties, neighborhoods, schools, and the newest listings for sale in Wilmette. Our Wilmette real estate stats and trends will give you more information about home buying and selling trends in Wilmette. If you're looking to sell your home in the Wilmette area, our listing agents can help you get the best price. Redfin is redefining real estate and the home buying process in Wilmette with industry-leading technology, full-service agents, and lower fees that provide a better value for Redfin buyers and sellers.


 REDFIN IS COMMITTED TO AND ABIDES BY THE FAIR HOUSING ACT AND EQUAL OPPORTUNITY ACT. READ REDFIN'S FAIR HOUSING POLICY AND THE NEW YORK STATE FAIR HOUSING NOTICE.
 United States
 Canada