Welcome to 31 Bunkerhill Drive ideally set among tall trees on quiet country lane. This original Farm Ranch was expanded to a Two Story Colonial. Situated on a flat and fully fenced acre of lush lawn, it's an ideal canvas for your outdoor dreams; ample space to customize. Freshly painted interior is updated with hi-hat lighting new interior doors and 2.5 new bath and hardwood flooring. From the exterior this home exudes curb appeal and offers a lifestyle of comfort and convenience. Don't miss the opportunity to make this amazing property your own!
Location! Location! Huntington Village 1927 3 Bedroom, 2 Full Bath Cape Charmer will steal your heart at the first look. 9.5' ceilings and granny porch with swing. Immaculate and pristine interior updates include: 2018 Andersen windows, updated electric 200 amp, 60 amp sub panel in the heated oversized 2 car+ garage with walk-up storage. High-end custom molding and crown molding, new doors throughout, hardwood floors. LED high-hats. Freshly painted. Beautiful new wood-burning marble fireplace. New lighting fixtures/ chandeliers and ceiling fans. Large and welcoming windows include custom blinds. Gorgeous bright white 2022 kitchen is stunning-generous sized cabinets/glass doors and brass cab
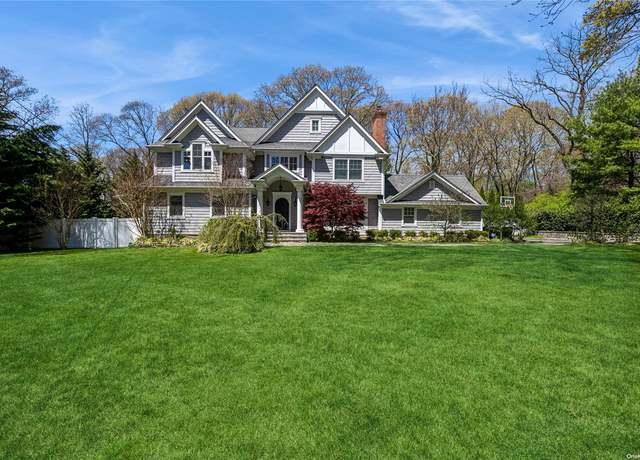
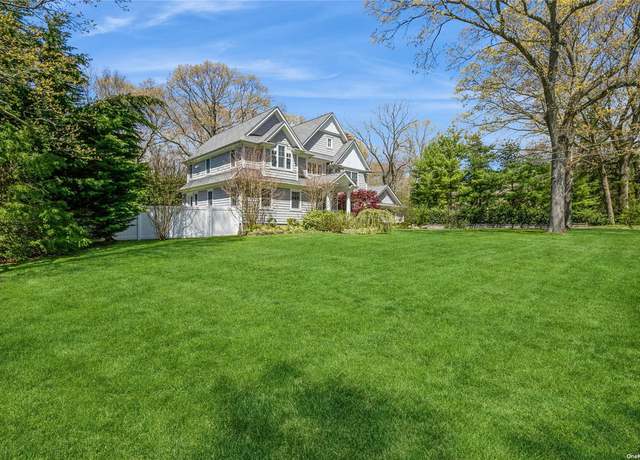
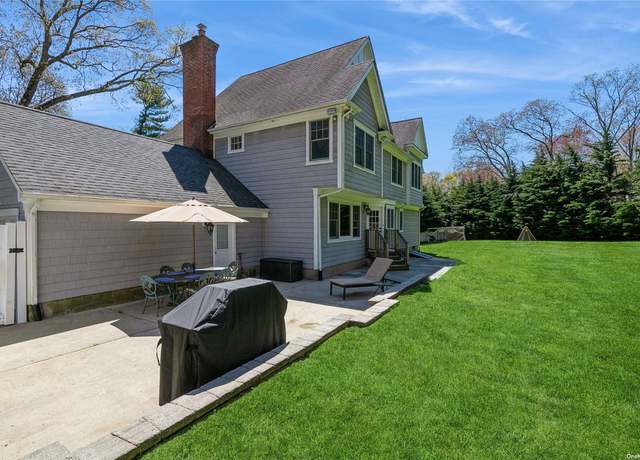
At the heart of Huntington's highly sought after Salem Ridge Section lies this customizable 3 bedroom 2.5 bath home. Located on a private level acre in the Harborfield's School District, this property speaks pride of ownership. Prepare to entertain alongside manicured gardens, park like views, and nature. Enjoy your spacious formal living/dining room, eat-in kitchen and den with wood burning fireplace. Full finished basement features playroom, living space, workspace, and plenty of storage. Don't miss this amazing opportunity for an exceptional lifestyle and your chance to make this the perfect home to create your own memories.
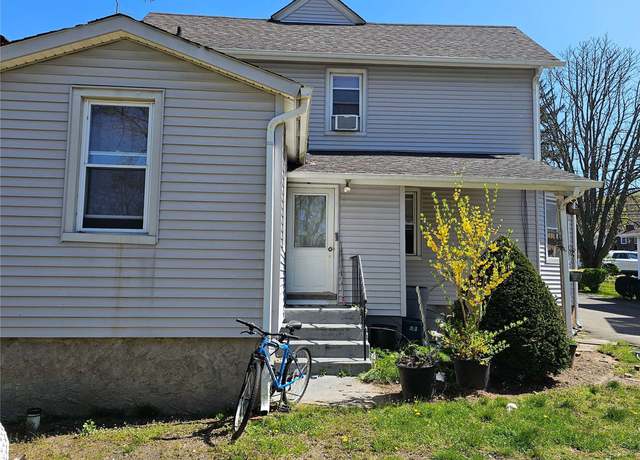
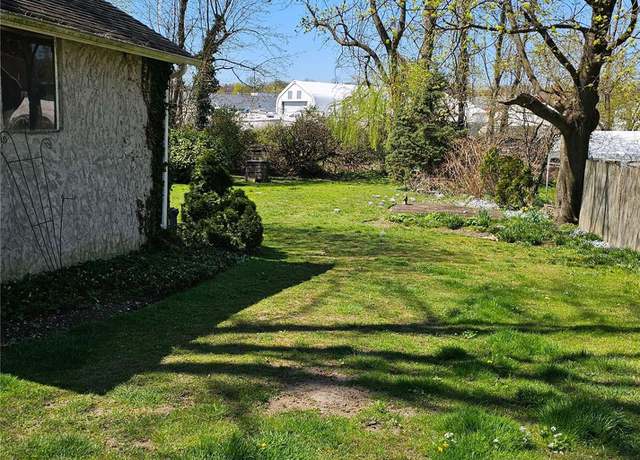
First Floor Entry To Living Room With Bay Window & Wall To Wall Carpet. Large Eat-In Kitchen With Huge Pantry, Built-Ins, & Door To Basement. Small Bedroom With Huge Closet. Full Bath With Tub, Door To Backyard, Larger Bedroom With Large Closet, Full Basement With Oil Tank (New), 2 Hotwater Heaters & Meters, Bilko Doors. Second Floor Entry Living Room, Wall-To Wall Carpet, 2 Bedrooms, Full Bath With Shower Stall, Eat-In Kitchen. Detached 2 Car Garage, Large Flat . 25 Acre, Wraparound Porch. Tenant Pays Electric. 2 Meters, Gas For HW Heater. 2nd Floor Gas Stove, 1st Floor Electric.
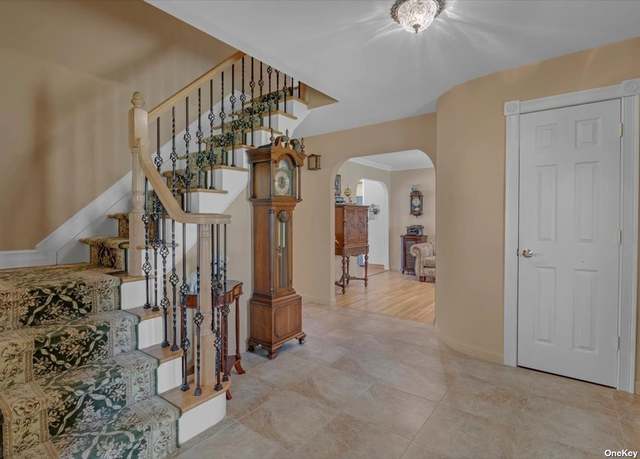
This one of a kind, sprawling expanded Colonial boasts 4 bedrooms and 2.5 bathrooms and is located in the bell of the court. Step inside to discover the epitome of luxury living. The grand foyer welcomes you with an impressive staircase, setting the tone for the elegance that awaits. The bright and spacious eat-in kitchen features picturesque views and sliders to the woodland settings of mature landscaping, Koi pond complete with foot bridge plus views to one of the two wood-burning fireplaces. Formal living and dining rooms provide the perfect space for entertaining guests, while the main floor laundry room ensures convenience. For those who work from home, the home office features charmin
This Stunning 2 Bedroom, 2 Bath Home Is Perfectly Situated In The Heart Of The HBCA. Just Minutes to beaches, Huntington And Northport Village. Most Every Inch Of This Home Has Been Meticulously Planned And Renovated. A Light Filled Eat In Kitchen Is A Chefs Dream With Quartz Countertops And Stainless Steel Appliances. Both Full Baths Have Been Tastefully Renovated With Heated Floors. Most Of The Big Ticket Items Were Done In 2023 To Include Double Pane Windows, Central Air, Plumbing, Siding And So Much More. Super Low Taxes! Some Pictures Have Been Virtually Staged As Well As The Lawn Has Been Virtually Altered. Come Take A Peek. I Love This Home And So Will You!
Amazing Opportunity For This This Sought After Charming Home On Cul-De-Sac. Private Setting, Wonderful Move In Ready, With Private Yard For Your Enjoyment. Home Is Much Larger Than Appears With Extended Living Space, 3 Beds Including Guest Room/Office, Living Room, Dining Room With Wood Burning Fireplace, Fenced Property, Totally Secluded, Low Taxes. Enjoy The Harbor And Village Lifestyle At Its Best In This Cozy Comfortable Home.
Welcome to this Charming Colonial Style Home in Huntington on a Quiet Cul-de-sac with Sidewalks and Sewers in Close Proximity to the Village of Huntington and LIRR Train Station. Enter from Front Covered Porch into a Foyer which leads to an Open Floor Plan with a Living Room with Gas Fireplace, creating a cozy ambiance perfect for relaxation and gatherings that connects to a Formal Dining Room & Kitchen with Granite Countertops and Stainless Steel Appliances with Plenty of Space for Counter Seating at Island. Powder Room and Separate Laundry Area with entrance to One Car Garage with Electric Car Charger. Sliders off Living Room to a New Paver Patio with Gazebo Covering overlooking Fe
A must see!! Quaint Cape in updated condition. Move right in to this lovely home with updated kitchen and bath, hardwood floors and manicured Landscaping. Also has ample closet space and full finished basement with laundry room and additional half bath. Currently a 2 bedroom with room to expand with proper permits. Huntington address in Harborfield school district.
Listing by: Property Owner (631) 987-8144 Situated on a quiet double cul-de-sac within Harborfields School District this one acre park-like property boasts specimen plantings, pool, cabana and sports court. High end details - copper gutters, Hardie siding, mahogany porch, loggia and detached 2.5 car garage add to the exterior beauty of this home. Inside, you will find a chef& apos; s kitchen, including a wood burning pizza oven, Woodmode cabinetry, oversized island and top of the line appliances. Along with a custom wine room and library, the main floor is complete with a large family room, powder room and library. 4 bedrooms, bathroom and an expansive, primary suite are located on
Step into the epitome of contemporary elegance with this meticulously updated five-bedroom, three-and-a-half-bathroom home. As you cross the threshold, you're immediately struck by the seamless blend of modern design elements and timeless sophistication leading you into the heart of the home and polished hardwood floors. The expansive open-concept living area beckons, featuring a chic fireplace framed by sleek accent wall and oversized windows and skylights that flood the space with natural light. Entertain guests in style in the adjoining dining area, where conversations flow effortlessly against the backdrop of panoramic views. Upstairs, the opulent master suite awaits, offering a serene
This turn-key 3 bedroom 2 bath home sits on over a half and acre. Newly renovated kitchen with all high end appliances, makes for perfect entertaining. Oversized L/R, with a beautiful stone wood burning fireplace, which leads into the D/R. Wood floors throughout. The other end of the house has 3 bedrooms with a bath. Above ground lower level is very spacious and ideal for in home office, or playroom, with another wood burning fireplace. Lower level leads into the 1 car garage for convenience.
Nestled Along a Tranquil One-Lane Rd. , this Charming Ranch Exudes Warmth & Welcome from the Moment you Arrive. Its Open-Concept Creates a Seamless Flow between Living Spaces, Enhanced by Hardwood Floors. Natural Light Floods the Home through Lge. Windows, Casting a Glow that Highlights the Beauty of each Rm. The primary Bedroom Offers a Full Bath, providing Comfort & Convenience. The Full Unfinished Basement w/ its High Ceilings & OSE Opens up a World of Possibilities, whether for Additional Living Space, a Workshop, or Creative Endeavors. A Functional Laundry Rm. Adds Practicality to Daily Routines. Updates Incl. 200 amp Electric, Burnham Oil Burner & an Above-grou
Nestled near beautiful Huntington Bay and minutes to Huntington Village, this unique condo boasts 3 bedrooms, 3.5 baths and a private entrance. Built in 1928 as an elementary school, this unit sits amongst only 9 in a beautifully maintained stately brick building known today as Nathan Hale Manor Condominiums. The condos were built in the schools interior after its sale in the 1980's. Large living room, fully renovated kitchen/dining room with built in island. Sliding glass doors, high ceilings and brand new flooring. Main living area also includes a 1/2 bath and laundry room. Lower level contains a large recreation/family room with beautiful plantation shutters, a bedroom and a full bath. C
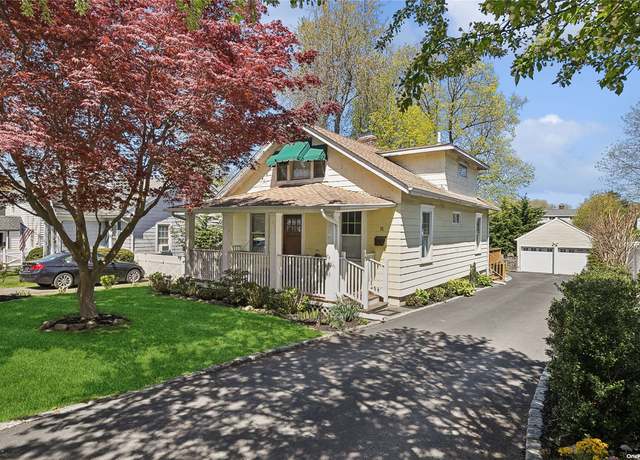
Charming 2/3 Bedroom Craftsman Style Cape with Incredibly Low Taxes. Conveniently Located Minutes From Downtown Huntington Village, Heckscher Park, The Long Island Rail Road and Town Beaches. The Private Driveway Provides Off Street Parking with Room for a Detached Garage. The Layout Includes an Enclosed Front Porch, Spacious Living Room, Formal Dining Room, Eat In Kitchen, Powder Room, 2 Bedrooms, Full Bath, and an Office/Nursery. New roof 2013, new cesspool 2020, security system 2019. Why Rent When You Can Buy? Taxes $6600.
This home is great for entertaining or large family gathering. In 2001 a large 2 story addition was added that complements the original structure. Enjoy the blend of elegant tile and hardwood floors, creating a warm ambiance throughout. The kitchen features top-of-the-line Bosch stainless steel appliances. Vaulted ceilings to the second floor enhance the sense of spaciousness, and the attached floor plan reveals potential for a fourth bedroom or versatile home office. Anderson windows provide abundant natural light and scenic views. Noteworthy features include a newer 4-zone oil heating system, an indirect hot water heater, CAC compressor only a year old, and a 2 1/2 car detached garage. St
Step into this stunningly renovated split-level ranch, nestled within the Harborfields School District. Featuring 3 bedrooms and 1.5 baths, every inch of this residence has been artfully redesigned to deliver unparalleled comfort and sophistication. Enjoy a host of upgrades that include a new roof, siding, Andersen windows, accompanied by a sleek modern kitchen complete with new cabinets, countertops, and appliances. Delight in the luxury of two brand-new baths, gleaming hardwood floors, upgraded 200 amp service, and a new heating system. Entertain in style with a formal living room, sun-drenched den, and a fully finished basement offering endless possibilities. Situated on a tranquil mid-b
Fabulous 4 BR, 2.5 Bath, Victorian styled Center Hall Colonial in Harborfields is majestically nestled at the end of a cul de sac. This custom built home offers a spacious layout with formal entry and high ceilings. Thoughtfully designed with custom details throughout. Enjoy spectacular entertaining space both inside & outside. Amazing features include an expansive wrap around porch, private yard area with in ground pool & large patio area, pickleball/sport court plus so much more! Additional features include Gas heat, Central Air Conditioning, attached two car garage, walk up attic with high ceilings & loads of storage and full basement. Harborfields SD#6 , Close to Vill
Contract Vendee - DRIVE BY ONLY. Welcome to your future oasis in the prestigious West Hills, where nature meets elegance on a grand scale. This extraordinary property spans 33.5 acres, comprised of 26.5 acres of lush woodland and 7 acres reserved for crafting your own dream home. Seize this once in a lifetime opportunity to customize your own masterpiece. Contact us now to embark on your journey to an exclusive retreat. Existing structure needs total renovation.
Classic updated Mid-Century Modern ranch home with sleek lines, steel and concrete construction where natural light abounds bringing the outside beauty inside with two levels of living space. Tall ceilings, open spaces, totally updated with fine finishes, mostly new windows, nooks and crannies, 2 stone wood burning fireplaces, wood floors, Gas heat, IGS, CAC, 2 car garage, full finished lower level with sliding patio doors to the bluestone patio and resort style 20x40 IGP-perfect backyard for relaxing, entertaining and summer fun in a very private landscaped setting! 1st level features updated kitchen, formal dining room, den, family room with wood burning fireplace, Master ensuite with re
Enjoy coastal living in this recently renovated Farmhouse greeted by covered front porch in the Beachcroft Association (dues) with dock and mooring rights nearby. Enter to living room and sitting area featuring hardwood floors, crown mouldings and many windows throughout providing an abundance of natural light. Chic eat-in kitchen with stainless steel appliances, gas cooking, center island, quartz countertops, and dining area, plus adjoining sunroom. Built-in speakers throughout main living areas and spacious family room with built-in beverage bar, full bathroom, and laundry/mudroom with access to 1 car garage complete the first level. Second level encompasses 4 bedrooms including primary e
Move right in to this updated and meticulously maintained sun-filled Ranch-style home on 1 acre. Front covered porch leads to foyer with 2 coat closets and opens to living room with large bay window, and hardwood floors and crown mouldings in most rooms. Eat-in kitchen with professional appliances, custom cabinetry, granite countertops, prep sink, and wine fridge. Dining room adjoins family room with fireplace, access to 2 car garage and glass sliders to deck and patio with jacuzzi and fire pit. Four bedrooms including primary en-suite with luxurious bathroom featuring radiant floor heat, and one bedroom with large walk-in closet. Laundry and full hall bathroom complete the main living spac
Must see this one of a kind Home designed for a Large family or an extended family. The main house is a 4 Bedroom 3 Full Bath Hi Ranch with a full unfinished basement and a 2 car attached Garage nestled on almost a half acre fully fenced landscaped entertaining backyard with Large Deck, retractable awning, Semi inground pool, hot tub and a fire pit. . Home consists of an Eat in Kitchen, Dining room and Livingroom, Large Master suite w/ Full Bathroom and walk in closet, as well as 2 large bedrooms downstairs has a family room with a fireplace and the 4th bedroom. An addition was added in 2006 for mom. Large eat in Kitchen, Livingroom, Full Bathroom/laundry room, 2nd floor has 2 nice size bed
Bay Hills Beach & Tennis Association. .. 4 BR. .. 3 Full Bath. .. Updated Spacious Family Home with Separate Guest Suite. .. 2 Fire Places. .. Center Island Kitchen. .. Hardwood Floors Throughout. .. Beautifully Landscaped Private Backyard with Inground Pool. .. 2 Car Garage. .. New Roof. .. CAC. .. Gas Heat. .. Diamond Condition! A Must See!
Welcome to 64 Southdown Road in Huntington. This colonial style home offers 4 bedrooms and 2.5 bathrooms, Enjoy and appreciate the privacy of this property set back from the road and nestled on a spacious lot spanning . 61 acres. Step inside the home to discover many upgrades. The eat-in kitchen features granite countertops and plenty of storage. Enjoy the convenience of a primary walk-in closet, formal dining room, laundry on first floor and so much more. With central AC and gas heat, comfort is assured year-round. The attached 2 car garage and driveway offers ample parking for guests. Unwind on the patio or porch, overlooking the serene partially wooded yard. A fenced pet run is great for
NEW CONSTRUCTION! 4BR, 2.5BTH Colonial. Oak floors, Custom built-Ins, custom millwork and moldings, fully landscaped and sodded, convenient location, Estimated 2024/2025 real estate taxes (12/1/24 - 11/30/25) - $16,600 (this estimate is based on the most current tax rate available and does not include the Basic Star Program)
Welcome to this rare and special find - a Hampton-style townhouse located within the private gates of the Briarwood community. This sought-after complex offers a beautifully landscaped development with newly resurfaced tennis court, new roof, snow removal, and easy living, just blocks away from Huntington Village with top restaurants, shopping, and entertainment. This corner unit boasts privacy, a covered front porch, a 2-story entry foyer, a great room with high ceilings, walls of glass, and a gas fireplace. The open and airy dining room leads to outdoor decks, and a new custom kitchen completes the first floor - ideal for entertaining. Upstairs you'll find a primary suite retreat with a s
potential M/D w/ Proper permits! spacious living room with large windows & fire place bathed in natural light, large dining area flowing seamlessly into a Florida room ideal for relaxing or entertaining guests, 4 large bedrooms, 2.5 baths, a partial basement for storage or additional living space, and modern appliances are installed throughout / 2 care garage Outside: picturesque garden oasis, complete with a tranquil fishpond offering the perfect spot to unwind and enjoy the outdoors. low taxes.
Welcome to this charming cape on a quiet street in Cold Spring Harbor. It sits on a wooded third of an acre. The home features four bedrooms, three full baths and a two car garage. The main floor has a true open concept. The entry foyer leads to a large living room/dining room area with a wood burning fireplace. Additionally, there is a bright and sunny family room overlooking the kitchen with beautiful views of the rear yard. There are two nice size bedrooms on the main floor, including the primary, with ample closet space and a large hall bath. Upstairs you will find two large bedrooms and another ample sized bath. The basement is unfinished and houses the components, laundry, ample stora
$699,000
4 beds3 baths— sq ft0.33 acre (lot)
65 Woodchuck Hollow Rd, Cold Spring Harbor, NY 11724
GREAT LOCATION, corner lot, Harborfields SD#6 (Blue Ribbon School). Kitchen w/ ss appliances. Living room with fp & vaulted ceiling. Hardwood floors, full finished basement. Anderson windows, 200 amp electric. Fully fenced, trellis covered patio, semi inground heated pool with wrap around deck & new liner. Large shed.
Nestled in the heart of Huntington Station, this delightful 2 bedroom, 2 bathroom colonial-style home offers an ideal blend of comfort, convenience, and classic suburban living. The home boasts wood floors, new Kitchen and bathrooms, a Mitsubishi split AC unit and Anderson windows completed in 2017. The Burnham Gas Burner was replaced in 2012. The roof was redone in 2020. The home has an open concept layout for seamless living and entertaining with a well-equipped kitchen with modern appliances. The Private fenced backyard is perfect for outdoor enjoyment. Convenient location near shopping, dining, and transportation. The home is a great option for commuters to NYC.
Presenting a once in a lifetime opportunity, spanning over 1 acre. At 3200sq. this residence is crafted with the finest materials and an unwavering attention to detail. Walls of glass overlook a huge yard and custom tri-fold doors open to your own private oasis. Featuring soaring ceilings, expansive living and dining spaces, that evoke a sense of elegance. Every corner exudes luxury, from the multi-car garage to the grand bedroom suites, to the book-matched quartzite. Featuring wide plank wood floors and double 8 burner gourmet induction cooktops. Perfect for entertaining, the outdoor areas are also meticulously sculpted and crafted for the discerning home buyer. Private Inground Custom Gun
Experience Tranquil Huntington Living! Step into this exquisite 4/5 bedroom, 2.5-bathroom Colonial nestled on a spacious . 26-acre lot at the end of a peaceful cul-de-sac. Located between Halesite and Huntington Bay, this meticulously designed home is a true gem, boasting high-end finishes throughout. The interior features spacious rooms adorned with gleaming hardwood floors and solid mahogany & cherry doors, creating an inviting and luxurious atmosphere. The chef's kitchen is a culinary delight, equipped with professional-grade stainless steel appliances, a generous island with a breakfast bar, walk-in pantry, and gas cooking. Recent updates ensure modern comfort and peace of mind. O
GREAT CUL-DE-SAC LOCATION CUSTOM 4 BEDROOMS 3 BATHS 1.33 FLAT PARK LIKE ACRE GAZEBO AND TENNIS CT BRAZILIAN CHERRY FLOORING 3 ZONE RADIANT HEAT CUSTOM MOLDINGS THRU OUT OPEN FLOOR PLAN WITH OVERSIZED ROOMS PRO PICS TO FOLLOW
Updated one story ranch with a circular driveway, finished basement, fenced in yard and oasis backyard with in ground pool, what more can you ask for?!?! Basement has separate outside entrance and at one point had it's own electric meter. Central AC, hardwood floors, skylights, wood burning fireplace, new appliances, energy efficient high hats with dimmable switches throughout! Oil tank was recently replaced! Perfect move in ready home for all types of buyers! Downsizing? Up-sizing? Looking for your forever home? This is one you DO NOT WANT TO MISS!
This meticulously designed Bayberry Estate Farm Ranch exudes an aura of timeless elegance and sophistication in every corner. Its remarkably expanded spaces and thoughtfully crafted floor plan make it a true haven for those who love to entertain. Step inside to discover open-concept areas, including a double wall fireplace, full bar with serving area, thoughtfully designed to comfortably accommodate four guests. Bathed in natural light, thanks to nine skylights that grace the home, and adorned with walls of glass, the Living Room, Dining Room, Summer Room, Den, and Study all offer captivating views of the meticulously landscaped rear decks and tranquil pond water features. The generously pr
Charming Huntington Village Colonial with Cottage. Main House Newly Renovated Within The Last Year. Beautiful New Kitchen, Stainless Steel Appliances, Gas Cooking, Island, and Plenty of Storage. Bathrooms, Bedrooms, Wood Floors and Hot Water Heated updated as well. Cottage Has CO, Must Be Occupied by Family Member or Caretaker. New Owner Must Re-Apply. Inground Pool With New Liner, Oversized Driveway, Inground Sprinklers, and Carport. Located Minutes From The Heart of Huntington Village and Less Than A Mile From The LIRR. Enjoy Everything The Village Has To Offer! Close To Shops, Restaurants, Nightlife and Much More.
Based on information submitted to the MLS GRID as of Sat Apr 27 2024. All data is obtained from various sources and may not have been verified by broker or MLS GRID. Supplied Open House Information is subject to change without notice. All information should be independently reviewed and verified for accuracy. Properties may or may not be listed by the office/agent presenting the information.
This area's enrollment policy is not based solely on geography. Please check the school district website for more information.
Elementary schools
Middle schools
High schools
GreatSchools Summary Rating
6/10
Flower Hill School
Public, K-3
5/10
Southdown School
Public, K-3
4/10
Woodhull Intermediate School
Public, 4-6
4/10
Jack Abrams Stem Magnet School
Public, 4-6 • Choice school
-/10
Washington Drive Primary School
Public, K-2
School data is provided by GreatSchools, a nonprofit organization. Redfin recommends buyers and renters use GreatSchools information and ratings as a first step, and conduct their own investigation to determine their desired schools or school districts, including by contacting and visiting the schools themselves.Redfin does not endorse or guarantee this information. School service boundaries are intended to be used as a reference only; they may change and are not guaranteed to be accurate. To verify school enrollment eligibility, contact the school district directly.
Huntington, New York boasts a robust transportation system with a variety of options for residents. The town is served by an efficient public transportation network, including buses and trains, providing convenient travel throughout the region. For those who prefer to drive, traffic levels can be high during peak hours, but the town's well-maintained roads and highways make commuting by car a viable option. Notably, Huntington is easily accessible via several major highways, including the Northern State Parkway and the Long Island Expressway, connecting it to other parts of New York.
What types of properties are available in Huntington?
Huntington, New York offers a variety of single-family home types, including ranch-style homes, colonial-style homes, and contemporary-style homes. These homes can be found throughout the different neighborhoods of Huntington, such as Huntington Village, Huntington Bay, and Cold Spring Harbor. Most properties in Huntington feature three to five bedrooms and were built between the 1950s and present day. To explore different property types for sale in Huntington, New York, use the 'Home type' filter located above the active listings. Customize your search by selecting options like single-family homes, condos, townhomes, and more.
What is life like in Huntington?
Huntington, New York offers a charming and picturesque living experience with its diverse range of landscapes. The region is known for its beautiful coastal areas, rolling hills, and lush green spaces. The weather in Huntington varies throughout the year, with warm summers and cold winters, providing residents with a distinct seasonal experience. The town provides a range of job opportunities across various industries, ensuring a vibrant local economy. Residents can engage in a multitude of activities, such as exploring local parks, enjoying outdoor recreational activities, and taking advantage of the town's vibrant arts and cultural scene.
What are the schools and amenities like in Huntington?
Huntington, New York, is a town rich in public amenities to cater to the lifestyle needs of its residents. The town boasts numerous restaurants, offering a variety of cuisines to satisfy diverse culinary preferences. Outdoor enthusiasts will appreciate the numerous parks available for recreational activities. For daily necessities, residents can rely on the several grocery stores spread across the town. Additionally, the town offers other amenities such as libraries, fitness centers, and shopping centers to ensure a comfortable and convenient living experience.
In the past month, 9 homes have been sold in Huntington. In addition to houses in Huntington, there were also 3 condos, 1 townhouse, and 1 multi-family unit for sale in Huntington last month. Huntington is a minimally walkable city in Suffolk County with a Walk Score of 36. Huntington is home to approximately 18,159 people and 13,111 jobs. Find your dream home in Huntington using the tools above. Use filters to narrow your search by price, square feet, beds, and baths to find homes that fit your criteria. Our top-rated real estate agents in Huntington are local experts and are ready to answer your questions about properties, neighborhoods, schools, and the newest listings for sale in Huntington. Our Huntington real estate stats and trends will give you more information about home buying and selling trends in Huntington. If you're looking to sell your home in the Huntington area, our listing agents can help you get the best price. Redfin is redefining real estate and the home buying process in Huntington with industry-leading technology, full-service agents, and lower fees that provide a better value for Redfin buyers and sellers.


 REDFIN IS COMMITTED TO AND ABIDES BY THE FAIR HOUSING ACT AND EQUAL OPPORTUNITY ACT. READ REDFIN'S FAIR HOUSING POLICY AND THE NEW YORK STATE FAIR HOUSING NOTICE.
 United States
 Canada