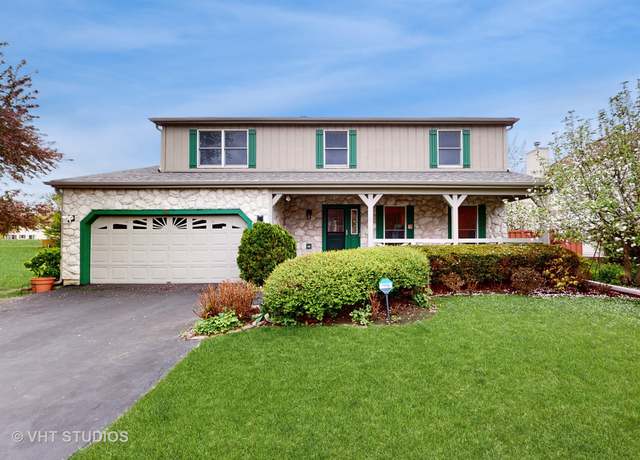
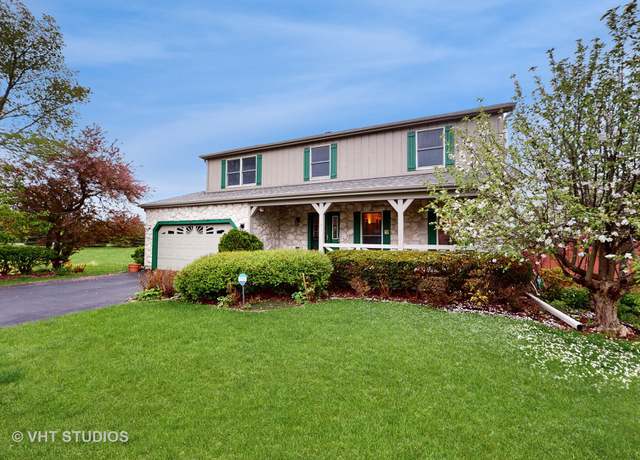
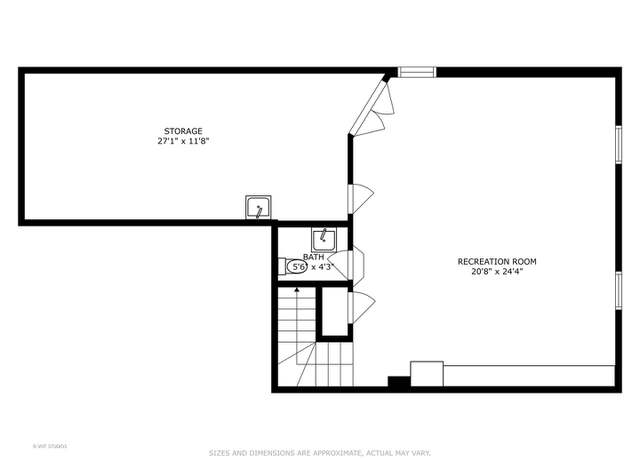
Welcome to your dream home! This stunning 4-bedroom residence boasts 2 full and 2 half bathrooms, offering ample space and convenience for your family's needs. As you step through the entrance, you'll be greeted by the spacious living room. The kitchen is located near the dining room and breakfast area. The family room overlooks the beautiful, private backyard, creating a serene ambiance perfect for entertaining guests or relaxing. The 2nd floor offers an expansive primary suite, 3 sizable bedrooms, and a convenient laundry space. Venture downstairs to discover the finished basement recreation room, boasting an impressive 14-foot high ceiling. This versatile space offers endless possibiliti
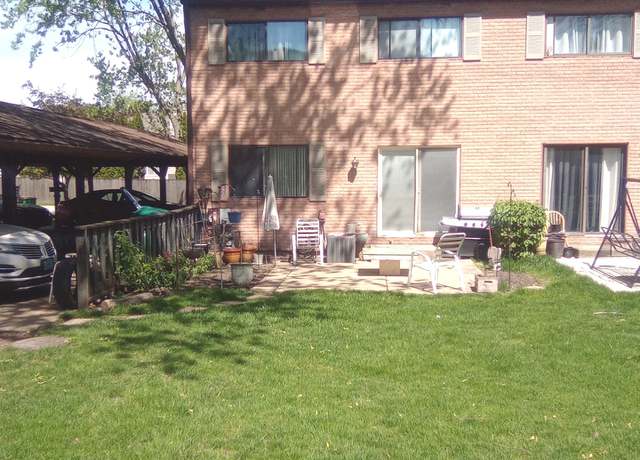
Perfect location! Sought-after private end unit features 3 bedroom, 1.5 bath with large basement full of possibilities. HARDWOOD floors. nice eat-in kitchen. Sliding doors from living room leading to a large open area. 3 car parking, two covered.
Welcome to this spacious and elegantly appointed penthouse residence! Boasting a generously sized living room, formal dining area, and a well-appointed kitchen with a breakfast nook, this home offers an unparalleled living experience. Enjoy breathtaking views from the balcony, perfect for relaxation and entertainment. Convenience meets luxury with in-unit laundry facilities and a bathroom featuring a separate shower and double vanity. The neutral decor exudes timeless elegance, complemented by recessed lighting in the living room and kitchen. Residents of this prestigious building enjoy access to amenities such as an exercise room, party room, and top-notch security. With a no-rental policy
NEW CONSTRUCTION IN THE INCREDIBLE PRAIRIE PARK DEVELOPMENT! Welcome to 80 Prairie Court. This incredible villa offers 3 ensuite bedrooms, a separate dining room, a gourmet kitchen that opens up to a 2 story living room, and bonus loft area. Your first floor owner's suite has a large walk-in closet and private bathroom with a double vanity and large walk in shower! Huge basement comes with roughed in plumbing for an additional bathroom option. Amenities include the incredible waterfall entry, central pond with fountains, incredible landscaping, and Prairie Park's unbelievable private clubhouse. Clubhouse amenities include an indoor pool, jacuzzi, dry sauna, workout room, party room with ful
Step into this stylish 2 bedroom, 2 bathroom condo which has had nice modern updates across the unit! This 1700 sq ft unit is very spacious! Laminate flooring throughout complements fresh, modern paint creating an inviting space. The kitchen boasts a nice breakfast bar, stainless steel appliances and new countertops. The dining space is right off the kitchen and is nice and spacious. The master bedroom features an ensuite bathroom and the second bedroom offers additional versatility. Both bedrooms boast ample closet space for additional storage! A private balcony provides a great view outside. This condo offers a lifestyle of comfort and convenience. Includes a 2-car garage that is undergro
Bright and spacious unit; Three good size bedrooms, room for everyone. Laminate flooring throughout and in-unit laundry with stack-able washer and dryer. Kitchen/eating area with the balcony. Access from your unit to 1-car attached garage, additional parking on driveway and street. Cedar Run subdivision offers a pool and clubhouse amenities. Close to shopping, dining, minutes to Metra and expressways. Long term tenant occupancy; Investors are welcome.
Step into modern comfort with this stunning mobile home. It features with 3 bedrooms and 2 full baths. You get natural light in the day, just bring your finishing touches to make this home your style. The home boasts a beautifully paved driveway leading up to a welcoming porch, perfect for enjoying peaceful mornings or serene evenings. No rentals allowed, monthly lot fee is $1158, water bill every other month, and trash bill every 3 months. Stove is not working, it will removed. Home is close to schools, shopping, entertainment and highway. Whippletree offers exterior heated pool, basketball courts and playground for everyone to enjoy!
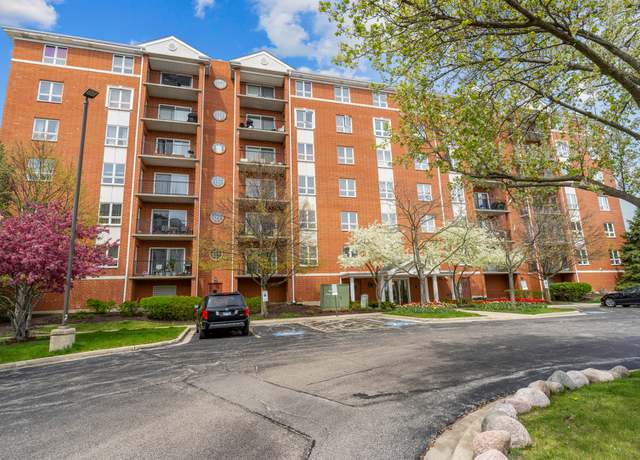
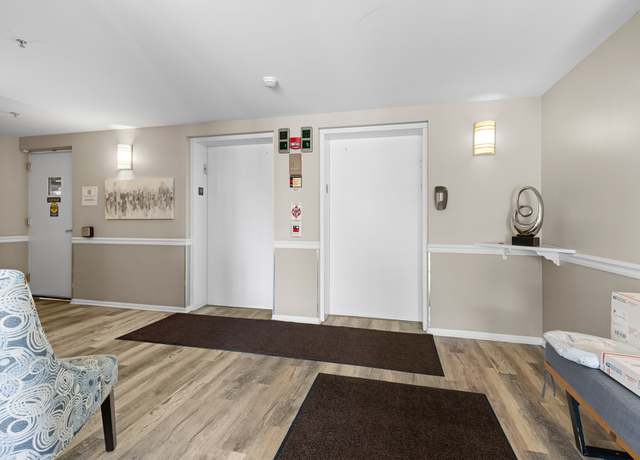
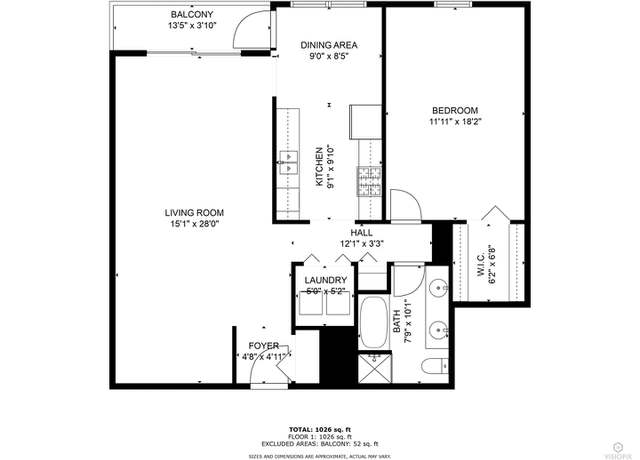
Welcome to Park Point - one of the larges 2bed/2bath floorpans and top floor south facing unit. Fabulous open floor plan with 2 split bedroom, oversize windows, large living room and separate dining area. Large kitchen with tons of cabinet space and eat in table area. Private dining room space, large dining room with huge sliding glass doors that open up to spacious balcony. Very large laundry room with side-by-side washer/dryer. Split bedroom floor plan with spacious bedroom, primary has tons of closets and spacious en-suite bathroom with separate walk in shower and tub. 1 car indoor parking with additional storage. Estate Sale 'As-IS'
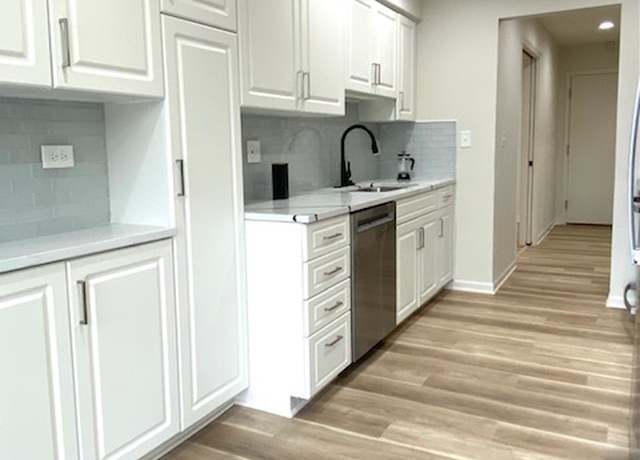
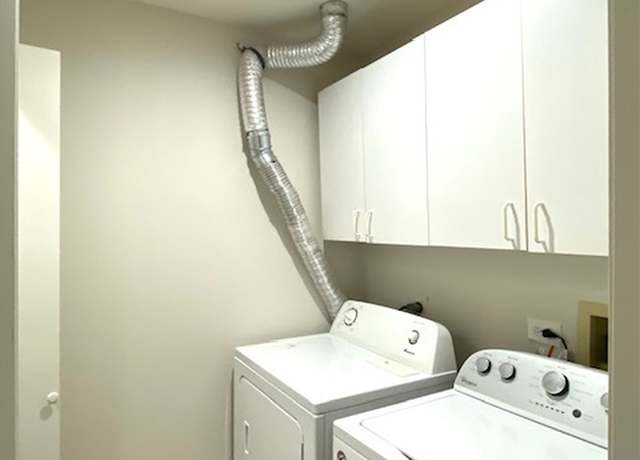
Rarely available end unit overlooking quiet scenic view out of the large long newly renovated and painted balcony. Filled with a lot of natural light this unit features new hardwood floors; updated bathrooms with newer vanities, updated kitchen has abundant cabinets, pantry & counter space, tile floors and large breakfast area that floats into the a cozy family room with a marble clad gas log fireplace; updated Pella windows & sliding doors from the living room and kitchen; in-unit laundry. Heated garage space with tandem parking for two cars!Well maintained building offers outdoor pool, party room & on site maintenance person. There is a tree-lined private walking path be
VACANT LOT ON CUL-DE-SAC STREET!. BUILD YOUR DREAM HOME. UTILITIES CONNECTION READY WATER/GAS/ELECTRIC, SIOL BORING. SELLER-BUILDER WILL HELP TO NAVIGATE THE NEW CONSTRUCTION . MOTIVATED SELLER
Excellent opportunity to Build the home of your dreams in a well-established neighborhood of Arlington Heights, without hassle and cost of demolition. Over half an acre ( 80 X 294 ) lot surrounded by upscale homes. Utilities nearby: city water and sewer. A great location close to Carousel Park and a few blocks to Lake Arlington. Drive by and call with questions.
Attention develpers and builders. Here is a hidden gem you may not know existed. 2.2 acres of land comprised of two adjacent lots each measuring 75' X 646' surrolunded by single family homes. Utilities and water are already at the property and no trees need to be cut down. Property is NOT in a flood plain. Zoned R3 this shovel ready project has a map and plans approved for 7 single family homes. The final plans are up to you. Conveniently located near schools, parks and shopping. There are two houses on the property, but showings must be registered for walking the land only. Home showings will be made through listing agents for special situations only. Here is a chance to help build up the
3.23 aches 2 lots BUILDERS * DEVELOPERS * MANY POSSIBILITIES AVAILABLE WITH THIS PROPERTY 2812 is 1.868 aches 2822 Jackson together $689,000, Build 6 unit apt , town house, your dream home has electric, water and sewer on site 2812 Jackson + site zoned R-1, Property was annexed to Wheeling in 2003 but still has an Arlington Heights mailing address.
BUILDERS * DEVELOPERS * MANY POSSIBILITIES AVAILABLE WITH THIS PROPERTY 1.23 ACHES next 2812 Jackson total 3.23 ache $689,000 together, electric, gas and well water in the 2812 Jackson site single house or multi unit PROPERTY ALSO FOR SALE * CUSTOM HOMESITE * Property was annexed to Wheeling in 2003 but still has an Arlington Heights mailing address.
Based on information submitted to the MLS GRID as of Thu May 02 2024. All data is obtained from various sources and may not have been verified by broker or MLS GRID. Supplied Open House Information is subject to change without notice. All information should be independently reviewed and verified for accuracy. Properties may or may not be listed by the office/agent presenting the information.
School data is provided by GreatSchools, a nonprofit organization. Redfin recommends buyers and renters use GreatSchools information and ratings as a first step, and conduct their own investigation to determine their desired schools or school districts, including by contacting and visiting the schools themselves.Redfin does not endorse or guarantee this information. School service boundaries are intended to be used as a reference only; they may change and are not guaranteed to be accurate. To verify school enrollment eligibility, contact the school district directly.
Wheeling, Illinois boasts a robust transportation network, making it convenient for residents to navigate the region by car. The village experiences moderate traffic levels, ensuring smooth driving experiences for most of the day. Public transportation is available in Wheeling, with the Metra North Central Service providing train links to Chicago. Additionally, the village is well-connected to major routes, with the I-294 tollway and US Route 45 nearby, facilitating easy access to other parts of the state. Learn more on our Wheeling city guide.
What types of properties are available in Wheeling?
Wheeling, Illinois offers a variety of single-family home types, including ranch-style homes, split-level homes, and contemporary homes. These homes can be found throughout the different neighborhoods of Wheeling, Illinois. Most single-family homes in Wheeling, Illinois feature 3 to 4 bedrooms and were built in various years. To explore different property types for sale in Wheeling, Illinois, use the 'Home type' filter located above the active listings. Customize your search by selecting options like single-family homes, condos, townhomes, and more.
What is life like in Wheeling?
Living in Wheeling, Illinois offers a peaceful suburban experience with a picturesque landscape. The area boasts a variety of outdoor spaces, including parks and trails, perfect for exploring nature. The weather in Wheeling brings distinct seasons, ranging from warm summers to snowy winters, providing a diverse climate experience. The town provides a range of job opportunities across various industries, ensuring a dynamic employment market. Residents can engage in a multitude of activities, such as dining at local restaurants, shopping at unique boutiques, and participating in community events.
What are the schools and amenities like in Wheeling?
Wheeling, Illinois offers a variety of public amenities to its residents. Yes, the town does have a selection of restaurants for dining, and grocery stores for your daily shopping needs. For outdoor enthusiasts, there are several parks available for leisure and recreation. The town also boasts other amenities such as fitness centers, libraries, and a post office. Therefore, Wheeling, Illinois provides a comprehensive range of services and facilities to meet the needs of its residents.
In the past month, 28 homes have been sold in Wheeling. In addition to houses in Wheeling, there were also 45 condos, 28 townhouses, and 1 multi-family unit for sale in Wheeling last month. Wheeling is a minimally walkable city in Cook County with a Walk Score of 44. Wheeling is home to approximately 37,274 people and 24,108 jobs. Find your dream home in Wheeling using the tools above. Use filters to narrow your search by price, square feet, beds, and baths to find homes that fit your criteria. Our top-rated real estate agents in Wheeling are local experts and are ready to answer your questions about properties, neighborhoods, schools, and the newest listings for sale in Wheeling. Our Wheeling real estate stats and trends will give you more information about home buying and selling trends in Wheeling. If you're looking to sell your home in the Wheeling area, our listing agents can help you get the best price. Redfin is redefining real estate and the home buying process in Wheeling with industry-leading technology, full-service agents, and lower fees that provide a better value for Redfin buyers and sellers.


 REDFIN IS COMMITTED TO AND ABIDES BY THE FAIR HOUSING ACT AND EQUAL OPPORTUNITY ACT. READ REDFIN'S FAIR HOUSING POLICY AND THE NEW YORK STATE FAIR HOUSING NOTICE.
 United States
 Canada