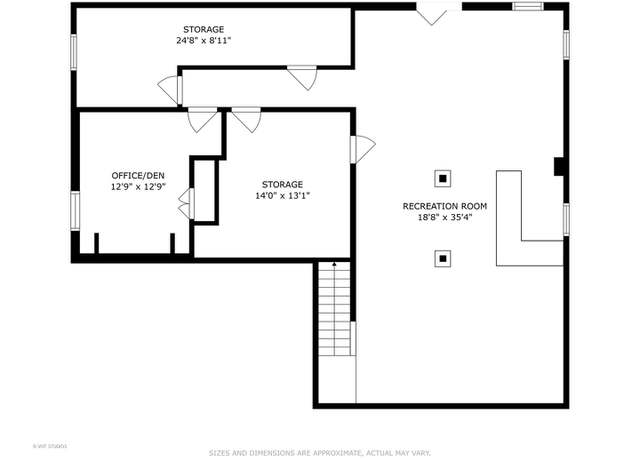
3100 Square Feet of living. .. PLUS an unfinished ENGLISH (lookout) basement! This fantastic floorplan includes large walk-in closets in all bedrooms and a 20x14 upstairs bonus room (excellent flex space - great for kids playroom, homework space or home office). The enormous vaulted master suite with lux bath offers a double sink vanity, soaking tub, separate shower & an amazingly HUGE walk-in closet! The main-floor features both a separate formal living and dining room, a 21x19 family room (window-filled) and a gourmet eat-in kitchen with open table space, center island, pantry, 42-inch cabinetry, & slider to the newer premium 20x16 Trex deck. You'll love the expansive main-fl
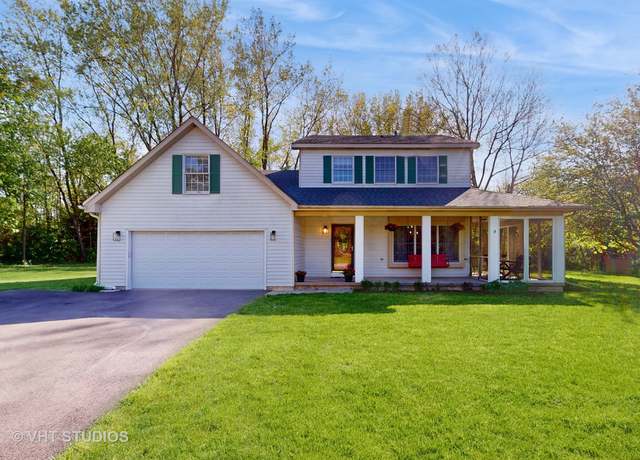
Welcome to 263 Tollview Terrace, completely remodeled from top to bottom and move-in ready! Some of the updates include: beautiful refinished hardwood floors on main level, new can lights and updated light fixtures throughout, new white shaker style cabinets, white quartz counter tops and brand new stainless steel appliances in kitchen. Crown molding throughout the home adds a touch of elegance. 3 bedrooms on main level as well as completely remodeled bathroom with bathtub. Lower level has 1 large bedroom, updated bathroom with stand up shower and additional open living area. Entire home has been repainted inside and out! Enjoy summer on a large deck! Furnace and Central Air updated in 2020
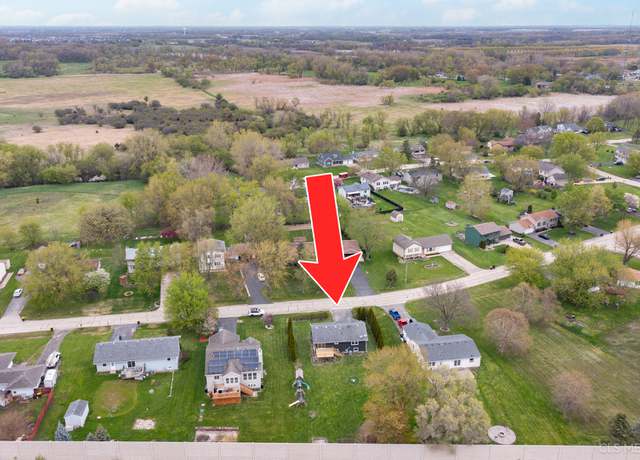
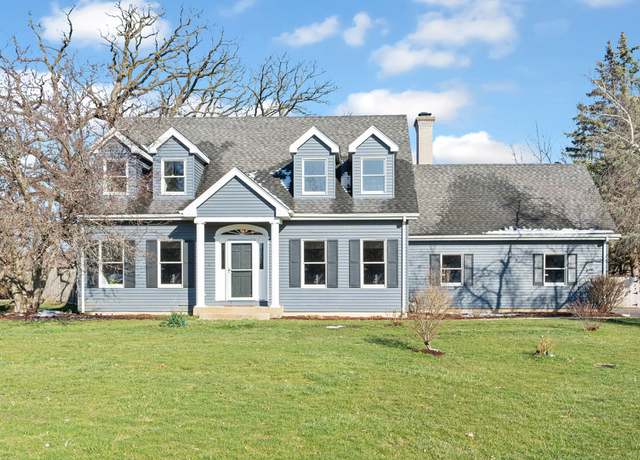
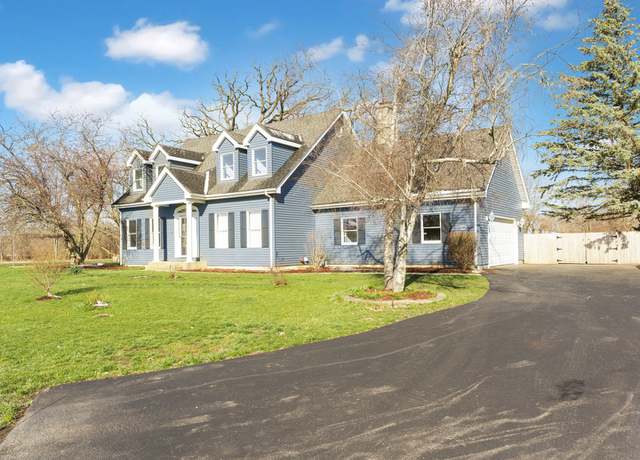
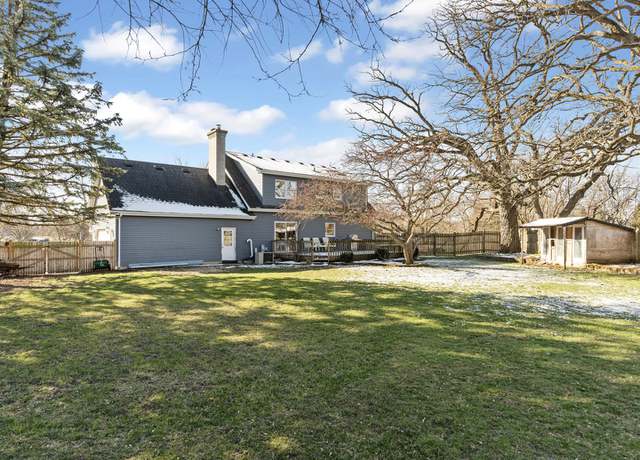
This well-loved home sits on almost an acre; beautifully located on a quiet cul-de-sac. It comes complete with a fenced-in private yard, fruit trees, perennials, and a garden shed. Ready for outdoor entertainment? No problem. The extensive deck is equipped with a natural gas hook-up for all your barbecue needs and offers tranquility mixed with privacy for all seasons. The extended driveway, completed in the last few years, is ready to welcome all your guests. The home is situated in the middle of the lot; therefore, providing plenty of space in front and the back of the home for all sorts of activities, including gardening, practicing your favorite sports, and the ability to have an in-grou
BUYER BACKED OUT BEFORE INSPECTION. THEIR LOSS YOUR GAIN! THIS IS THE ONE! Stunning 3 bedroom, end unit, 2 story townhouse with a FULL FINISHED basement in Timber Trails! The main room layout boasts a Large tall ceiling, open floor plan with beautiful lighting throughout. Kitchen features beautiful Stainless steel appliances, Granite counters, tall 42' Cherry colored shaker cabinets. Canned lighting ran throughout the whole property. upstairs features 2 full baths - Large Master bedroom with a large walk-in closet, en-suite and upstairs laundry. Basement is fully finished with high end finishes and a bar perfectly catered to the entertainer inside you. This end unit features its own persona
Spacious- brick front - townhome has all the room you've been looking for! From the oversized living room/dining room! You will fall in love with this Kitchen, 42" Oak Cabinets, Large Island, Recessed Lighting and access to the expansive balcony. Entire main level has 9' ceilings! All New stainless-steel appliances and additional storage. The lower level offers space for an office or media room and big laundry room with utility sink. The main bedroom has recessed lighting, walk-in closet and private bath with double door entry, dual sink vanity, soaker tub and stand-alone shower with glass doors. Loft with a full hall bath complete the 2nd floor. Rec/Bedroom in the Lower Level! Two car
Light and Bright end unit in Timber Trails Subdivision. Master Bedroom has vaulted ceilings and walk-in closet. Master Bath has separate shower and double sinks. Second floor laundry is convenient. Very large loft that can be used as office space or second family room. Full unfinished basement for plenty of storage. Spectacular views out the back to green space and open area. Trails nearby. Close to I90.
NEW! BARELY LIVED IN ~ LOVELY 3 BEDROOM COLUMBIA MODEL ~ BRIGHT AND OPEN LIVING AREA ~ HUGE ISLAND IN KITCHEN ~ STUNNING CUSTOM BACK SPLASH ~ FULLY FINISHED BASEMENT WITH FULL BATH ~ UPGRADES GALORE ~ CANNED LIGHTING THROUGHOUT ~ NEUTRAL COLORS ~ ALL WINDOW TREATMENTS & APPLIANCES STAY ~ GRAND MASTER SUITE WIT UPGRADED BATH ~ 2 OTHER LARGE BEDROOMS ~ PERFECT LOFT FOR THAT OFFICE OR PLAY AREA ~ BASEMENT IS NICELY FINISHED WITH UPGRADED LIGHTING ~ FULL BATH ~ STORAGE SPACE ~ FRESHLY PLANTED TREES AND LANDSCAPING ~ TAKE A PEEK ~ THIS ONE WON'T DISAPOINT!
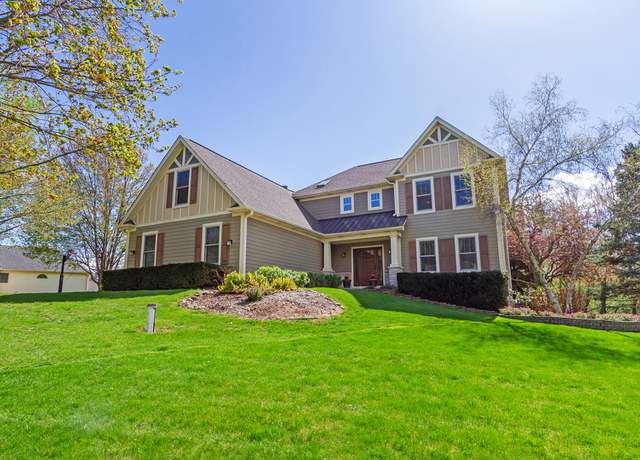
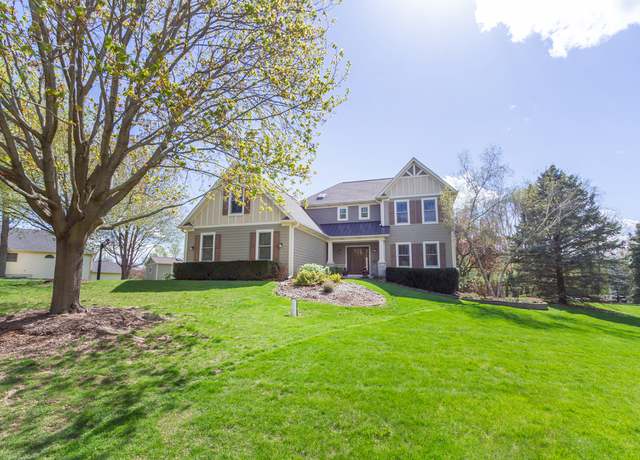
Experience the epitome of luxury living in this exquisite brick home nestled in Gilberts! Step inside to discover a luminous and spacious floorplan, adorned with gleaming hardwood floors, elegant white trim, and a magnificent two-story family room boasting a cozy fireplace and expansive windows flooding the space with natural light. The updated kitchen is a chef's delight, featuring ample 42" maple cabinetry, sleek granite countertops, stainless steel appliances, a breakfast bar, and a center island. Enjoy morning meals in the separate breakfast room with its vaulted ceiling and French doors leading to the paver patio and professionally landscaped backyard, surrounded by mature trees f
Welcome to this Beautiful 4-bedroom, 2.1 Bath residence with its all-natural charm and modern comfort. This home is nestled in the Dunhill Estates subdivision on a cul-de-sac, with close to an acre lot! You're going to love all the room space this home has to offer, not only do you have your dining room, but you also have an eat in kitchen, with granite countertops, stainless steel appliances and abundance of cabinet space. Enjoy all four seasons of family and friends in your living room and family room, gather by the fireplace making a lifetime of memories. The lower level has such beautiful flooring throughout. You have your laundry room and mud room together. The Master bedroom has a wa
NEW UNDER CONSTRUCTION!!! This newly designed open concept floor plan features 1,912 square feet of living space, concrete patio, 3 spacious bedrooms, 2 full baths and 2 car garage in the highly rated D300 school district. Single level living with many upgrades including kitchen cabinets, stainless steel appliances, granite counters, flooring and more provide elegance and comfort! Live maintenance free on an oversized lot and let someone else handle your exterior maintenance, landscaping and snow. Community park available to all residents! Conveniently located near I-90 and Randall Rd retail corridor and ranked as one of the best Chicagoland Suburbs by Chicago Agent Magazine.
Looking for buyers to build their dream home. This 1.63 acre lot is located in Timber Ridge Subdivision! Desirable Hampshire Schools with high ratings. Listing Broker has a follow up package with soil testing, topography map from County. Lot is large enough to handle any size ranch or two story. Any questions about out buildings or other structures are stated in the covenants (by laws and declaration). Just minutes to Randall Rd- I-90- Metra Trains. Subdivision has a County lot feel and there are many ponds within Timber Ridge. Owner had looked into building and had engineering and field study done already, which owner would be willing to offer to new buyer. This is an unincorporated lot th
Welcome to the perfect canvas for your dream home! This 1.275-acre parcel of buildable land offers a unique opportunity to create your own sanctuary in a serene setting. The property has a preexisting circular driveway, providing a welcoming entrance and adding a touch of character to the landscape. Situated against the quiet backdrop of Kane County Forest Preserve, you'll enjoy the tranquility of wetlands that ensure no future development behind your property. Embrace the beauty of nature right in your backyard, providing a peaceful retreat from the hustle and bustle of everyday life. Conveniently located near I-90, this property ensures quick and effortless access to major transportation
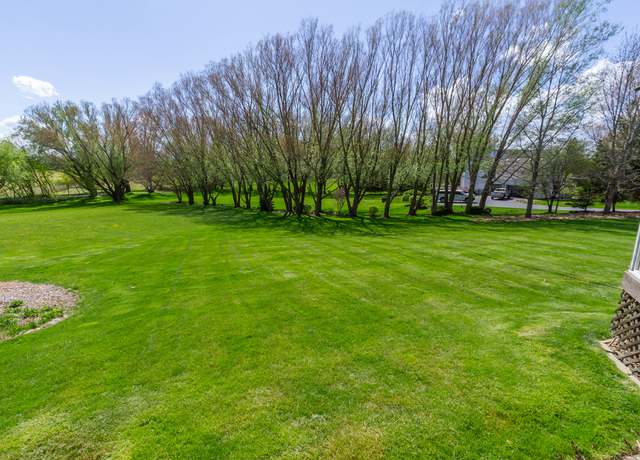
Dunhill Estates in Gilberts introduces a serene 0.66-acre parcel set proudly in the back of the community. Mature trees and a serene setting will easily accommodate a home worthy of its location! Sought after 300 School District and minutes from restaurants, entertainment, health clubs, highway and so much more!
Great opportunity for your business. 3.74 acres of level land. Zoned I-1, Industrial. Platted as Gilberts Corporate Center. Municipal services nearby. Potential Warehouse/Storage, outside yard space on this 3.74 acres (4.78 acres available for sale, zoned "P", total of 8.52acres for $785,000) see listing#10976821. Great potential for contractors, semi tractor trailers and material storage would need special use (verify use with Village of Gilberts). Rail nearby(verify access with railroad). Land is flat and cleared, ready to build. Lot dimension measurements approximate. Backs to public land/Kane County Forest Preserve. 5miles to I-90 and Metra. 1.5miles to Rt72(Higgins), 2.6miles
Great opportunity for your business. 8.52 acres of level land. front lot zoned I-1, Industrial, 4.78 zoned "P". 3.74 platted as Gilberts Corporate Center. Municipal services nearby. Potential Warehouse/Storage, outside yard space on this 8.52 acres. Great potential for contractors, would need special use for semi tractor trailers and material storage (verify use with Village of Gilberts). Rail nearby(verify access with railroad). Land is flat and cleared, ready to build. Lot dimension measurements approximate. Backs to public land/Kane County Forest Preserve. 5miles to I-90 and Metra. 1.5miles to Rt72(Higgins), 2.6miles to Randall Road Corridor. 8miles to downtown Elgin.
This modern end unit townhome is the perfect place to call home! Spacious two-story inside and out including 3 bedrooms plus a loft, 2.5 bath and a full, maintenance-free back and side yard! Enjoy outdoor entertaining on the large poured concrete patio. Benefit from many of the meticulously crafted interior upgrades including full mudroom bench and locker storage, applied mouldings and huge custom master closet system. Gleaming kitchen with plentiful cabinet storage and upgraded reverse osmosis water system. Cozy living room bathed in natural lighting from abundance of windows. Ample flex room off the two-story foyer makes for the perfect home office. Wide stair case and hallways allow for
Welcome home to this stunning 4-bedroom, 3.5 bathroom residence nestled on nearly a full acre in the coveted Burlington School District. Situated on a tranquil cul-de-sac, this home offers unparalleled serenity and privacy. The expansive driveway accommodates three cars across while the partially wooded lot creates a picturesque backdrop. Step inside to discover a thoughtfully designed layout with an open kitchen/dining area floorplan and featuring a screened-in lanai porch perfect for enjoying a cup of coffee and the peaceful surroundings. Continue to the large living room where a fireplace greets you adding warmth and charm to the space. Sliding glass doors lead to a large deck providing
Move right into this Stunning 4 bedroom home situated on almost an acre lot in desirable Timber Ridge. The dramatic two story foyer opens to a spacious living room with an abundance of natural lighting and French doors to the dining room. The formal dining with chair rail and gleaming oak flooring opens has a pass through to the kitchen. The beautifully updated kitchen boast 42 inch Cherry Cabinets, granite counters, island/breakfast bar, pendant lighting, pantry, stainless steel appliances, and an eat-in area with slider to the patio. The generous sized family room showcases a beautiful stone fireplace (gas starter) and great views of the picturesque outdoor space. Updated half bath on the
New construction home ready for a summer move-in! This 55+ Adult community has everything you could want with walking paths, ponds, and protected natural prairie grass! Wonderful location tucked away in a serene community that give you a quiet space and yet very near all the shopping and restaurants you could desire. Our very popular Bristol home has an open concept which is excellent for entertaining and enjoying the family. This home feature a covered patio leading into the backyard and natural protected prairie grasses across the street! The large kitchen features designer 42" designer Flagstone cabinetry with crown molding and soft close doors and drawers, stainless steel appliance
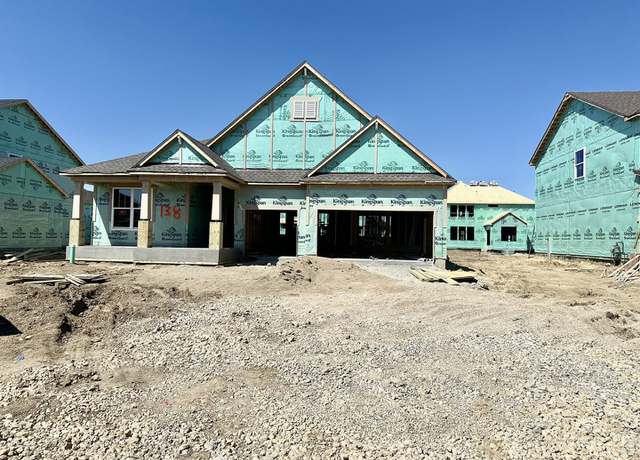
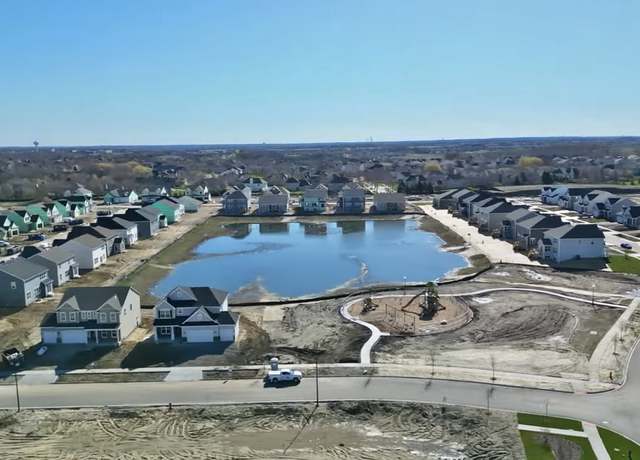
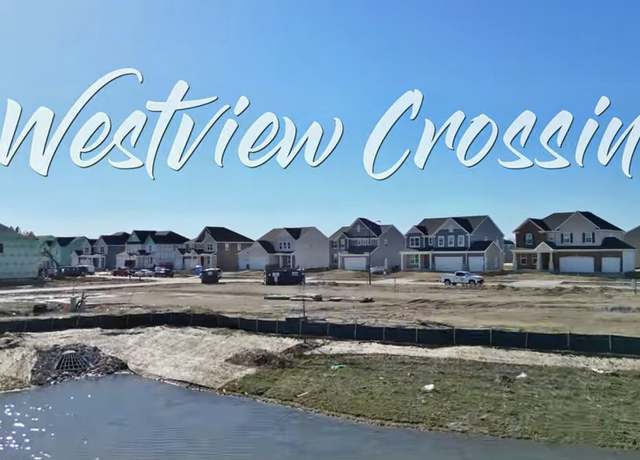
GORGEOUS RANCH * LOT 138 JULY (Est. delivery) ADAMS FLOOR PLAN * WESTVIEW CROSSING COMMUNITY * DISTRICT 158 HUNTLEY SCHOOLS WALKING DISTANCE TO SQUARE BARN ROAD CAMPUS * PRIME LOCATION TWO MILES EAST OF RANDALL ROAD CORRIDOR AND ALGONQUIN COMMONS SHOPPING CENTER * "EVERYTHINGS INCLUDED * QUARTZ COUNTERS * UPGRADED 42" CABINETS & FLOORING * SS APPLIANCES * 9FT CEILINGS * THIS ADAMS RANCH MODEL IS DESIGNED TO ACCOMMODATE BUSY LIFESTYLES WITH MODERN FEATURES, CHEF'S DREAM KITCHEN WITH CENTER ISLAND OVERLOOKING THE FAMILY ROOM, BREAKFAST ROOM WITH SLIDING GLASS DOORS TO A COVERED PATIO * DELUXE SHOWER BATH OPTION * LUXURY OWNERS SUITE PLUS 2 ADDITIONAL B
WESTVIEW CROSSING * NEW CONSTRUCTION LOT 130 * DISTRICT 158 HUNTLEY SCHOOLS WALKING DISTANCE TO SQUARE BARN ROAD CAMPUS * PRIME LOCATION TWO MILES EAST OF RANDALL ROAD CORRIDOR AND ALGONQUIN COMMONS SHOPPING CENTER * "EVERYTHINGS INCLUDED" QUARTZ COUNTERS * UPGRADED 42" CABINETS & FLOORING * SS APPLIANCES * 9FT CEILINGS * THIS 2 STORY RAINIER MODEL WITH DESIGNER SELECT OPTION * 2760 SF. * 4 BEDROOMS + LOFT, 3 CAR GARAGE, OPEN DESIGN CHEF'S DREAM KITCHEN OVERLOOKING BREAKFAST ROOM & FAMILY ROOM, FORMAL DINING ROOM/VERSATILE 1ST FLOOR FLEX/OFFICE SPACE AS STUDY, LUXURIOUS OWNERS SUITE WITH DELUXE SHOWER BATH OPTION * BASEMENT * 10 YEAR BUILDE
New construction ranch home ready for you to move in Summer of 2024. Join this exciting adult community located in an ideal location in Algonquin. Our Blake floor plan offers almost 1500 square feet of comfortable living space. This home has 2 bedrooms, 2 full bathrooms, study/office, covered patio and 2 car garage. Our beautiful kitchen includes a generous quartz island with an overhang for seating and undermount sink and pull out faucet, Enjoy 42 designer cabinets with crown molding and soft close doors and drawers, also stainless steel appliances. Luxury Vinyl Plank flooring throughout the main living areas. Tucked away behind the kitchen are the secondary bedroom and study. A perfect p
NEW CONSTRUCTION IN HUNTLEY! The Pendleton is a favorite here at Cider Grove and this one is special with a full look-out basement! At 2,155 sq. ft. , this home includes an open floorplan, with kitchen adjacent to the breakfast area and family room, making it perfect for gatherings. The flagstone cabinets and woven floors are easy to decorate with any color scheme. The large island features a white quartz countertop and is great for extra seating. This home has 3 bedrooms, loft, 2.5 baths and roughed-in plumbing in the basement. The upstairs laundry and baths all include luxury vinyl plank floors, quartz countertops on both baths, and ceramic shower walls in the primary bath. All our ho
NEW CONSTRUCTION IN HUNTLEY! The Holcombe plan is a popular plan that sells out almost immediately - so we are excited to have another Holcombe available at Cider Grove. At 2,356 sq. ft. , it is the perfect size with plenty of space that is easily managed. This home offers an open floorplan, with kitchen adjacent to the breakfast area and family room, making it perfect for gatherings. The color palette of white 42" cabinets, luxury vinyl plank floors, and white quartz countertops brings warmth and brightness to the main floor. This home has 4 bedrooms, 2.5 baths and a full look-out basement with roughed-in plumbing! The upstairs laundry and baths all include luxury vinyl plank floors,
Beautiful Highland Woods in top-rated Central School District 301! (Please note: This new home is not yet built. ) Live in an established high-end clubhouse community and enjoy all the community amenities including swimming pools, fitness center, splash park, tennis, basketball and volleyball courts, 5 miles of hiking and biking trails, 7 parks and playgrounds plus top rated on site elementary school! All amenities and the school are within walking distance! The Westchester is a stunning family home with an open floor plan you will love. Features included in this price are: SS appliances, premium maple cabinets in many finishes, vinyl plank floors in kitchen, foyer, eating area, laundry,
Highland Woods, in top-rated Central School District 301! Purchase now and spend your summer at this high-end clubhouse community and enjoy all the community amenities including swimming pools, fitness center, splash park, tennis, basketball and volleyball courts, 5 miles of hiking and biking trails, 7 parks and playgrounds plus top rated on site elementary school! All amenities and the school are within walking distance! The Riverton is a gracious family home with a spacious formal dining room for your special occasions. Features included in this price are SS appliances, premium maple cabinets in many finishes, vinyl plank floors on first floor, recessed lights in several areas and more!
NEW CONSTRUCTION IN HUNTLEY! The Holcombe plan is a favorite at Cider Grove and this one is extra special with a look-out basement! The ground-level windows with Southern exposure will flood the basement with light, making it a comfortable and bright space! And, because the home faces a large open area - with no homes behind it, the view from the deck is outstanding. At 2,356 sq. ft, it is the perfect size - plenty of space and easily managed. The kitchen is adjacent to the breakfast area and family room, making this open floorplan perfect for gatherings. The color palette of white 42" cabinets, luxury vinyl plank floors, and white quartz countertops keeps this space bright and light
NEW CONSTRUCTION IN HUNTLEY! Looking for the perfect home? The Coventry is back at Cider Grove! This 2,836 sq. ft. single-family home has a two-car garage and full basement with roughed-in plumbing. In the kitchen, you will enjoy a bright and rich color palette of 42" white cabinets and luxury vinyl plank floors. The cabinets include soft close doors and drawers and the quartz countertops finish off this beautiful space. The kitchen has a unique butler's pantry open to the front flex room - allowing this room to convert to a formal dining area as needed. The large island is complete with a sink and lots of room for seating - ideal for entertaining and casual dining. The family room is
New MOVE-IN READY construction ranch home in 55+ community ready for spring move in! The Blake floor plan offers 1,459 square feet of comfortable living space. This home has 2 bedrooms, a den/study, 2 full bathrooms, covered patio, and 2-car garage. Our beautiful kitchen includes a generous island with an overhang for stools, designer 42" white cabinets with crown molding and soft close doors and drawers, quartz countertops with an under-mount sink, pull-out faucet, and stainless-steel appliances. Luxury vinyl plank flooring throughout the main living areas! The primary bedroom features a large closet, and a large bathroom with dual sink vanity, ceramic tile flooring, plus a seated, s
LOT 110 * INCREDIBLE BUILDER INCENTIVES REDUCED INTEREST RATES W/ BUILDER'S LENDER * WESTVIEW CROSSING COMMUNITY * DISTRICT 158 HUNTLEY SCHOOLS WALKING DISTANCE TO SQUARE BARN ROAD CAMPUS * PRIME LOCATION TWO MILES EAST OF RANDALL ROAD CORRIDOR AND ALGONQUIN COMMONS SHOPPING CENTER * "Everything's included" Quartz counters * Upgraded 42" kitchen cabinets & flooring * Stainless steel appliances * 9 ft ceilings * 2 STORY SANTA ROSA 3064 SF. MODEL FEATURES * 4 BEDROOMS + LOFT * 3 CAR GARAGE * BASEMENT * OPEN DESIGN * CHEFS DREAM KITCHEN WITH LARGE CENTER ISLAND, WALK IN PANTRY & BUTLERS PANTRY OVERLOOKING BREAKFAST ROOM & FAMILY ROOM
BEAUTIFUL ALMOST NEW RANCH - NEUTRAL AND BRIGHT WITH RECESSED LIGHTING AND (LVP) LUXURY VINYL PLANK FLOORING - OPEN FLOOR PLAN WITH 2 BEDROOMS - 2 FULL BATHS - AND FLEX ROOM BEING USED AS FORMAL DINING - COULD BE DEN/OFFICE/BEDROOM - GOURMET KITCHEN WITH SMART STAINLESS STEEL APPLIANCES - BUILT IN OVEN AND STAND ALONE OVEN/STOVE- HUGE ISLAND/BREAKFAST BAR - EATING AREA FOR TABLE/CHAIRS - CERAMIC BACK SPLASH - PANTRY - SLIDERS TO BACK COVERED PORCH AND FENCED YARD -LARGE MASTER BEDROOM WITH TRAY CEILING - HUGE SHOWER AND WALK-IN CLOSET - GREAT ROOM HAS HIGH CEILINGS AND GAS LOG FIREPLACE - SMART WIFI THERMOSTAT CONTROL - ADT - SOLAR PANELS FOR UTILITY SAVINGS - FULL BASEMENT - ROUGHED IN BAT
LOT 113 * INCREDIBLE BUILDER INCENTIVES REDUCED INTEREST RATES W/ BUILDER'S LENDER * WESTVIEW CROSSING COMMUNITY * DISTRICT 158 HUNTLEY SCHOOLS WALKING DISTANCE TO SQUARE BARN ROAD CAMPUS * PRIME LOCATION TWO MILES EAST OF RANDALL ROAD CORRIDOR AND ALGONQUIN COMMONS SHOPPING CENTER * "Everything's included" Quartz counters * Upgraded 42" kitchen cabinets & flooring * Stainless steel appliances * 9 ft ceilings * 2 STORY SANTA ROSA 3064 SF. MODEL FEATURES DESIGNER SELECT OPTION * 4 BEDROOMS + LOFT * 3 CAR GARAGE * BASEMENT * OPEN DESIGN * CHEFS DREAM KITCHEN WITH LARGE CENTER ISLAND, WALK IN PANTRY & BUTLERS PANTRY OVERLOOKING BREAKFAST RO
Nice 3 br. ranch home in a country setting yet close to all the amenities! One + acre property surrounded by crop land will give the kids room to frolic and mom and dad to entertain. Possible commercial per county
PRIME COMMERCIAL DEVELOPMENT LAND - ALGONQUIN CORPORATE CAMPUS: Price Reduced - Prime 6.71 acre site (part of Algonquin Corporate Campus). Office or light industrial zoning envisioned. Acreage can be divided. Frontage on Boyer Road. Site will be annexed to the Village of Algonquin. 1/4 mile North of Long Meadow Road (new bridge access road) on Boyer Road. $4.96 psf.
1/2
$1,450,000
— beds— baths6.71 acres (lot)
0 Boyer Rd, Dundee, IL 60118
Based on information submitted to the MLS GRID as of Sun May 05 2024. All data is obtained from various sources and may not have been verified by broker or MLS GRID. Supplied Open House Information is subject to change without notice. All information should be independently reviewed and verified for accuracy. Properties may or may not be listed by the office/agent presenting the information.
School data is provided by GreatSchools, a nonprofit organization. Redfin recommends buyers and renters use GreatSchools information and ratings as a first step, and conduct their own investigation to determine their desired schools or school districts, including by contacting and visiting the schools themselves.Redfin does not endorse or guarantee this information. School service boundaries are intended to be used as a reference only; they may change and are not guaranteed to be accurate. To verify school enrollment eligibility, contact the school district directly.
Transportation in Gilberts, Illinois is primarily car-dependent, with most residents relying on their cars for commuting and daily activities. The traffic levels are generally moderate, making driving a convenient option for most. Unfortunately, Gilberts does not have a public transportation system, meaning residents must rely on their own cars for travel. However, the town's location provides easy access to several major highways and freeways, facilitating travel to other areas.
What types of properties are available in Gilberts?
Gilberts, Illinois offers a variety of single-family home types, including ranch-style homes, split-level homes, and two-story homes. These homes can be found throughout the town, with many located in established neighborhoods and newer developments. Most properties in Gilberts, Illinois feature three to five bedrooms and were built within the past 20 years. To explore different property types for sale in Gilberts, Illinois, use the 'Home type' filter located above the active listings. Customize your search by selecting options like single-family homes, condos, townhomes, and more.
What is life like in Gilberts?
Living in Gilberts, Illinois offers a peaceful and serene environment with a picturesque landscape that is surrounded by lush greenery and rolling hills. The weather in Gilberts is characterized by distinct seasons, allowing residents to experience the beauty of changing foliage in the fall and enjoy outdoor activities in the summer. The town provides a range of job opportunities across various industries, ensuring residents have diverse career options. Gilberts is also home to numerous recreational activities, such as parks and trails, allowing residents to enjoy nature and engage in outdoor pursuits. Additionally, the town offers a vibrant community with various local events and social gatherings that foster a strong sense of belonging.
What are the schools and amenities like in Gilberts?
Gilberts, Illinois is well-equipped with a variety of public amenities that cater to the needs of its residents. The town boasts a number of restaurants, offering a diverse range of cuisines to satisfy all tastes. For those who enjoy outdoor leisure, there are several parks within the town limits. Grocery shopping is convenient with a selection of grocery stores available. Additionally, Gilberts provides other essential amenities such as schools, medical facilities, and recreational centers.
In the past month, 4 homes have been sold in Gilberts. In addition to houses in Gilberts, there were also 2 condos, 13 townhouses, and 0 multi-family units for sale in Gilberts last month. Find your dream home in Gilberts using the tools above. Use filters to narrow your search by price, square feet, beds, and baths to find homes that fit your criteria. Our top-rated real estate agents in Gilberts are local experts and are ready to answer your questions about properties, neighborhoods, schools, and the newest listings for sale in Gilberts. Our Gilberts real estate stats and trends will give you more information about home buying and selling trends in Gilberts. If you're looking to sell your home in the Gilberts area, our listing agents can help you get the best price. Redfin is redefining real estate and the home buying process in Gilberts with industry-leading technology, full-service agents, and lower fees that provide a better value for Redfin buyers and sellers.


 REDFIN IS COMMITTED TO AND ABIDES BY THE FAIR HOUSING ACT AND EQUAL OPPORTUNITY ACT. READ REDFIN'S FAIR HOUSING POLICY AND THE NEW YORK STATE FAIR HOUSING NOTICE.
 United States
 Canada