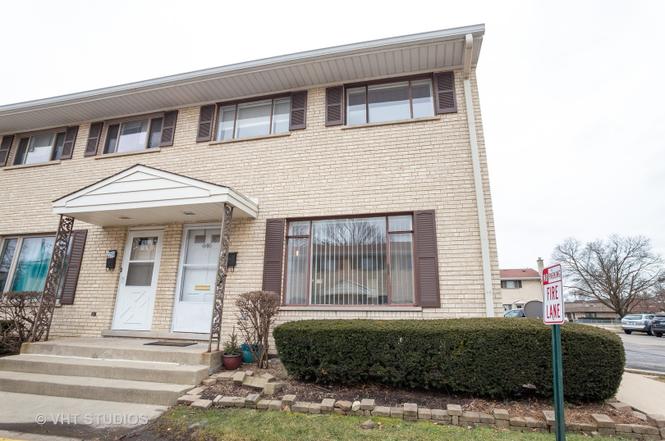
Location, Location!!!!Corner End Unit in Stanton Arms !! This Sunny and Bright townhome is freshly Painted and has gleaming hardwood floors! Spacious living room, Kitchen equipped w SS appliances, ceramic tile Back splash. Remodeled full bath with stone tile work, remodeled half bath with new cabinetry and light fixture. . Master bedroom has walk-in closet . partial bsmnt ! Cemented crawl with lots of storage Newer Maytag front loading washer and dryer. 2 assigned parking spaces 47 and 11.. .. Just a min away from Northwest Community hospital. .perfect for anyone who wants to walk to work! Close to expressways, Metra, Woodfield Mall and more!
TownhomeProperty Type
1961Year Built
3,068 sq ftLot Size
$252Est. Price/Sq.Ft.
2 spacesParking
Listed by Jill Tobias• Baird & Warner
Bought with Ali Gursoy• Berkshire Hathaway HomeServices Chicago
Source:MRED as Distributed by MLS Grid #10741492
Redfin Estimate
$288,848
$119K since sold in February 2021$10K since October
Recently sold homes
Estimate history
Homes for sale
This home's estimate is 24.4% lower than the average sale price ($382K) of 6 comparable homes.
Location, Location!!!!Corner End Unit in Stanton Arms !! This Sunny and Bright townhome is freshly Painted and has gleaming hardwood floors! Spacious living room, Kitchen equipped w SS appliances, ceramic tile Back splash. Remodeled full bath with stone tile work, remodeled half bath with new cabinetry and light fixture. . Master bedroom has walk-in closet . partial bsmnt ! Cemented crawl with lots of storage Newer Maytag front loading washer and dryer. 2 assigned parking spaces 47 and 11.. .. Just a min away from Northwest Community hospital. .perfect for anyone who wants to walk to work! Close to expressways, Metra, Woodfield Mall and more!
MRED as Distributed by MLS Grid #10624688
Jun 9, 2020
Listing Removed
—
MRED as Distributed by MLS Grid #07558358
Jun 20, 2011
Listing Removed
—
Jun 4, 2011
Contingent
—
MRED as Distributed by MLS Grid #07334763
Mar 9, 2010
Listing Removed
—
Public Records
Aug 17, 2009
Sold
$1,300,000
$1,132/sq ft
MRED as Distributed by MLS Grid #06981168
Aug 4, 2009
Sold (MLS) (Closed Sale)
$130,000
$113/sq ft
Apr 9, 2009
Listing Removed
—
Mar 24, 2009
Price Changed
$159,000
$139/sq ft
Mar 9, 2009
Price Changed
$160,000
$139/sq ft
Feb 24, 2009
Price Changed
$169,999
$148/sq ft
Feb 19, 2009
Price Changed
$174,000
$152/sq ft
Feb 7, 2009
Price Changed
$174,999
$152/sq ft
Jan 22, 2009
Price Changed
$175,000
$152/sq ft
Jan 17, 2009
Price Changed
$182,000
$159/sq ft
Jan 9, 2009
Price Changed
$190,000
$166/sq ft
Jan 2, 2009
Price Changed
$191,000
$166/sq ft
Dec 4, 2008
Price Changed
$191,500
$167/sq ft
Nov 25, 2008
Price Changed
$192,000
$167/sq ft
Nov 13, 2008
Price Changed
$193,000
$168/sq ft
Nov 5, 2008
Price Changed
$194,000
$169/sq ft
Oct 30, 2008
Price Changed
$195,000
$170/sq ft
Oct 23, 2008
Price Changed
$196,000
$171/sq ft
Oct 17, 2008
Price Changed
$197,000
$172/sq ft
Oct 8, 2008
Price Changed
$198,000
$172/sq ft
Aug 28, 2008
Price Changed
$199,000
$173/sq ft
Jul 31, 2008
Listed
$205,000
$179/sq ft
Public Records
Apr 26, 2002
Sold
$145,000
$126/sq ft
Public Records
May 26, 1994
Sold
$97,000
$84/sq ft
Public Records
Feb 18, 1986
Sold
$53,500
$47/sq ft
Year
Property tax
Land + Additions
Assessment*
2023
$4,654 (+3.8%)
$4,909 + $19,091
$24,000
2022
$4,482 (+0.5%)
$3,000 + $14,000
$17,000
2021
$4,461 (+29.8%)
$1,917 + $12,901
$14,818
2020
$3,435 (+0.7%)
$1,917 + $12,901
$14,818
2019
$3,413 (+5.3%)
$1,917 + $14,511
$16,428
2018
$3,240 (+0.6%)
$1,687 + $12,852
$14,539
2017
$3,220 (−0.6%)
$1,687 + $12,852
$14,539
2016
$3,239 (−5.3%)
$1,687 + $12,852
$14,539
2015
$3,419 (+2.5%)
$1,457 + $12,747
$14,204
2014
$3,335 (−16.0%)
$1,457 + $12,747
$14,204
2013
$3,969 (−5.5%)
$1,457 + $12,747
$14,204
2012
$4,199 (+4.8%)
$1,610 + $14,584
$16,194
2011
$4,007 (+0.4%)
$1,610 + $14,584
$16,194
2010
$3,992 (−3.1%)
$1,610 + $14,584
$16,194
2009
$4,119 (+2.3%)
$1,687 + $16,563
$18,250
2008
$4,025 (+85.6%)
$2,699 + $16,925
$19,624
2007
$2,168
$2,699 + $16,925
$19,624
Tax history for 646 W Central Rd
Year
Property tax
Land + Additions
Assessment*
2023
$4,654 (+3.8%)
$4,909 + $19,091
$24,000
2022
$4,482 (+0.5%)
$3,000 + $14,000
$17,000
2021
$4,461 (+29.8%)
$1,917 + $12,901
$14,818
2020
$3,435 (+0.7%)
$1,917 + $12,901
$14,818
2019
$3,413 (+5.3%)
$1,917 + $14,511
$16,428
2018
$3,240 (+0.6%)
$1,687 + $12,852
$14,539
2017
$3,220 (−0.6%)
$1,687 + $12,852
$14,539
2016
$3,239 (−5.3%)
$1,687 + $12,852
$14,539
2015
$3,419 (+2.5%)
$1,457 + $12,747
$14,204
2014
$3,335 (−16.0%)
$1,457 + $12,747
$14,204
2013
$3,969 (−5.5%)
$1,457 + $12,747
$14,204
2012
$4,199 (+4.8%)
$1,610 + $14,584
$16,194
2011
$4,007 (+0.4%)
$1,610 + $14,584
$16,194
2010
$3,992 (−3.1%)
$1,610 + $14,584
$16,194
2009
$4,119 (+2.3%)
$1,687 + $16,563
$18,250
2008
$4,025 (+85.6%)
$2,699 + $16,925
$19,624
2007
$2,168
$2,699 + $16,925
$19,624
*Taxable value of land and structures on it ("additions") is determined regularly by local assessors and does not affect market price.
Zoning
R-6
Multiple- Family Dwelling District
The purpose of the R-6 district is to provide areas for medium density multiple- family developments. The minimum area for this District is 1 acre.