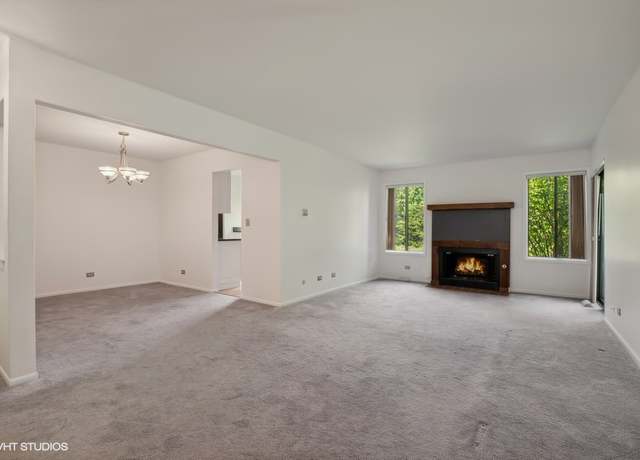
Welcome to this stunning and rarely available first floor, 3 bedroom, 2 full bath condo that boasts a range of new upgrades. Brand new AC condenser will be installed in before closing. This modern comfort and stylish condo is in sought after Oaks at Green Trails subdivision. Entire interior has been freshly painted and all new carpeting throughout. The living room features a cozy gas fireplace and a sliding door to a serene concrete patio, perfect for relaxation. The dining room provides a versatile space for gatherings. The remodeled eat in kitchen boasts hardwood floors, granite countertops, and stainless steel appliances for a stylish and functional cooking area. Convenience is ensured w
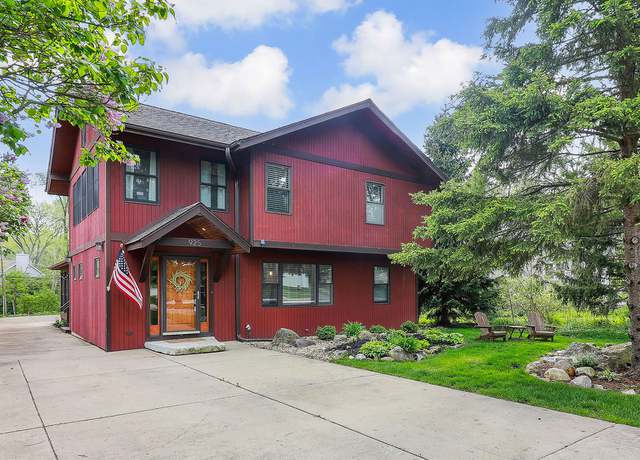
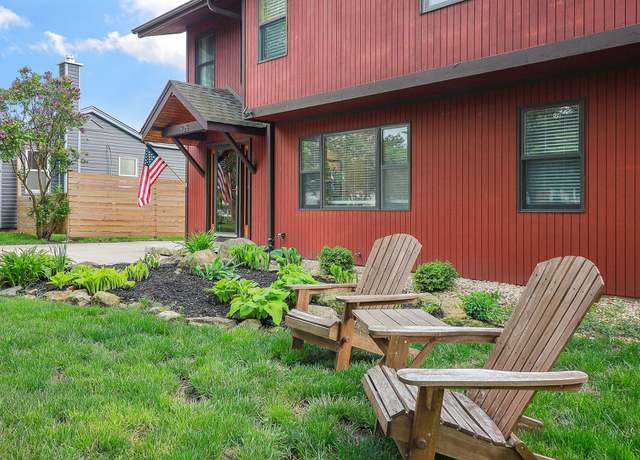
Step inside your relaxing retreat. Nestled in a quiet neighborhood close to downtown Lisle, this home exudes timeless charm with a vacation home atmosphere. When you enter this stylish 4 bedroom, 2 1/2 bathroom home through the tiled foyer, you'll be greeted with functional storage space, a mud room, and a half bathroom. The first floor features hardwood flooring throughout, which is complete with a first-floor bedroom, dining room, and living room with a fireplace. The large kitchen is perfect for entertaining and features sleek stainless steel appliances, custom bamboo and maple cabinets, stainless steel countertops, tile backsplash, one double and one single cast iron sinks, and an eat-i
1850 sqft 2 story townhouse with a full basement and an attached 2.5 car attached garage. This home is full of natural light, has 3 oversized Bedrooms 2 with en suite bathrooms and a large loft area. Plus. .. 3.5 bathrooms! This home has 2 master bedroom options with en suites upstairs and a full basement that has another bedroom and a full bathroom. The open concept living room flows nicely throughout the main level and walks out to a peaceful deck overlooking mature trees. This is a great townhouse just two blocks away from downtown Lisle and the Lisle BNSF train stop.
CUSTOM BUILD OPPORTUNITY with established Design + Build Team that has built over 400 homes in the community and has an impeccable reputation. Located close to Downtown Naperville and both Naperville and Lisle train stations. Award winning Naperville 203 schools. Home will be built with all of the top level materials and designer finishes and is truly an amazing opportunity to build your dream home in this unparalleled location. Build package is loaded with upgrades and also includes Hardscaping and Landscaping. * Pictures are from homes previously built by the builder. Look forward to a stress free and enjoyable custom build experience!! Builder Warranty Included.
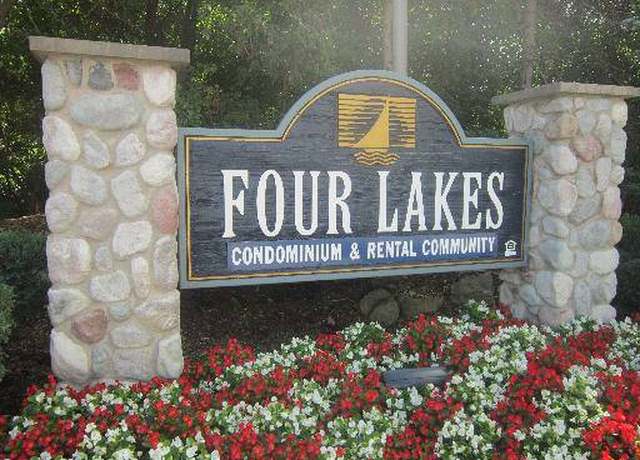
Welcome to this pristine one bedroom first floor condo in Lisle's sought-after Four Lakes Community. This pet-friendly residence offers a spacious layout flooded with natural light. The private deck with wooded views providing a peaceful retreat. Open concept floor plan, fully applianced kitchen with ample counter and cabinet space over looks dinette and living room. Recently fully rehabbed bath. The convenience of an in-unit stackable washer and dryer adds to the appeal, while one designated parking spot and additional guest parking ensure effortless living. Living in Four Lakes grants access to an array of amenities, from a ski hill for winter adventures to a community restaurant, scenic
Don't judge a book by it's cover! This home will impress you as you step inside. It's like the vacation home you don't want to leave, and now you don't have to. Totally updated inside, it has an open floor plan large enough for entertaining or family get-togethers. Enjoy cooking and baking in the redesigned kitchen with white cabinets, new drawer pulls and hinges, farm sink, large island with range and range hood, and stainless steel appliances. Living room has lots of light and updated fireplace with new insert. Large dining area has dry bar with pantry, and lots of natural light. The new electric fireplace in the family room gives off a beautiful warm glow in a cozy room perfect for those
Fixer Upper in GreenTrails/Dist 203 schools. Needs work. AS/IS. Conventional or Cash. Showings will begin on 5/1/2024. Please see disclosures for more information. Multiple offers received. Highest and best due 9pm 5/3/2024.
Rare and unique find in Four Lakes! 2 units combined into 1840 sq ft of quiet, secluded and picturesque living. Lovely, updated and upgraded unit with 2 levels and 2 fireplaces featuring completely updated first floor kitchen with white cabinets, quartz counter tops, new sink and faucet and new SS fridge, range and microwave. Kitchen has a breakfast area and opens to the living room with a natural floor to ceiling brick wood burning fireplace and 16 foot wide sliding door opening to a large 6 x 16 ft deck. Deck looks out to a secluded small lake surrounded by trees, flowers, wildlife and nature at its finest. First floor also features a full bath and two bedrooms. The second floor is home t
Built in 2002, this semi custom Kettell home has been meticulously maintained by one owner. The traditional two story boasts extraordinary construction and a wonderful layout with generously sized rooms. A front porch presents a lovely welcome for family and friends. Striking mission style leaded glass doors catch natural sunlight from the foyer and dining room . A butlers pantry provides additional storage and prep space while connecting the dining area with the kitchen The kitchen boasts generous cabinetry, Corian countertops, an island, pantry and a desk. There is plenty of room for a breakfast table too. The large family room will accommodate a crowd and there is access to the deck and
Rare opportunity to own one of the most iconic homes in Green Trails. So spacious. Living room and dining room with hardwood floors. Beautifully updated and open kitchen. Breakfast bar, granite counters, stainless steel appliances and hardwood floors. The sliding glass door opens to the large 2 tier deck. Family room with fireplace and recessed lights. All bathrooms are updated. On the upper level is the master bedroom with walk in closet and private bath. There is also access to the front deck. There are 3 huge additional bedrooms all with hardwood floors and additional bath. Do not miss the huge walk up attic. On the lower level is the walkout basement with a rec room that has new carpet,
CUSTOM BUILD OPPORTUNITY with established Design + Build Team that has built over 400 homes in the community and has an impeccable reputation. Located close to Downtown Naperville and both Naperville and Lisle train stations. AWARD WINNING DISTRICT 203 SCHOOLS. Home will be built with all of the top level materials and designer finishes and is truly an amazing opportunity to build your dream home in this unparalleled location. Build package is loaded with upgrades and also includes Hardscaping and Landscaping. * Pictures are from homes previously built by the builder. Look forward to a stress free and enjoyable custom build experience!! Builder Warranty Included.
Discover the epitome of convenience and comfort in this rarely available Townhome nestled in Middleton Place. This coveted location is a very short distance to the expressway and is walkable to train and Downtown Lisle. The two-story townhome offers not only unparalleled accessibility it features a spacious and easy layout with a large foyer entrance, a captivating two-story great room complete with a warm fireplace, many windows for natural light, hardwood flooring on the Main floor, plus there is space for a more formal dining/flex area off the Great Room or you can utilize the casual breakfast room. The generous kitchen includes ample counter space, plentiful cabinetry, cooktop, and doub
Elevator Building! YOU DO NOT HAVE TO TAKE THE STAIRS! This building has underground heated parking and the unit has two parking spaces!!! Unit has 3-Bedrooms and 2-Bathrooms. Master bedroom has the master- bathroom and a walk-in closest. This unit has a 30 foot balcony with 3 access points (2 from the bedrooms and one from the living room. ) The elevator, workout room, and storage unit are all VERY VERY close to the unit! (Can life get any easier?) The kitchen, dining, and living room are in good condition with fresh paint! When you get off the elevator to the right is the work out room and the first door on the left is the owners storage unit which is 4 x 7. Dogs are not allowed, ho
Build this custom dream home on great lot backing to park located in Naperville school district 203 in the spectacular green trails of Lisle. Comfortable and cozy open floor plan featuring den, huge kitchen with working pantry, dinette area open to family room overlooking back yard and park area, mud room with nice built ins, 3 nice size bedrooms with vaulted ceilings, plus spectacular master suite, second floor laundry room, open staircase to basement, and lots of windows. The very last buildable lot in Green Trails with all of its amenity's bike, & walking trails, lakes, tennis courts, luxurious home with covered front porch. Call now for your appointment. Interior photos of similar
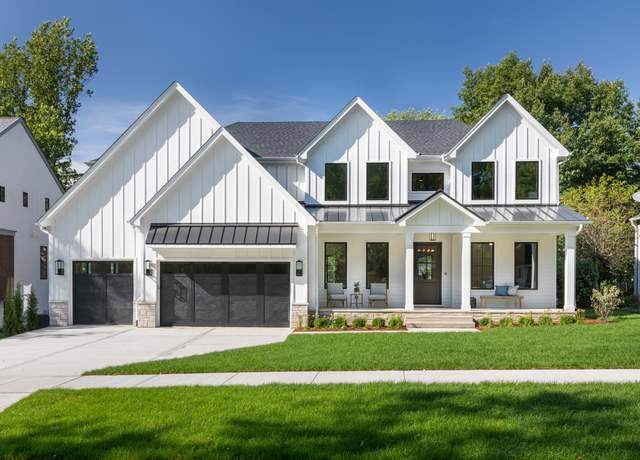
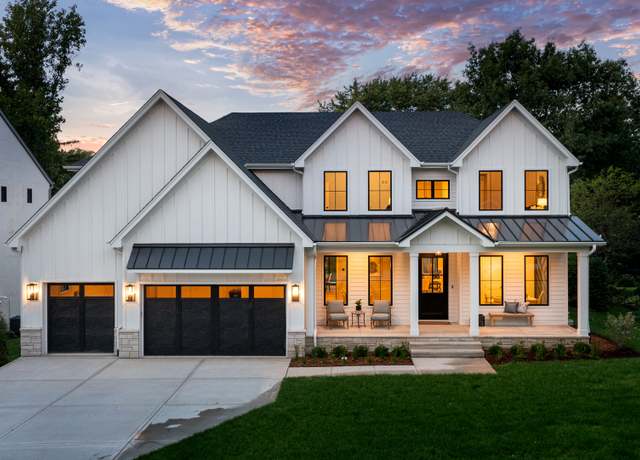
Build your Dream Home! Proposed Construction This Modern Farmhouse design is a creative combination of the sleek lines found in contemporary home styles with a healthy injection of the cozy Farmhouse aesthetic resulting in a uniquely comfortable take on country-inspired living. Great room, First Floor Master and Master bath, Office and More! The exterior Images copyrighted by the designer and used with permission from America's Best House Plans. Photographs may reflect a homeowner modification. Military Buyers-Attractive Financing and Builder Incentives May Apply. Land is 99.7 x 590 x 100 x 597.2. Property goes from Karns Road to Fender Road. Purchase and split land. .. How many homes ca
A fantastic opportunity to place your business in a high traffic area in Lisle, IL. This property is zoned B2 and is perfect for your office or retail plans. A 200' lot means plenty of room for parking. Located just west of downtown Lisle. An approved appointment is required to walk the property. Contact the listing agent with any questions.
Build your dream home on this generous 1.2 acre property. Located on a quiet street close to all that Naperville has to offer, this parcel provides a blank canvas to bring your vision to life. Enjoy the luxury of privacy while living conveniently close to essential amenities (highways, train, shopping and dining) and top-rated District 203 schools. Water and sewer connections are available at the street. Note that a portion of the land is situated within a flood zone.
This is an exceptional opportunity for your client to move their business to busy Ogden avenue. Easy access and great visibility. 141 feet of frontage. B3B zoning. Located in the central downtown district and close to the Metra station. Low Dupage taxes too!
Lot is a part of the Ogden Corridor Master Plan guides future high quality redevelopment of this strong commercial corridor. Ogden Avenue Corridor Plan Additional Info. Price for one lot 748 Ogden Ave. Next to 748 Ogden Ave lot for sale also. Properties are zoned B-2 Commercial and has multiple use options! Great opportunity for Investor seeking an income property in a convenient location to expressways:I-355 and Ogden Ave.
The property is zoned B2 Commercial and has multiple use options! Part of the Ogden Corridor Master Plan guides future high-quality redevelopment of this strong commercial corridor. The property is ideal for a small business offering a prime setting with a growing retail environment.
Next to Popeye's Chicken on Ogden, and facing a Seven-Eleven Shopping Strip, Near I-88 Entrances from Naperville Road or Rt-53; less than one mile from the new Costco in Naperville north area; gas, water and sewer on the site, soil borings done, ready to be built on, B2 zoning as Community Business District - good for medical offices, stores or residential usage as for R2 zoning, excellent Naperville School District 203.
PRIME LOCATION POTENTIAL LAND ASSEMBLAGE in Lisle being sold in conjuction with MLS 11940116 for a total of 8 parcels/1.63 acres. This prime location with great visibility sits at the corner of Ogden Ave and Route 53 with 268 ft of frontage! The property is close to Downtown Lisle, Burlington railway and I88 access and is zoned Mixed Use and Residential with the potential for re-zoning.
PRIME LOCATION POTENTIAL LAND ASSEMBLAGE in Lisle being sold in conjuction with MLS 11940573 for a total of 8 parcels/1.63 acres. This prime location with great visibility sits at the corner of Ogden Ave and Route 53 with 268 ft of frontage! The property is close to Downtown Lisle, Burlington railway and I88 access and is zoned Mixed Use and Residential with the potential for re-zoning.
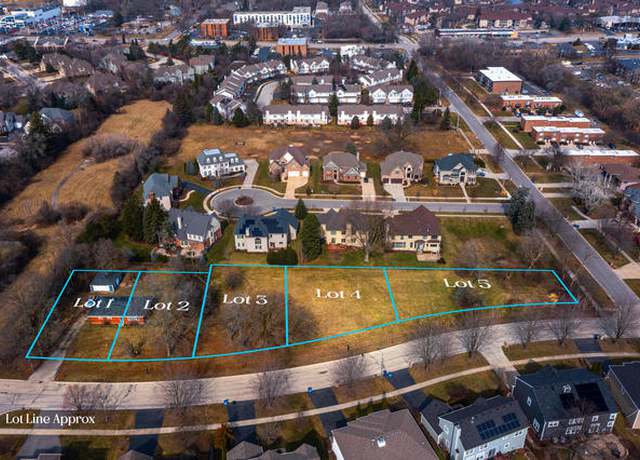
3 Acres of land available to build 5 homes in Lisle. Excellent opportunity for Builders / Developers to build in an area of high-end homes. All utilities near the site on Burlington Ave. (Water, gas, electric and sewer). Excellent location close to shopping, restaurants, and I-88 & I -355, near Ogden Ave. Naperville High Schools (Dist. 203)
SIMPLY STUNNING, RARE OPPORTUNITY! LOTS 1 & 3 ARE GONE! This is your chance to own over half an acre of the good life in Lisle, secluded, yet close to it all! Let award winning Cesario Builders, certified Green Home Builder, build your custom dream home. Discerning buyers will appreciate the high level of workmanship, energy efficient products and architectural detail. Put down roots here with excellent Wheaton District 200 schools, minutes from I-88, shopping, dining and entertainment. Fully improved with street, curb, sanitary & water. Sidewalks are to be part of building the home. Reward your hard work and live your dreams!
Based on information submitted to the MLS GRID as of Sun May 05 2024. All data is obtained from various sources and may not have been verified by broker or MLS GRID. Supplied Open House Information is subject to change without notice. All information should be independently reviewed and verified for accuracy. Properties may or may not be listed by the office/agent presenting the information.
School data is provided by GreatSchools, a nonprofit organization. Redfin recommends buyers and renters use GreatSchools information and ratings as a first step, and conduct their own investigation to determine their desired schools or school districts, including by contacting and visiting the schools themselves.Redfin does not endorse or guarantee this information. School service boundaries are intended to be used as a reference only; they may change and are not guaranteed to be accurate. To verify school enrollment eligibility, contact the school district directly.
Homes for sale in Lisle have a median listing price of $357K. Some of these homes are Hot Homes, meaning they're likely to sell quickly.
What are some of the most popular neighborhoods in Lisle?
Popular neighborhoods include St. Joseph Creek, Green Trails, Four Lakes, Downtown, Belmont, and Kohanaiki Ahupua`a.
How often does Redfin update their new listings?
Most of our new listings in Lisle are updated every 5 minutes so you can see new homes as soon as they come on the market. Learn more
What is transportation like in Lisle?
Lisle, Illinois boasts a well-connected transportation network, making it convenient for residents to navigate the region by car. The area experiences moderate traffic levels, ensuring a smooth driving experience. Public transportation is available in Lisle, Illinois, with Metra's BNSF Railway Line providing easy access to downtown Chicago. Additionally, Lisle is conveniently located near major highways like Interstate 88 and Interstate 355, facilitating effortless commutes to neighboring regions. Learn more on our Lisle city guide.
What types of properties are available in Lisle?
Lisle, Illinois offers a variety of single-family home types, including ranch-style homes, split-level homes, and contemporary-style homes. These homes can be found throughout the town, with ranch-style homes typically built in the 1950s and 1960s, split-level homes built in the 1970s and 1980s, and contemporary-style homes built in the 1990s and 2000s. To explore different property types for sale in Lisle, Illinois, use the 'Home type' filter located above the active listings. Customize your search by selecting options like single-family homes, condos, townhomes, and more.
What is life like in Lisle?
Lisle, Illinois is characterized by its serene surroundings, with a mix of urban and suburban landscapes. The area experiences all four seasons, with warm summers and cold winters. The town offers a range of job opportunities across various industries, with a focus on technology and healthcare. Residents can engage in a variety of recreational activities, such as exploring the numerous parks, participating in local sports leagues, and enjoying the vibrant arts and culture scene. Additionally, the town hosts community events and festivals throughout the year, providing ample opportunities for residents to socialize and connect with one another.
What are the schools and amenities like in Lisle?
Lisle, Illinois offers a variety of public amenities to enhance the living experience of its residents. The town boasts a range of dining options with numerous restaurants serving a variety of cuisines. For outdoor enthusiasts, there are several parks available for recreational activities. Grocery shopping is convenient with a number of grocery stores spread throughout the town. Moreover, Lisle provides additional amenities including libraries, fitness centers, and educational institutions, all contributing to a well-rounded community lifestyle.
In the past month, 17 homes have been sold in Lisle. In addition to houses in Lisle, there were also 21 condos, 6 townhouses, and 1 multi-family unit for sale in Lisle last month. Lisle is a minimally walkable city in Illinois with a Walk Score of 37. Lisle is home to approximately 21,941 people and 22,218 jobs. Find your dream home in Lisle using the tools above. Use filters to narrow your search by price, square feet, beds, and baths to find homes that fit your criteria. Our top-rated real estate agents in Lisle are local experts and are ready to answer your questions about properties, neighborhoods, schools, and the newest listings for sale in Lisle. Our Lisle real estate stats and trends will give you more information about home buying and selling trends in Lisle. If you're looking to sell your home in the Lisle area, our listing agents can help you get the best price. Redfin is redefining real estate and the home buying process in Lisle with industry-leading technology, full-service agents, and lower fees that provide a better value for Redfin buyers and sellers.


 REDFIN IS COMMITTED TO AND ABIDES BY THE FAIR HOUSING ACT AND EQUAL OPPORTUNITY ACT. READ REDFIN'S FAIR HOUSING POLICY AND THE NEW YORK STATE FAIR HOUSING NOTICE.
 United States
 Canada