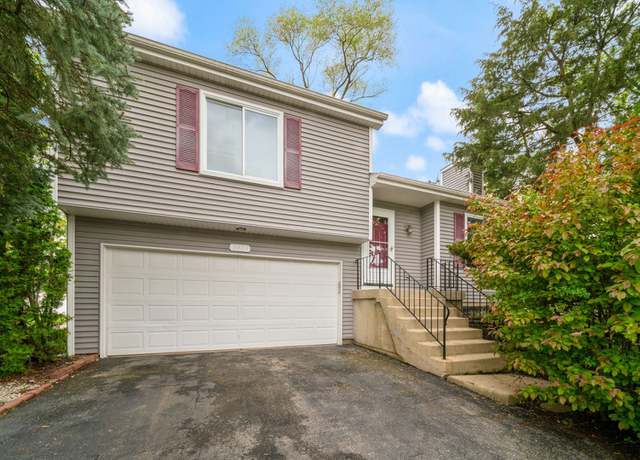
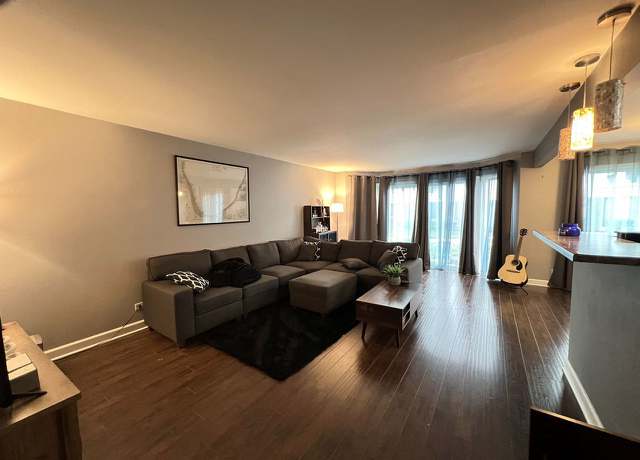
* Welcome to 2409 Danbury Drive! * This stunning 3-bedroom, 2.5-bathroom home in Woodridge, IL, boasts a perfect blend of comfort, style, and functionality. As you step inside, you'll be greeted by the bright airy living area, completed with: - Gleaming hardwood floors and soaring ceilings. The beautifully appointed kitchen features: Quartz countertops, Stainless steel appliances, ample cabinetry and counter space. The three spacious bedrooms offer Vinyl plank flooring and generous closet space. The Master Bedroom has a master bath with modern fixtures and a lovely bathtub for your relaxing end-of-day enjoyment. Additional highlights include A fully finished lower level with a family
Welcome to this charming 1st-floor condo offering 2 bedrooms and 2 bathrooms, perfectly situated near I-355 and I-88 for easy commuting. Enjoy the contemporary design and comfortable atmosphere all within an open floor plan that enhances the living space. The updated condo boasts a modern kitchen with custom cabinetry and stainless steel appliances. Spacious bedrooms with ample closets and storage. Enjoy the comfortable atmosphere in each bedroom, adding to the overall appeal of this wonderful home. Both bathrooms in this condo have been beautifully updated to offer a luxurious and modern feel. The laminate wood flooring throughout adds a touch of elegance. Additionally, the assessment cove
"NAPERVILLE SCHOOLS!! LARGEST MODEL!! Welcome to Fairways of Hobson Creek! This stunning end unit townhome offers a sundrenched open floor plan with 2-bedrooms plus an enormous loft for gaming, reading or converting to a 3rd bedroom. Boasting an impressive 2156 sq ft, this home features a dramatic 2-story formal living and dining areas, perfect for entertaining guests. The spacious eat-in kitchen offers ample cabinets and countertop space. Relax in the cozy family room, complete with a fireplace, or escape to the enormous owner's suite, featuring a private luxury bath and a walk-in closet. The full basement is an additional 1016 sq ft awaiting your finishing touches. Enjoy summer days
RARELY SEEN 4 BEDROOM, 2.5 BATHROOM END UNIT TOWNHOME WITH AMAZING LOCATION IN PRESTIGIOUS UPTOWN PARK AT SEVEN BRIDGES. GOURMET KITCHEN HAS LARGE CENTER ISLAND, STAINLESS STEEL APPLIANCES, GRANITE COUNTER TOPS, DUAL OVENS WALK-IN PANTRY, HARDWOOD FLOORS AND PLANNING DESK AREA THAT LEADS OUT TO BALCONY. SEE THROUGH FIREPLACE BETWEEN DINING ROOM AND FAMILY ROOM. MASTER BATHROOM HAS DUAL SINKS AND LARGE WIC. LAUNDRY ON TOP FLOOR. BEDROOM ON LOWER LEVEL PERFET FOR GUESTS. LOCATION CAN NOT BE BEAT! LITERALLY NEXT TO A SMALL PARK AREA. WALKING DISTANCE TO SEVEN BRIDGES GOLF COURSE, CINEMARK MOVIE THEATER, SHOPS, RESTAURANTS, GYM, ICE SKATING ARENA, AND MORE! MOVE-IN READY. SELLERS KEPT THIS IN G
HOLY COW!! New concrete steps and landscaping in the front yard greets you into this amazing and enormous home has undergone quite a transformation! Double side light windows in the front door lead into: All new plush carpeting and paint sprucing up this very spacious 4 bedroom, 3 full bath beauty! ALL NEW KITCHEN just completed will dazzle you! New white cabinets, appliances, countertops and the addition of the cutest bar/eating area that would also make a great work station! The glass fronts of the cabinets make for a great showcase of your nicest dishware or treasures. The address says Street, but feels like Court because it's located in a quiet corner. The owner's bedroom is large wi
This one will knock your socks off/Location is everything/Walk to Theater, Store, Restaurant/Right across from Seven Bridges Golf course/Close proximity to 355/88/This 4 years old townhome offers a perfect blend of modern luxury and urban convenience/The truly 3 bedrooms, 2.1 bath and 2 attached garages/The first floor features a versatile flex room with French door, recessed can lights & brand-new carpet, perfect for a home office or gym, along with an abundance of storage space, providing endless possibilities to fit your lifestyle needs/The most upgraded and gorgeous dream kitchen is in the 2nd floor with 9' ceiling /Enjoy all your gathering and holidays in this desirable open area
Beautifully Updated Home situated on a . 25 Acre Lot in the Highly Sought After Dunham Place. THIS is the Wonderful Friendly Neighborhood and Turn-Key property you have been waiting for on an incredibly RARE 85x130 expansive lot. So many updates, designed to perfection, and meticulously maintained. .. this home has it all. 3 Bedrooms, 2.5 Bathrooms, 2 Car Garage, Fully Fenced Yard, and the most wonderful backyard! First floor features updated kitchen (2015) with new white cabinets, granite countertops, pantry cabinet, and stainless steel appliances. Bright and open living room, dining room open to the kitchen with eating area, vaulted family room with sliding glass door walkout to the AMAZ
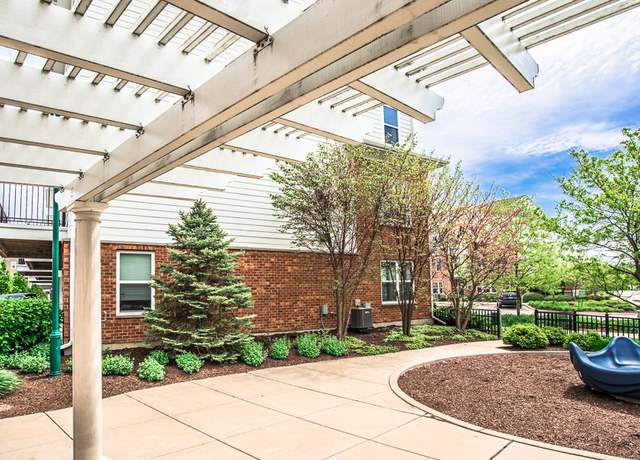
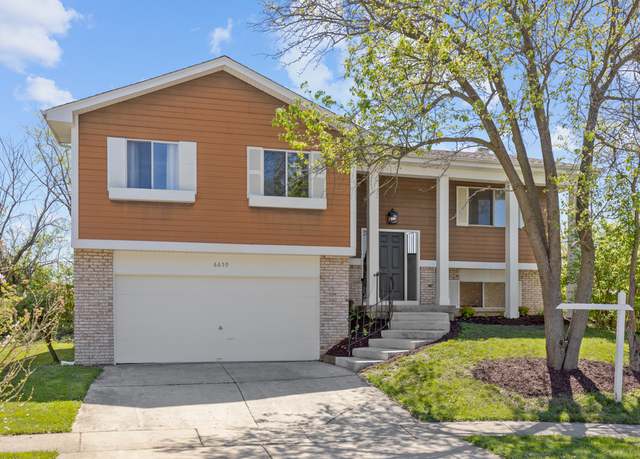
Come and view this beautiful 4-bedroom split level home with a sub-basement. Gallagher and Henry model. Large yard with an attached deck featuring a pergola. Well maintained home with several updates including New windows, gutters and floors. 30-year warranty on exterior upgrades. All appliances included. Hurry on this one!
Beautiful one owner home in sought after Downers Grove! Recent updates include concrete driveway and entry sidewalk in 2023, all windows and siding replaced in January 2024 with the exception of the bay window on front of home. The roof is scheduled to be replaced in May of 2024. Many upgrades when the house was built, tons of storage throughout. Lower level bedroom currently being used as an office but can easily be converted back to 4th bedroom. Family room is huge and has a gas fireplace to warm you on those cool evenings. Home also boasts an ample patio for outdoor entertaining. Location is prime for shopping, dining out and commuting. Not much to do but call this one home!
TRULY A ONE-OF-A-KIND REDESIGNED HOME WITH MANY ARTISTIC DETAILS ON WIDE CORNER LOT!! This home has been COMPLETELY REDESIGNED with a DREAM KITCHEN, hardwood floors throughout the main level, and added access to the backyard!! Attention to detail describes this open and expanded kitchen with vaulted ceiling that will WOW you when you walk in the door. Complete with soft close doors/drawers, crown molding, island/breakfast bar, granite countertops, tile backsplash, stainless steel appliances, butlers pantry, glass doors, and elegant copper light fixtures. Spill your gatherings out into the backyard with the newly added maintenance free deck and fenced back yard!! THE MASTER BEDROOM SUITE IS
EAST CENTRAL NAPERVILLE LOCATION IN SCHOOL 203 ON 3/4 ACRE LOT/BRIGHT, OPEN AND AIRY WITH HIGH CEILINGS, SKYLIGHTS, PICTURE WINDOWS/FIRST FLOOR MASTER BEDROOM SUITE WITH UPDATED MASTER BATH AND SUNDROOM ADJACENT TO A 21x13 COVERED PORCH /UPDATED KITCHEN WITH DOUBLE SIDE CABINETS PLUS A SPACIOUS BREAKFAST ROOM WITH FOUR LARGE PICTURE WINDOWS OVERLOOKING THE DECK/NEW UPGRADED ROOF AND ALL NEW VELUX SKYLIGHTS W SOLAR SHADES INSTALLED IN NOV, 2023/OVERSIZED 3 CAR GARAGE CAN PARK 5 CARS OR FOR SRORAGE(1227 SQ FT)/SECOND FL TWO BEDROOMS WITH JACK AND JILL BATH, SEPARATE SHOWER AND TUB/TWO STAIRWAYS TO FINISHED BASEMENT APPROXMATELY 2300 SQ FT/NEW CARPET ON SECOND FL AND 2ND BEDRM ON MAIN FL, 2024
Walk thru the doors of possibilities and opportunities that this charming updated ranch home on oversized lot offers its new Owner. Home sits on a Sub-Dividable 157' x 134' 1/2 acre lot (. 486 to be exact!). Live in and build on or expand and update . .. the potential is endless. This lovely home has had many updates over the years to create a "move right in" opportunity for the right buyer or investor. Some of the Special Features of the home are * Refinished Hardwood Floors, * Some Freshly Painted Rooms, * Updated Kitchen with Professionally Painted Oak Cabinets, New Stainless Steel Appliances, New Counters, SS Farm Sink and New Flooring with French Doors to HUGE covered and pr
Welcome to The Residences at Seven Bridges. Tastefully updated condominium located in the heart of Woodridge offers a carefree lifestyle near many restaurants, Cinemark Theatre, Seven Bridges Golf Course, Edward Health and Fitness Center and much more. Excellent location for Chicago commuters with easy access to the train station and tollways. Stylish open floor plan with 9' ceilings, white trim, white six-panel doors and neutral decor. The kitchen features 42" cabinets, granite countertops, breakfast bar, stainless steel appliances, new lighting fixture and plenty of storage space. The combined living room and dining room are light and bright with a gorgeous west facing view overlook
Welcome to this charming 4 bedroom and 2 full bath T-raised ranch with a den nestled in a serene neighborhood, offering spacious living with a plethora of modern amenities. The eat-in kitchen is a chef's delight, boasting all-wood custom extra deep cabinets, a lovely tile backsplash, and newly refinished hardwood floors. The kitchen leads to the deck and fully fenced backyard. The cozy living room features gleaming hardwood floors and abundant natural light, creating a warm and inviting atmosphere. The primary bedroom is a retreat, featuring newly refinished wood flooring, a ceiling fan for added comfort, built-in cabinets, and a spacious closet. Additionally, there are four more generously
New Construction home featuring many upgrades included! This exquisite custom built RANCH HOME offers one level luxury living and has been designed to impress with outstanding quality, specifications and features. 3 car garage. Dramatic entrance foyer with 13' ceiling. Hardwood floors throughout. Gourmet kitchen featuring top of the line appliances including WOLF stove and microwave, BOSCH refrigerator and MIELE dishwasher. Kitchen also features walk in pantry and large island with custom cabinetry, Caesarstone quartz countertops and skylight over island. Open great room has 16' cathedral ceiling, stone fireplace and access to exterior Trex deck that overlooks nature preserve and forest pre
Beautifully updated and ready for new owners! Garage space galore!!! Room for four cars! The home sits proudly within an excellent school district, enhancing its appeal! Beautiful new kitchen with white shaker style cabinets (40 inch, soft touch), quartz countertops and all stainless appliances. New exterior paint, new vinyl plank flooring in the entire house including the finished basement. New light fixtures throughout, freshly finished staircase, new paint throughout interior, updated bathrooms, new garage doors on attached garage, new garage door openers, Some new windows. Enjoy the convenience of having shopping venues within a stone's throw away and swift access to I355, I55, and I88.
The house needs work or tears down. The house is on a 2.3 Acres land with - zoned for ORI Office / Research / Light Industrial. GREAT LOCATION, Close to I-55, Rt 83 and Rt 53. The house is being sold as is.
BUILD YOUR DREAM HOME ON THIS AMAZING LOT CLOSE TO DOWNTOWN LEMONT, METRA, I-55, I-355 WOODRIDGE MAILING ADDRESS * DUPAGE TAXES * AWARD WINNING LEMONT SCHOOLS * NO HOA * BUILD WHAT YOU WANT ONCE APPROVED BY THE VILLAGE
This is vacant lot is zoned ORI, Office, Research and Light Industrial. The property is located in an area which currently has commercial offices/warehouse buildings. Note the lot has wetlands in the front. Buyers Agent must accompany clients when walking the property. Co-Listing agent is related to one of the sellers.
Prime parcel of land zoned R3. Unincorporated Downers Grove on the border of Woodridge and Darien. 2 lots are both 180 x 233 and could be subdivided into a total of 4 lots. Multi-family or commercial projects would need rezoning. Lots of new development in the surrounding area with great access to X-press ways makes a great opportunity for the savvy investor.
Gorgeous and most affordable lot in prestigious Downers Grove. Build your dream home on this lot nestled on wooded . 86 acres. Some of the neighboring homes are annexing into Woodridge and this lot can be annexed as well. Conveniently located to I-355.
.89 ACR land development opportunity in unincorporated Downers Grove, Illinois. This property, zoned R-3, is adjacent to Interstate 55 with 180' frontage along 83rd Street. The Village of Downers Grove is located 22 miles west of Chicago in DuPage County, Illinois.
LOOK AT THIS OPPORTUNITY TO ACQUIRE LAND IN A PRIME LOCATION WITH HUGH EXPOSURE!! MANY DEVELOPMENT POSSIBLITIES. THIS 1.1 ACRES OF COMMERCIAL PROPERTY IS ZONED O. R. I. (Research and light industrial in Woodridge with a Downers Grove mailing address) ADDITIONALLY THIS PROPERTY CAN BE COMBINED WITH NEIGHBORING PROPERTIES TO CREATE A LARGER PARCEL. CALL TODAY FOR ADDITIONAL INFORMATION. PLEASE CHECK AND CONFIRM WITH THE VILLAGE OF WOODRIDGE FOR ALL POSSIBLE USES
Check out one of the most beautiful lots on one of the most beautiful streets in DuPage County. A chance to move onto a street like this doesn't come around very often. Drive down a quiet, winding street filled with mature trees that feels like stepping back in time. This neighborhood was settled more than 20 years before the subdivisions were even started. And this is the only undeveloped lot in this secluded paradise. Over 1 acre in size and convenient to 355 and 88, and only minutes from the train. Acclaimed Downers Grove North school district. A private yard with densely wooded screening in front and back. Behind is a community bike path with short walk to Castaldo Park, home to sand vo
Wooded . 52 acre site. Corner lot on cul de sac. Not many opportunities left to build in unincorporated Lemont. No covenants or restrictions. Minutes to golf courses, horse stables, The Forge Adventure Park, Blue Ribbon Lemont High School. Highly Rated grade schools, Metra, dining and shopping. Low unincorporated property taxes. Call listing agent for details. Business View magazine recently stated "Village of Lemont, Illinois is steadily becoming a recreation mecca for Millennials, young professionals, families, and entrepreneurs looking to join a strong, tight-knit community and enter an untapped market fueled by energetic and active people"
Based on information submitted to the MLS GRID as of Sun May 05 2024. All data is obtained from various sources and may not have been verified by broker or MLS GRID. Supplied Open House Information is subject to change without notice. All information should be independently reviewed and verified for accuracy. Properties may or may not be listed by the office/agent presenting the information.
School data is provided by GreatSchools, a nonprofit organization. Redfin recommends buyers and renters use GreatSchools information and ratings as a first step, and conduct their own investigation to determine their desired schools or school districts, including by contacting and visiting the schools themselves.Redfin does not endorse or guarantee this information. School service boundaries are intended to be used as a reference only; they may change and are not guaranteed to be accurate. To verify school enrollment eligibility, contact the school district directly.
Woodridge, Illinois is well-served by a variety of transportation options, making it easy to navigate by car. The traffic levels in Woodridge are generally moderate, ensuring a smooth driving experience for residents. Public transportation is available in Woodridge, with several bus routes and train stations providing convenient commuting options. Additionally, Woodridge is located near several major highways, including I-355 and I-55, providing quick access to surrounding areas. Learn more on our Woodridge city guide.
What types of properties are available in Woodridge?
Woodridge, Illinois offers a variety of single-family home types, including ranch-style homes, split-level homes, and contemporary-style homes. These homes can be found throughout the different neighborhoods of Woodridge, such as Seven Bridges and Winston Hills. Most properties in Woodridge, Illinois feature three to five bedrooms and were built between the 1960s and 1990s. To explore different property types for sale in Woodridge, Illinois, use the 'Home type' filter located above the active listings. Customize your search by selecting options like single-family homes, condos, townhomes, and more.
What is life like in Woodridge?
Woodridge, Illinois offers a peaceful and serene living experience with its picturesque landscape. The town experiences a variety of weather throughout the year, from warm summers to cold winters, providing a diverse climate. The area boasts a range of job opportunities across various industries, ensuring ample employment prospects for residents. Woodridge presents an array of recreational activities, such as parks, trails, and sports facilities, catering to different interests and hobbies. With a vibrant local scene, residents can enjoy a plethora of dining options, shopping centers, and community events.
What are the schools and amenities like in Woodridge?
Woodridge, Illinois offers a variety of public amenities to cater to the diverse needs and interests of its residents. The town boasts an array of restaurants, offering a wide range of cuisines to satisfy your culinary cravings. For those who enjoy outdoor activities, numerous parks provide a tranquil setting for leisure and recreation. Grocery stores are also plentiful in Woodridge, ensuring residents have easy access to daily essentials. Additionally, other amenities such as fitness centers, libraries, and community centers are available, enhancing the quality of life in Woodridge.
In the past month, 29 homes have been sold in Woodridge. In addition to houses in Woodridge, there were also 12 condos, 13 townhouses, and 0 multi-family units for sale in Woodridge last month. Woodridge is a minimally walkable city in Illinois with a Walk Score of 32. Woodridge is home to approximately 32,435 people and 11,198 jobs. Find your dream home in Woodridge using the tools above. Use filters to narrow your search by price, square feet, beds, and baths to find homes that fit your criteria. Our top-rated real estate agents in Woodridge are local experts and are ready to answer your questions about properties, neighborhoods, schools, and the newest listings for sale in Woodridge. Our Woodridge real estate stats and trends will give you more information about home buying and selling trends in Woodridge. If you're looking to sell your home in the Woodridge area, our listing agents can help you get the best price. Redfin is redefining real estate and the home buying process in Woodridge with industry-leading technology, full-service agents, and lower fees that provide a better value for Redfin buyers and sellers.


 REDFIN IS COMMITTED TO AND ABIDES BY THE FAIR HOUSING ACT AND EQUAL OPPORTUNITY ACT. READ REDFIN'S FAIR HOUSING POLICY AND THE NEW YORK STATE FAIR HOUSING NOTICE.
 United States
 Canada