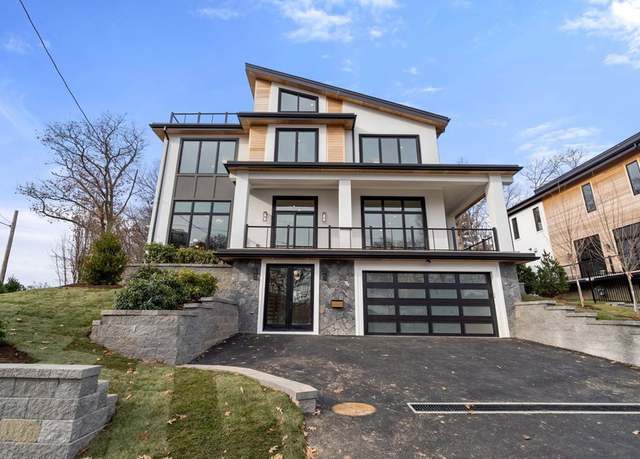
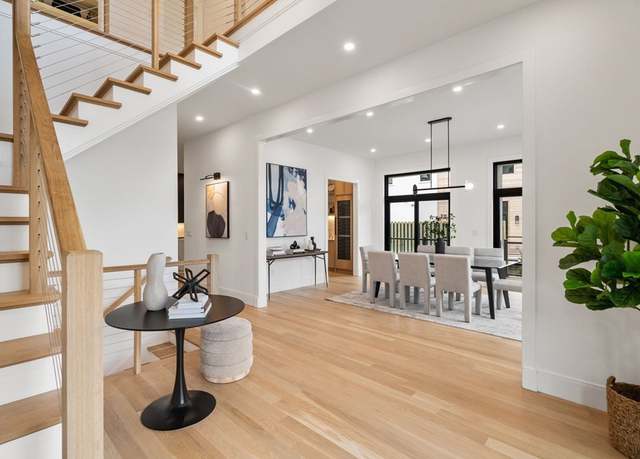
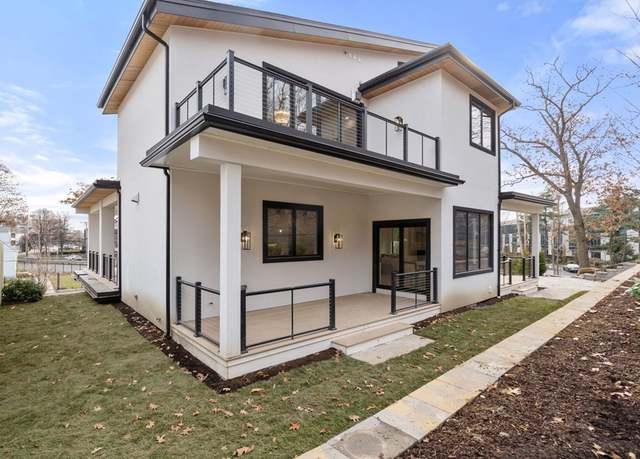
Just completed stunning new construction residence with custom luxury finishes throughout in desirable Chestnut Hill Newton under $2.5 million. Professionally designed home by premier local builder features an ideal open floor plan, high ceilings, floor to ceiling windows and gorgeous outdoor spaces, offering 5 bedrooms, 5 full and 1 half baths including a main level guest suite/office with full bath and walk-in closet. Multiple living spaces on the main level provide access to large wrap-around porches, decks and patios. The oversized entertainer's kitchen includes top-of-the-line Miele appliances, a mammoth island, breakfast area, walk-in pantry, and butler's pantry with a seven-foot tall
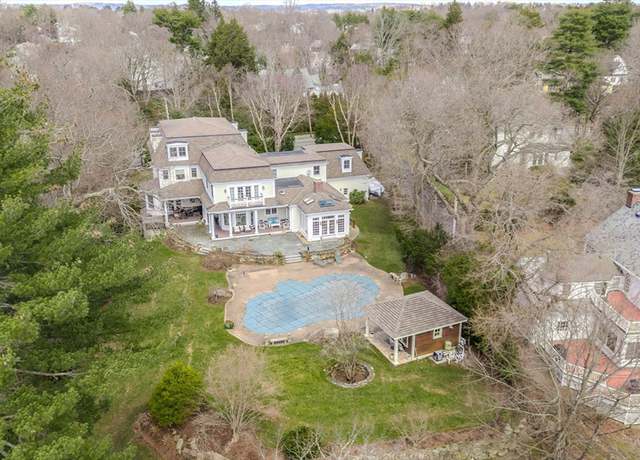
Luxury living, perfected. This magnificent estate boasts an impressive 10 bedrooms and 8 bathrooms, offering unparalleled opulence at every turn. As you step inside, you are greeted by the grand foyer leading you into the heart of the home - the gourmet kitchen, complete with high-end appliances, custom cabinetry, and a breakfast nook bathed in natural light. Entertain guests in style in the expansive living spaces featuring high ceilings, exquisite finishes, and panoramic views. Outside, a private oasis awaits with an in-ground gunite pool surrounded by lush landscaping, a three-season sunroom, and a spacious patio. Retreat to the primary suite as you pamper yourself in the lavish ensuite
Don't miss this freshly updated gem on a quiet street in one of the most desirable areas of Newton. Walk to public transportation, Newton North High School, parks, shops, restaurants and places of worship. Enjoy the soaring 9.5 foot high ceilings on the first floor and breathtaking new windows throughout. Modern custom kitchen boasts high end appliances and lots of storage. Gleaming contemporary staircase leads to the 3 sizeable bedrooms on the second floor, where washer and dryer are also conveniently located. Brand new 100% wool carpet just installed in master closet and upstairs hallway, all new windows installed in 2022, new gas heating system installed in 2018. Nothing to do but move i
Terrific opportunity to own a rare four family home in a great location in Newton just minutes from the Mass Pike and right on the express bus line to Boston. There are 2 one-bedroom apartments on the first floor and 2 two-bedroom apartments above, one of which duplexes into the 3rd floor (the other can probably be enlarged into the 3rd floor also). Several rooms have 10 foot ceilings, suggesting each unit could remove the drop ceilings to go full height for impressive spaces. The basement is unfinished but has a high ceiling, and there are * 4 furnaces * 4 hot water tanks * & * 4 electric meters * Long term tenants with leases expiring this summer, but would like to extend with n
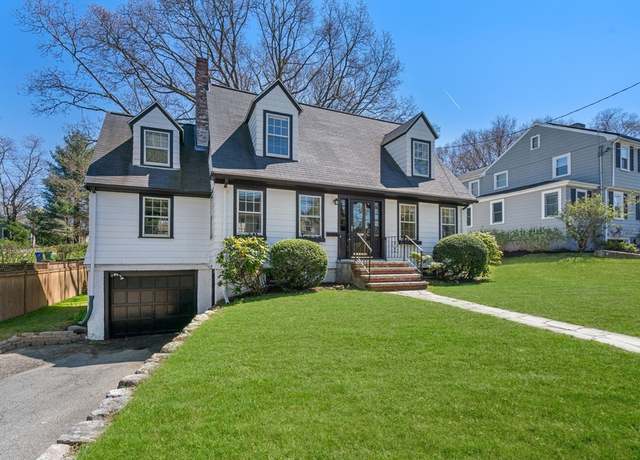
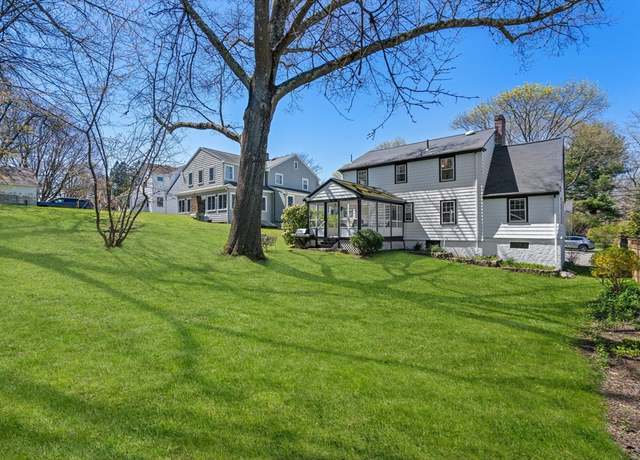
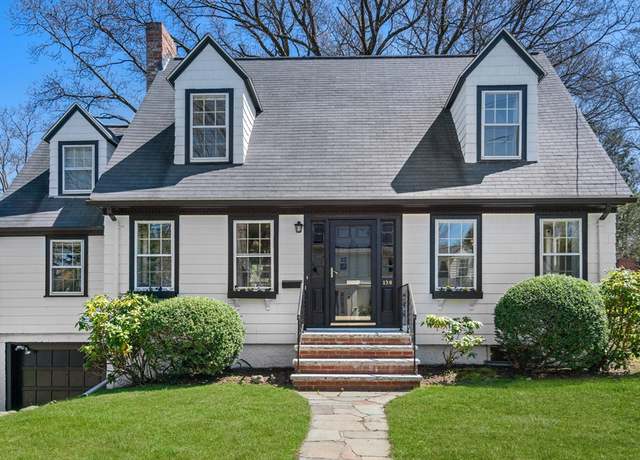
Picturesque cape in wonderful, quiet neighborhood that has seen amazing growth in the last several years. A front to back spacious living room with fireplace, built-in bookshelves with cabinetry, and window seat, leads to a comfortable wood paneled den or home office with fabulous storage. The dining room is well proportioned and light filled. Eat-in stainless/granite kitchen, with pantry, opens onto a three-season porch overlooking expansive backyard; perfect for summer entertaining. Second level consists of primary bedroom with oversized en-suite bath and huge dressing room/closet, and generous 2nd and 3rd bedrooms along with another full bath. Lower level is divided into playroom on one
This charming Queen Anne Victorian on West Newton Hill exudes elegance and timeless appeal. Situated on a picturesque half-acre of lush land, this home showcases intricate architectural details throughout. Upon entering, you're welcomed by a grand foyer adorned with stained glass windows, leading to the formal living room, library, and dining room, all boasting cozy fireplaces. The main level also features an oversized kitchen with a sun-drenched breakfast room, perfect for enjoying morning coffee, and offering access to a spacious deck, ideal for outdoor gatherings. The 2nd level is home to an en-suite primary bedroom, along with three additional bedrooms and a full bathroom. On the 3rd fl
Presenting a rare gem in Chestnut Hill! This much desired penthouse corner unit is bathed in abundant natural light and boasts a spacious one-bedroom floor plan with soaring cathedral ceilings. The updated kitchen features sleek and neutral countertops, gas cooking, and leads to a generously sized dining area, perfect for entertaining. Overlooking the living room with beautiful wood flooring, it's an ideal space for both work and relaxation. Floor-to-ceiling glass sliding doors open to a private oversized balcony, creating an inviting indoor-outdoor flow. Completing this unit is a beautifully maintained updated full bath with Jacuzzi tub and
This meticulously renovated 3 bed/2.5 bath home is ideally located on a quiet, dead end street, walking distance to houses of worship, Newton Centre shops/train, and Ward Elementary. Enter through a charming vestibule to find a living room full of natural light that blends character with modern style, anchored by a working fireplace, that flows into a fully renovated eat-in kitchen featuring built-in dining nook, spacious pantry, large peninsula with bar seating, quartz countertops, and stylish wainscoting. Enjoy low maintenance with newly replaced wood flooring, electrical panel/wiring, boiler, air handler, and condensers. Adjacent to the kitchen is a cozy sunroom and recently updated half
Conveniently located in the heart of Chestnut Hill is a recently renovated 2-bedroom, 1-bathroom condo. This sunny and bright condo features hardwood floors throughout and a window in every room. The condo attributes a new modern, updated eat-in kitchen with white shaker cabinets, stone countertops, and newer stainless-steel appliances. The ample bedrooms are similar in size. The condo has so many closets! Heat, hot water, 1 deeded parking space, snow removal, and grounds are included in the condo fee. The Woodside Condominium Community features an inground pool, tennis courts, barbeque area, visitor parking laundry in building and a playground. This condo is near many options for public tr
Gorgeous 2nd/top floor condo gut renovated in 2016 offering 3 bedrooms & 2.5 baths, PLUS a bonus detached studio with another full bathroom. Step inside & notice the gleaming hardwood floors & natural light throughout from the many windows. Open concept designer kitchen with breakfast bar, stainless appliances & granite counters which flows to the dining area. Spacious living room with wood burning fireplace. Large sunroom is perfect for a home office. 3 spacious bedrooms: the primary bedroom with en suite full bathroom & the other two bedrooms are linked to another full bathroom. A half bath and laundry completes this floor. Steps lead down to the lower level
Enjoy high end living in the highly desired Newton South. This spectacular custom 6 bed, 4.5 bath Colonial-style home is a must see. The dramatic entrance foyer features an 18' high ceiling, while high-end millwork and gorgeous hardwood floors are carried throughout. The newly renovated chef’s kitchen features top end appliances, huge island, large picture window, and is open to the spacious family room leading to beautifully landscaped patio and yard. The first floor also features a formal dining room, sitting/living room (w/ fireplace), and an office. The second floor features the giant master bedroom (w/ fireplace) and WIC, w/ luxurious marble bath, steam shower, and whirlpool. 5 b
Location! Location! Location! This is a modern and cozy 4 bedrooms, 3 full baths and 2 half baths townhouse residential neighborhood in the heart of Nonantum, Newton. This townhouse being built with comfort and sophistication modern living featuring open concept kitchen, flexible floor plans with high ceilings, allowed abundant natural lights, sleek gas fireplace, wide oak flooring, radiant heating in full baths, wiring for sound systems, finished basement with LED lights. The kitchen with its center island link to a graciously sized dining room in a separate dining area , perfect for meals with family and friends gathering. The entire house furnished with high-end appliances. This pet-frie
In an outstanding West Newton Hill neighborhood, this stately brick, CE Colonial with a slate roof is not to be missed. The entry with 2 closets leads to a gracious and welcoming foyer. The fireplaced LR with beautiful details and the large DR make for perfect entertaining. The spacious eat-in kitchen with a center island and desk area overlooks a dramatic family room. A cozy library/office & 1/2bath complete this floor. The charming, curved staircase brings you up to a primary suite with dressing area & bath. There are 4 additional spacious bedrooms and 3 full baths on this level. In the basement, you will find a playroom, half bath, and a large work/storage area. The two-car a
Attention Developers, Contractors, Trades Folk! Much sought after opportunity to invest and maximize your return. Are you looking for your next project or to rebuild and/or rehab for your own use? Check out this intriguing property. Start with this 1/4 acre, level corner lot in sought after Oak Hill Park, Newton Center. At present, this home has 3 bedrooms, 2 full baths. Updates and improvements could result in a home to be proud of with a floor plan that has the flexibility to accommodate the needs of a variety of end users. If your project goals are larger, rest assured that recent activity in the area should result in a substantial return on your investment.
Picturesquely set on an expansive corner lot, this spacious 1940s Colonial beckons with a blend of period details and exquisite modern updates. The elevated terrace provides a grand entrance, where you are welcomed to the front-to-back living room with its cozy fireplace, backyard views and adjacent sunlit office. At the heart of the home is a sophisticated new kitchen with custom cabinets, high-end appliances, quartz countertops, butler’s pantry and open floor plan shared with a comfortable dining area perfect for family meals and formal entertaining. Unwind upstairs in the spacious primary bedroom with updated ensuite bath, WIC and french door that reveals a private deck. Three more
On a serene and private hilltop with exquisite views, sunsets and terraced gardens, this thoughtfully expanded mid-century Colonial is ideal for family living, as well as entertaining. From the enlarged front entry take in the fire-placed living room illuminated by bay windows w/ built-ins and new hardwood floors. Steps away is the ideal den or office space w/ direct access to a wrap-around patio, perfect for relaxation. The tastefully renovated kitchen features skylights, elevated fireplace, custom cabinets, ss appliances, island, granite, cozy eating area w/ bay window, radiant heat floors and mudroom entry. Treat guests to the lovely sun-filled dining room for formal entertaining. Upstai
Sited on almost an acre in the ultimate Newton Centre location, this amazing 2007-built residence is being offered for the first time. It is the first LEED silver certified home built in New England with a focus on sustainability. An entertainer's dream featuring truly oversized rooms, a well-appointed kitchen and an enormous deck, ideal for al fresco gatherings. A first level bedroom suite is perfect for aging in place or longer term guests. On the second level is the tranquil primary suite with a deck, en suite bath & 2 dressing rooms, plus another large bedroom suite. There are 3 second level offices, one off a private staircase, allowing ample space to work from home and flexibili
Last Unit Left! Don't miss out on this luxurious brand-new townhome in the heart of West Newton, crafted by renowned local developer Westview Partners. Boasting 5 bedrooms, 4 bathrooms, and 4 levels, it's designed and tailor-made for modern living. Enjoy upscale finishes including an Italian kitchen, Thermador appliances, central vacuum, hansgrohe shower fixtures, top of the line heating/cooling systems, high efficiency heat pump water heater, nest thermostats and video doorbell. Relax in the fenced yard and private patio with a gas grille connection. Nestled in a tranquil cul-de-sac, yet close to amenities, it offers the best of both worlds. Explore nearby stores, dining, and cultural spot
Enter the well-maintained Chandler Pond Condominium complex and enjoy a beautifully manicured property with trees in full bloom. This lovely two-bedroom, one bath condo sits in an ideal location by Brighton's Chandler Pond. The well taken care of condo has an updated bathroom as well as recently updated kitchen counters. Both bedrooms have good closet space as does the front entry closet with an extra private storage unit in the basement. This tranquil condo helps you appreciate the surrounding green space, from your private balcony or on a loop around the pond, you can enjoy the grounds in each season. And in summer relax by the pool. If you have a car, enjoy your private designated place
Spectacular 2016 full renovation, this townhouse is located in the heart of Newtonville within a few steps to NNHS & close to Cabot Elementary School. Soaring ceilings & walls of glass, allows for an abundance of natural light. The fabulous open floor plan is well suited for today’s style of living. Superb cooks’ kitchen, offering lots of cabinet storage, SS appliances & a peninsula. The open space is well suited to accommodate both large & intimate gatherings. There is a beautiful deck off the living/dining room. Additionally, on the 1st level, is a bedroom or den & full bath. The 2nd floor has 3 en suite bedrooms, including a lovely primary suite
Ideally located in Waban amongst beautiful surroundings, this lovely residence was thoughtfully designed by an architect for his own home and has fantastic views of the Brae Burn Country Golf Course. Light and bright with many windows, the main level features an oversized living room, with a fireplace, overlooking luscious grounds; a wonderful family room; a spacious dining room; and a sparkling kitchen with a sleek back splash, new countertops, and a separate eating area. The second level is comprised of an expansive primary bedroom suite with a tastefully renovated bathroom, three other large bedrooms, and another renovated bathroom. The finished lower level with a full bathroom is terrif
Attention investors, developers, & homebuyers! Here's your ropportunity to own a 3-family building in desirable Newton Corner. This property offers numerous possibilities, from condo conversion potential to lucrative rentals. Featuring sleek hardwood floors, well-designed layouts, and sunny, spacious apartments with large living areas and generous bedrooms, this property stands out. Unit 1: 4 bedrooms, 2 full baths, living room, dining room, central AC. Unit 2: 3 bedrooms, 1 bath with window AC. Unit 3: 5 bedrooms, 2 full baths with central AC. Additional features include renovated kitchen in recent years, hardwood floors, central vacuum, garbage disposal, and washer/dryer hookups for
Welcome to Chestnut Hill Woods. This beautiful townhome has been meticulously maintained and is filled with natural light. Enjoy the open concept first floor that is perfect for entertaining! The kitchen with stainless appliances leads to the spacious dining area & living room with fireplace. The sliding door leads out to a private deck with a view of the conservation land. A half bath completes this floor. The second floor features the primary bedroom with ensuite full bathroom, plus another large bedroom, full bathroom and laundry. Fabulous top floor loft perfect for a 3rd bedroom and office, with a vaulted ceiling and skylights. There is 1 deeded parking space plus ample visitor sp
Watch the sunrise from this hilltop retreat overlooking Newton City Hall - just a stone’s throw from the library, dining, shopping, schools and transportation. This breathtaking new home was just finished using the best specifications in design and construction, and constructed by a highly regarded local builder. The bespoke front door and grand foyer lead to the inviting, open layout - seamlessly connected to the beautiful terrace and private landscaped yard. The kitchen boasts exquisite walnut cabinets, stone countertops and top-of-the-line Wolf and Subzero appliances. The main floor also showcases a family room with a gas fireplace feature wall, sun-filled dining room, sophisticate
Rarely available center entrance colonial in a prime Newton location. Come see this fully renovated bright and sunny three bedroom, two full bath single family home situated on a corner lot. No wasted space in this impressive floor plan which includes a spacious eat in kitchen complete with stainless steel appliances and Corian countertops and a custom pantry, a large mudroom/home office, and three good sized bedrooms. Central AC, upstairs laundry, hardwood floors, detached garage, ample off street parking, brand new large front deck complete with Trex decking and vinyl balusters. The exterior does need painting, but the heating and cooling systems and roof are both relatively new, and the
Immerse yourself in luxury stunning new construction townhouse 2 Family on the Coveted Newton Line, boasting top-quality finishes & thoughtful design. Enjoy the exclusivity of a private fenced in yards, providing a serene retreat for outdoor relaxation. The lower levels offer versatility with a bedroom guest suite or family room with a private tile bath, perfect for accommodating guests or creating a cozy haven. Entertain with ease in the bright living rooms flowing seamlessly into the dining areas & chef’s dream kitchens, complete with quartz counters, island bar, stainless steel appliances, & pantry closets. Revel in the spaciousness of soaring ten-foot ceilings, co
This stylish new construction townhome is located close proximity to Cabot School. Upon entering, you’ll find a coat closet and designer powder room with brushed brass accents. The open concept 1st floor offers many stunning features like a chef's kitchen featuring high-end appliances and gorgeous modern cabinets. The living room features a linear fireplace with Venetian plaster and a natural wood slat wall detail accent. There are 3 bedrooms on the 2nd level, including the primary suite with its very own walk-in closet and a gorgeous spa-like ensuite bathroom. A full bathroom and laundry complete this level. The fully finished 3rd floor gives you bonus space with large windows. The l
Welcome to this quintessential craftsman-style home in the heart of Waban! Meticulously maintained and thoughtfully updated. Ideal for both entertaining and intimate gatherings, its spacious rooms flow effortlessly from one to another. Step inside to find a warm foyer leading to an inviting living and den area, both boasting elegant fireplaces. The main level also features a generous dining space, a large family room, a functional office, and a chef's kitchen with a sunny eat-in area opening onto a lovely bluestone patio. Upstairs, discover a luxurious primary suite complete with a full bath, tub, steam shower, and dressing room, alongside two additional bedrooms and another full bath. Two
This meticulously maintained home exudes pride of ownership. Boasting 3 bedrooms and 3 updated bathrooms. It features a charming formal living room with a cozy fireplace and a formal dining room that seamlessly flows into a granite kitchen equipped with stainless steel appliances, complemented by a bonus breakfast nook. Hardwood floors grace the main level, while the fully finished basement offers additional living space with a fireplace family room, and a full bath. A walkout leads to a private patio and fenced-in yard, perfect for outdoor entertaining. With a separate entrance, the basement presents an in-law suite with a full bathroom and a kitchenette complete with a stove . Other highl
Nestled in the sought-after village of Auburndale, this picturesque Victorian, a timeless treasure built in 1895, seamlessly blends classic charm with modern convenience. Enter through the welcoming front porch where French doors open to the airy living & dining area, boasting lofty ceilings, ample windows, a cozy window seat, & built-ins. Sunlight floods the family room, streaming through its numerous windows and skylights, creating a warm and inviting atmosphere. The updated kitchen features granite countertops, maple cabinetry, stainless steel appliances, an eating area, & a convenient powder room. Ascend to find three well-appointed bedrooms and a family bath on the seco
Spectacular Contemporary New Construction in Waban. This home offers unparalleled craftsmanship & the highest quality finishes. Custom cabinetry adorns the sleek kitchen, equipped with top-of-the-line Thermador fridge and Wolf appliances. Entertain effortlessly with an open floor-plan, large formal dining room, covered outdoor patio and kitchen. Retreat to the spacious primary suite featuring Italian-tiled bath with heated floors, elegant soaking tub, shower, two huge walk-in closets, and private covered balcony. All en-suite bedrooms boast modern baths with wall-hung cabinetry and frameless shower doors. The finished lower level offers a bedroom with full bath, huge playroom with a w
Delightfully and beautifully decorated, this first-floor condo is in an unbeatable Newtonville location next to Cabot Park, close to Newtonville Square, the commuter rail, and plenty of restaurants, shopping and grocery. This spacious home offers 3 bedrooms, 2 full baths, 1960 sqft, and plenty of exclusive storage in the basement. A gracious front entryway leads into a grand living room, adjacent to a four-season sun room/office. The generous living room opens up into a chic formal dining room. A fantastic family room addition on the house from the kitchen offers skylights, gorgeous granite countertops, cherry cabinets, and a peninsula open to the family room, with sliders leading out to a
Stunning and spacious three-bedroom ranch nestled in the sought-after Oak Hill area of Newton! Throughout the home, you'll find gleaming hardwood floors that add to its charm. The main floor boasts three generously sized bedrooms, while the lower level is fully finished with three additional rooms. The open-concept main level includes a modern kitchen with granite countertops, stainless steel appliances, and ample storage in pristine white cabinets. The expansive living room is flooded with natural light from sunny windows and features a cozy wood-burning fireplace. Conveniently, there's garage parking for three cars directly off the kitchen. With two laundry areas—one near the master
Set on a lovely tree- lined street in Newton Center, this pristine residence is tastefully updated & has gorgeous curb appeal. Upon entering, you are led into a large living room which is enhanced w/ a gas fireplace & pretty woodworking detail. A sliding french door opens to a stunning sunroom w/ access to the exquisite yard. The elegant dining room w/ wainscoting detail leads into the eat in kitchen w ss appliances & picture window. The mudroom has radiant heated flooring. The 2nd level has 3 spacious bedrooms & a luxurious primary bedroom suite w vaulted ceiling, lots of closets & a marble appointed bathroom w/ oversized shower & double vanity. The hall
Meticulously updated & move-in-ready, this gem is perfectly nestled on a sprawling 15,000+ square foot fenced-in level lot. Newly refinished floors & fresh paint throughout. Main level features open & bright living room w/ new gas fireplace, dining area w/ chic built-in bar nook & showstopper chef’s kitchen w/ stunning quartz countertops, high-end appliances, expansive eat-in island & beautiful cabinetry. Adjoining 4-season sunroom w/ access to deck & lush yard w/ upgraded irrigation system and garden. Second level includes two generously sized bedrooms, full bath & primary bedroom w/ ensuite. Top level offers two spacious bright bedrooms &am
This charming 3-bedroom, 1.5-bathroom duplex townhouse is nestled on a quiet street in Newton, Massachusetts. Step inside and be greeted by a sun-filled living room that invites relaxation and gatherings. The well-appointed kitchen, boasting stainless steel appliances and granite countertops, is the heart of the home, where culinary creations and memorable meals await. Upstairs, you'll discover three generously sized bedrooms, each offering plenty of closet space and large windows. Recent upgrades include a brand new heating system installed in 2023 and a complete renovation of the kitchen and bathroom in 2020. As a duplex-style condominium, this residence offers the privacy and independenc
Charming tudor in an amazing neighborhood steps away from the Ward School in need of TLC. Home has wonderful layout awaiting some nice touches from the right owner. Beautiful deck off the kitchen looking out to the landscaped backyard. 2-car garage with at least 2 more outside parking spots. 1st floor has the living room, dining room, family room, kitchen, and bathroom. 2nd floor offers 3-4 bedrooms. Basement is very spacious and can be transformed to a wonderful playroom for young children. Located near Boston College, T (Green line B), and Mass Pike. Seller makes no representation about the home, buyer to do their own due diligence. Open Houses Saturday 4/27 & Sunday 4/28 from 12-2.
This bright full floor 2 bed, 2 full bath condo in Chestnut Hill is a charmer. It's situated on a dead end, private street near all of the popular shops, restaurants, medical facilities, gyms and conservation land. .8 miles to the Chestnut Hill "T". This unit has hardwood throughout, many updates including 2023 kitchen upgrades with white cabinetry, subway tile backsplash and ss appliances, some interior paint and new shower tiles (2024) The front porch area and back patio are "exclusive use" to Unit #1.This well managed condo association with low condo fees has taken great care of the building. Over the years they repaired or replaced items of necessity including gut
Explore the captivating architecture, elegance and charm of this Tudor residence in Chestnut Hill . Beautifully maintained and renovated to meet today's modern lifestyle . A formal living room adorned by walls of windows with scenic views of the city . A french-door opens to a balcony and screened porch. A seamless flow leading to a personal library enjoy a quiet moment overlooking lush greenery. A chef's kitchen with stainless steel appliances, custom cabinetry and dining area. An entertaining dining room complete the first floor. The main suite offer large built in cedar closets a stunning bath with double sinks , a steam shower and jacuzzi tub. The floor is radiant heat. Three additiona
This area's enrollment policy is not based solely on geography. Please check the school district website for more information.
Elementary schools
Middle schools
High schools
GreatSchools Summary Rating
9/10
Mason-Rice Elementary School
Public, K-5
9/10
Bowen Elementary School
Public, K-5
9/10
Angier Elementary School
Public, K-5
8/10
Peirce Elementary School
Public, K-5
8/10
Countryside Elementary School
Public, K-5
Only showing 5 of
26 elementary schools.
School data is provided by GreatSchools, a nonprofit organization. Redfin recommends buyers and renters use GreatSchools information and ratings as a first step, and conduct their own investigation to determine their desired schools or school districts, including by contacting and visiting the schools themselves.Redfin does not endorse or guarantee this information. School service boundaries are intended to be used as a reference only; they may change and are not guaranteed to be accurate. To verify school enrollment eligibility, contact the school district directly.
Homes for sale in Newton have a median listing price of $1.79M. Some of these homes are Hot Homes, meaning they're likely to sell quickly.
What are some of the most popular neighborhoods in Newton?
Popular neighborhoods include Commonwealth, Newton Centre, Belize, Oak Hill, Brighton, Brook Farm, Newton Corner, Chestnut Hill, Newton Highlands, and West Roxbury.
How often does Redfin update their new listings?
Most of our new listings in Newton are updated every 5 minutes so you can see new homes as soon as they come on the market. Learn more
What is transportation like in Newton?
Newton, Massachusetts offers a variety of transportation options to its residents. The city's road network is well-developed, though peak hours can see high levels of traffic, especially for those commuting by car. Public transportation is readily available, with the Massachusetts Bay Transportation Authority (MBTA) providing bus and rail services throughout Newton. Additionally, the city is conveniently located near major highways, including Interstate 90 and Route 128, facilitating easy access to surrounding areas. Learn more on our Newton city guide.
What types of properties are available in Newton?
Newton, Massachusetts offers a variety of single-family home types, including ranch-style homes, split-level homes, and colonial-style homes. These homes can be found throughout the city, with ranch-style homes typically built in the 1950s and 1960s, split-level homes built in the 1970s and 1980s, and colonial-style homes built in various years. To explore different property types for sale in Newton, Massachusetts, use the 'Home type' filter located above the active listings. Customize your search by selecting options like single-family homes, condos, townhomes, and more.
What is life like in Newton?
Living in Newton, Massachusetts offers a tranquil and picturesque environment with a variety of natural landscapes. The region experiences a range of weather conditions throughout the year, allowing for diverse outdoor activities. The city provides a thriving job market with a diverse range of opportunities across various industries. Residents can engage in a wide array of recreational and cultural activities, from exploring local parks and trails to enjoying the vibrant arts scene. Newton's community fosters a rich social fabric, providing ample opportunities for residents to connect and engage with one another.
What are the schools and amenities like in Newton?
Newton, Massachusetts is a city rich in public amenities that cater to the diverse needs of its residents. It boasts a variety of restaurants offering a range of cuisines to satisfy any palate. The city is also home to numerous parks, providing ample space for leisure and relaxation. For your day-to-day needs, there are several grocery stores available within the city limits. Additionally, Newton offers a host of other amenities, including but not limited to, fitness centers, libraries, and shopping centers.
In the past month, 57 homes have been sold in Newton. In addition to houses in Newton, there were also 43 condos, 42 townhouses, and 13 multi-family units for sale in Newton last month. Newton is a moderately walkable city in Middlesex County with a Walk Score of 57. Newton is home to approximately 85,245 people. Find your dream home in Newton using the tools above. Use filters to narrow your search by price, square feet, beds, and baths to find homes that fit your criteria. Our top-rated real estate agents in Newton are local experts and are ready to answer your questions about properties, neighborhoods, schools, and the newest listings for sale in Newton. Our Newton real estate stats and trends will give you more information about home buying and selling trends in Newton. If you're looking to sell your home in the Newton area, our listing agents can help you get the best price. Redfin is redefining real estate and the home buying process in Newton with industry-leading technology, full-service agents, and lower fees that provide a better value for Redfin buyers and sellers.
 REDFIN IS COMMITTED TO AND ABIDES BY THE FAIR HOUSING ACT AND EQUAL OPPORTUNITY ACT. READ REDFIN'S FAIR HOUSING POLICY AND THE NEW YORK STATE FAIR HOUSING NOTICE.
 United States
 Canada