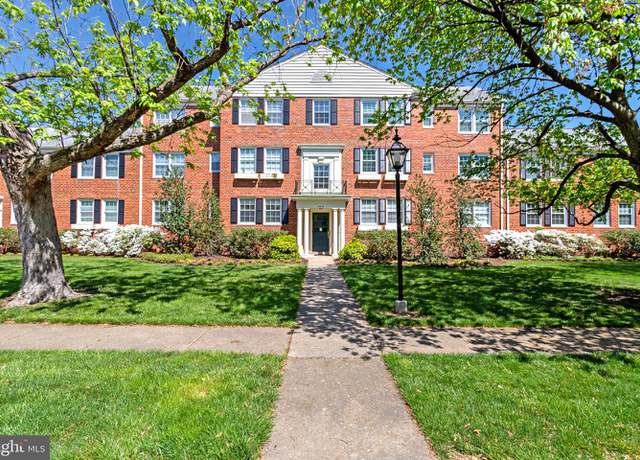
Enjoy the peacefulness of the River Towers community with all the conveniences of city living. This beautifully updated three bedroom condominium can you be your haven in the DMV. This coveted community offers lush green spaces, large community pool, picnic area, communal garden spaces, tennis courts and so much more.
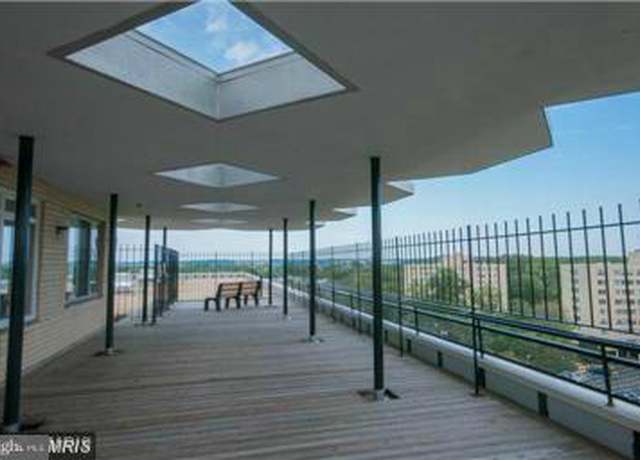
All Utilities included. Hardwood floors. Kitchen remodel two years ago. View of Dyke Marsh. Dog walk nearby. Security locked front entrance. Outdoor pool, tennis and small park. . Roof top terrace. Off GW Parkway, bike trail and Potomac River. Close to Old Town Alexandria and shopping. Pets allowed with restrictions.
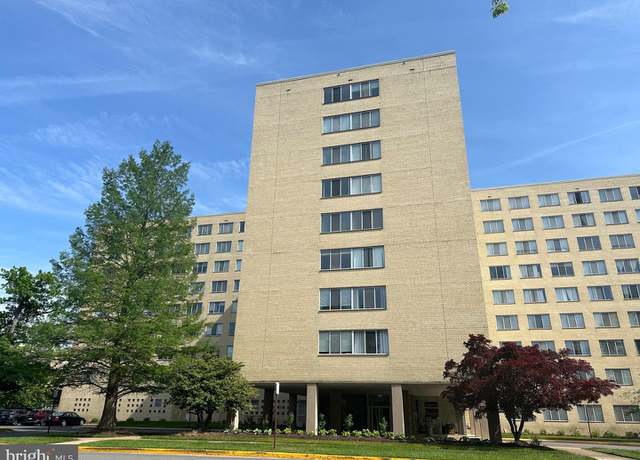
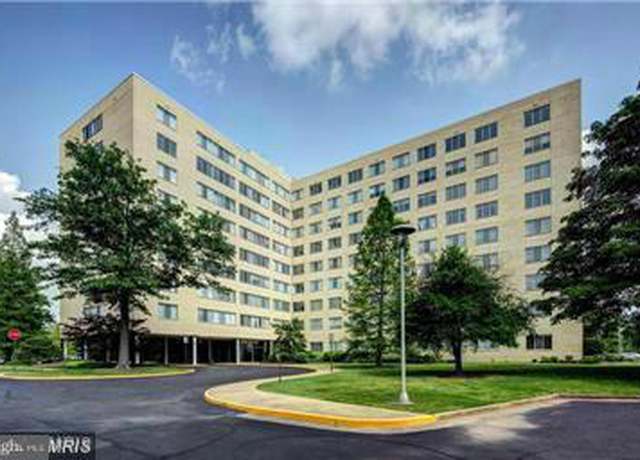
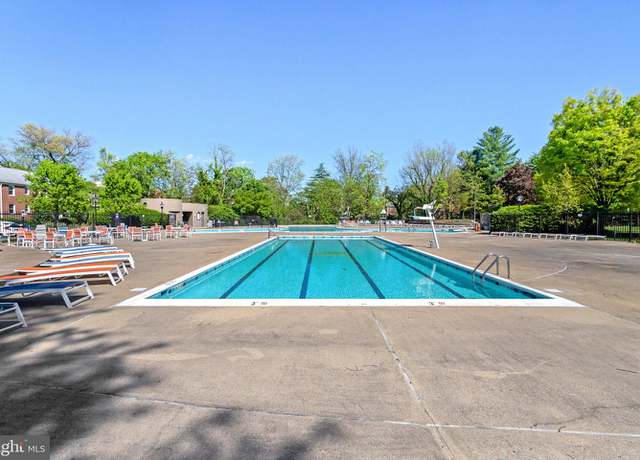
Calling all cyclists, water-lovers, sailors, walkers and joggers! This stunning pet-friendly community off GW parking, just south of Old Town, has all you could imagine on 26 wooded acres. Condo fees include ALL UTILITIES and a plethora of amenities! River Towers has a huge outdoor pool, tennis/pickle ball/basketball/volleyball courts, gardening plots, walking trails, grilling/picnic stations, playgrounds, a fitness center, club room, storage rooms (upon availability), vehicle washing area, huge common laundry on the first floor, elevators, and a rooftop deck with stunning views! Nestled in the most desirable middle building, 6631, this 8th floor spacious unit also boasts of breathtaking, p
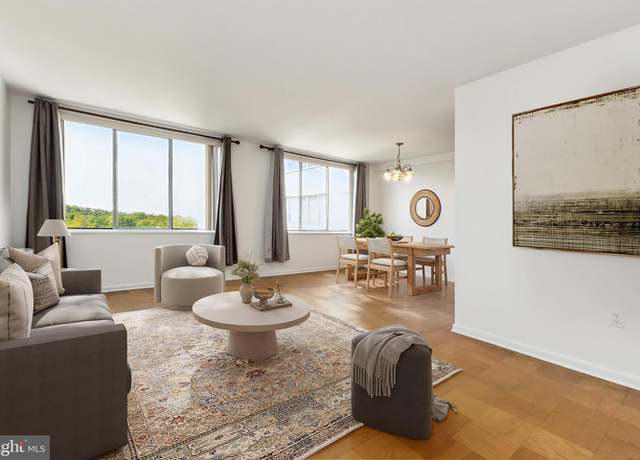
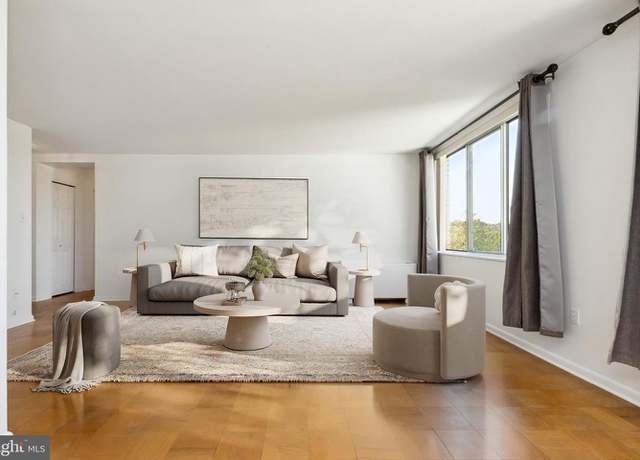
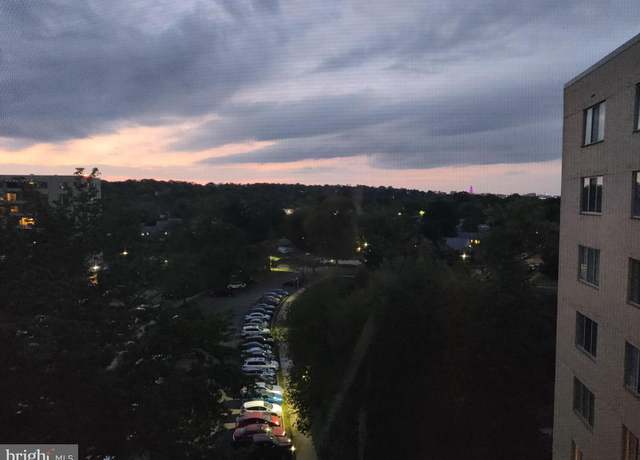
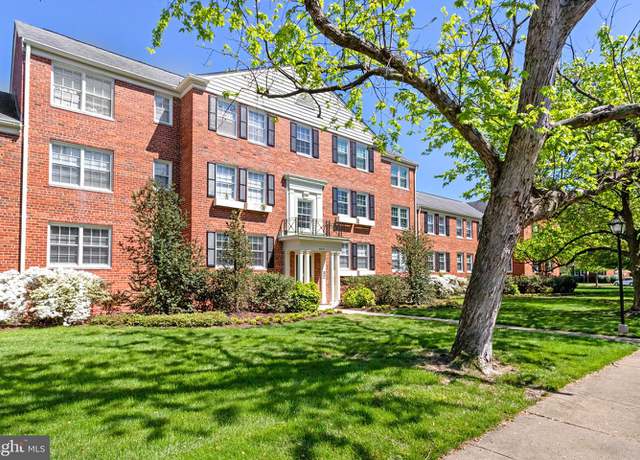
Wonderful main level 2 br/1b in popular Belle View Condos! Across from shopping and restaurants, plus the new county Rec Center is on the corner. Just south of Old Town Alexandria and all that offers! If you enjoy walking or cycling, the GW Parkway path is just blocks away! Wonderful views and nature at it's finest! Extra large storage and laundry is in door to left of this building.
Phenomenal opportunity to renovate this charming Alexandria rambler on a . 37 acre lot just moments from tons of shopping, dining, and entertainment options! Upper level features hardwood flooring, open living and dining room. Kitchen opens to deck and yard space. 3 bedrooms and a full bath complete main level. Finished lower level has 2 bonus rooms and 2 full baths, rec room, and laundry. Flat, grassy yard! Off-street parking! Property sold strictly AS-IS. This commuter-friendly location offers easy access to 495, Route 1, and Kings Hwy. Start planning your dream home now!
Expertly renovated in 2020, this refined dwelling epitomizes contemporary luxury while retaining its timeless allure. Nestled on an expansive lot exceeding one-third of an acre, the residence provides ample indoor and outdoor living space. Upon arrival, you're welcomed by an inviting open-plan living area on the main floor, seamlessly merging sophistication with practicality. The first level features a bedroom suite and a versatile den/office space, ideally suited for today's dynamic lifestyles. Ascending to the second level, ten-foot ceilings and expansive windows flood the primary suite with natural light, creating a serene retreat. The primary suite is complemented by a generously sized
Welcome to 1830 Duffied in the desirable Belle Haven on the Green community! This all-brick townhome has two large bedrooms with en-suite baths (on the upper level), the primary bedroom has a large loft - that can be used as a sitting area, gym, or office space - and a HUGE walk-in closet for all of your storage needs. The main level features the kitchen (granite counters and stainless steel appliances), living and dining areas, a half bath, and easy access to the backyard/patio area. You will love all of the natural light from the wall of windows and the warmth from the gas fireplace in the living area. The basement offers a secondary living space or bedroom (complete with a Murphy bed),
Step into luxury with this updated 3 bedroom, 2 bathroom condo, located in a vibrant community just south of Old Town Alexandria. The interior boasts a range of modern features, including a kitchen with stainless steel appliances, granite countertops, white cabinets, and a sleek ceramic tile backsplash, complemented by stylish LVP flooring and plush new carpet. The master bedroom offers a tranquil retreat with its updated master bathroom and, on select holidays, a breathtaking view of fireworks from the Belle Haven Country Club to the National Mall. Community amenities include abundant parking, designated motorcycle parking, gym/bicycle/weight room, a newly upgraded playground, garden spac
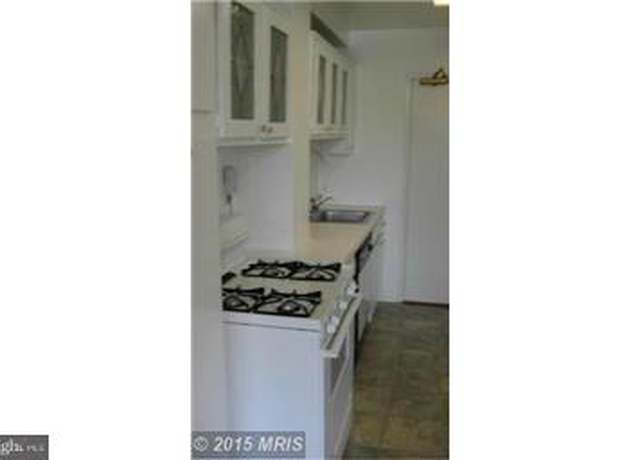
Recently renovated in the heart of MT. Vernon, surrounded by parks & trails, steps to the River, and yet just minutes to shopping, dining, and everything else Old Town has to offer! Light maple flooring line the living space, welcoming you into this 7th floor unit with plenty of natural light. Open modern floorplan. Galley kitchen with white cabinetry, quartz counter tops, and stainless steel appliances with gas cooking. Large bedroom with enough space for a home office nook, walk-in closet with Elfa custom organization. The building has a fitness center and laundry room, plus the community offers an outdoor pool, tennis courts, basketball courts, and a volleyball field.
See this Wonderfully designed Bell Haven Estates custom home located in a cul-de sac community, close to amenities, minutes from Old Town Alexandria, a short drive from the heart of DC. This approximately 6000 SF, 6 Bed, 5 and 1/2 Bath stone front Colonial features a large private rear deck overlooking mature trees and thoughtfully planted privacy shrubs. Offered are both the original lot and an additional bonus parcel, totaling (0.23+0.16=0.39)acres. The elegant entrance hall flows to formal rooms with exquisite moldings and trim, hardwood floors. The open and light-filled floor plan makes this home ideal for entertaining and everyday living. For the joy of cooking, family, and friends, th
THIS FINE HOME😊 HAS ALL THE LUXURY FEATURES YOU 'VE BEEN LOOKING FOR!!HOME HAS BEEN STYLISHLY REMODELED TO OFFER A GORGEOUS INTERIOR FULL OF DESIGNER FINICHES!!BEAULTIFUL AND MODERM 8 BEDROOMS 7.5 BATHROOMS, 3 STORY 7,000 SQ. SINGLE FAMILY HONE ON HALF AN ACRE WITH PRIVATE ENTRY ON STOKES L AND ADDITIONAL ENTRANCE ON ANTHONY ST. THIS BRETHTAKING HOUSE CLOSE TO HUNTING METRO STATION 495/395/95 INTERSTATE. GEORGE WASHINGTON PPARKWAY. OLD TOWN ALEXANDRI, DC, SHOPPING CENTERS, RECREATIONAL CENTERS AND MUCH MORE! MAIN LEVEL U WILL FIND A POWDER ROOM, LIBRARY/DEN FILLED LIVING ROOM. MSTER BEDRROM WITH SITTING AREA. STUNNING 👌RENOVATION ON ALL BATHROOMS. DECK BACK YARD PERFECT PLACE FOR HOSTING A
FANTASTIC location! 2 miles south of Old Town Alexandria and 8 miles South of Washington DC. Well maintained 2 Bedroom 1 Full Bathroom Condo in excellent condition. Main living area with beautiful wood patterned tile flooring. Updated kitchen with granite counter tops and brand-new SS appliances. New carpet in bedrooms. New light fixtures through-out. Newer windows. Spacious primary bedroom. Unit includes large basement storage space and easy access to laundry facility. Beautifully manicured grounds and on-site access to pools, tennis courts (in backyard), basketball courts, playgrounds, slides with plenty of parking. Close access to heart of DC. Ultra convenient location includes public bu
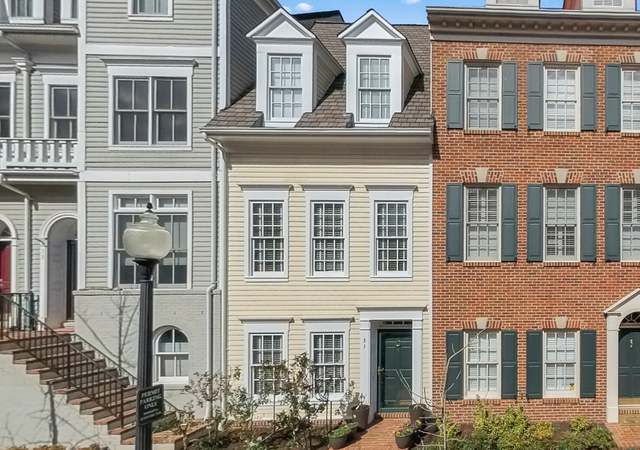
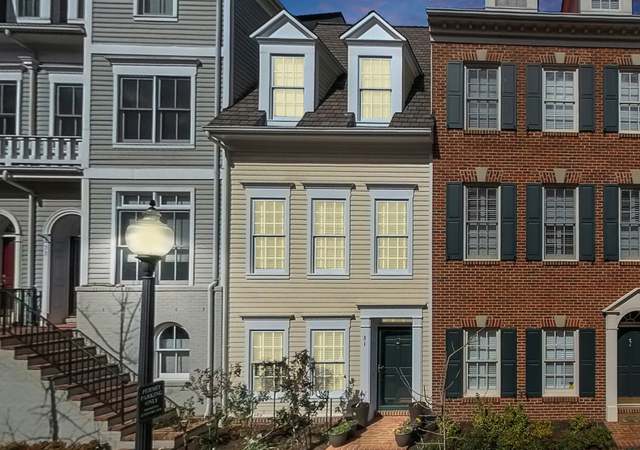
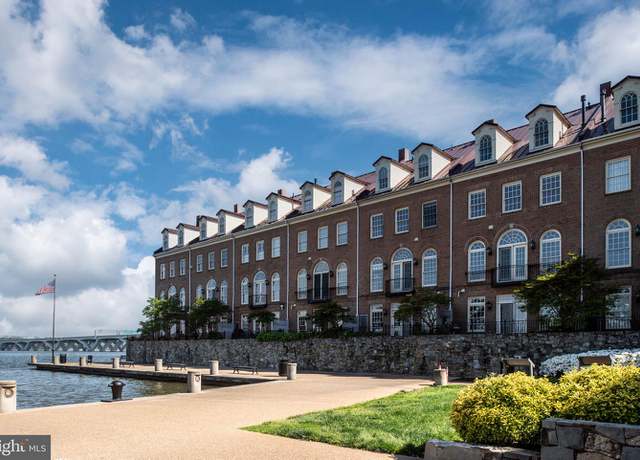
Beautiful townhome in Old Town Alexandria's sought-after waterfront community, Ford's Landing!! Amazing location: Your front door is only 100 yards from the Potomac River & only 20 yards from Old Town bike / walking trails! This spacious Lee model townhouse boasts rich details, a beautiful updated kitchen with stainless steel appliances, a serene deck off of the kitchen, and wonderful built-ins and customizations throughout! -1 car garage, with tandem parking. Only minutes from everything: Potomac River, walking / biking paths, historic Old Town Alexandria & Mt. Vernon, Washington DC, & all major roadways. This amazing home epitomizes luxury right in the heart of Old Town A
Beautiful top floor unit with sweeping unobstructed western sunset views as far as the eye can see! Unit is located on the only level requiring a specific top floor fob to access! Unit features beautiful kitchen with stainless appliances, gas stove, granite countertops, and wood cabinetry. Great open flow into family room with wood floors and large window showcasing elevated views. Perfect office alcove that comes equipped with desk and shelving unit. Bedroom features large walk in closet with custom "Elfa" built ins and direct access to updated bath featuring rarely found jacuzzi tub. In unit washer/dryer. Incredibly convenient location just across the street from Huntington Metr
COMING SOON in Hollin Hills –Expanded and Fully Remodeled by MM Design Co, this original Mid Century Modern (“MCM”) home, by renowned architect Charles Goodman, is in the highly sought-after neighborhood of Hollin Hills. A truly one-of-a-kind home for its next owner. Beautifully positioned on almost one-half acre, the property has multiple gorgeous outdoor entertaining spaces including a 335 sqft deck on one side and approx. 1500 sqft of patio space on the other side of the home. This 4 BR / 2.5 BA home lays out perfectly (SEE FLOORPLAN) giving the future owner stunning open concept living space with floor to ceiling glass on both sides, and 4 large bedrooms (rare for orig
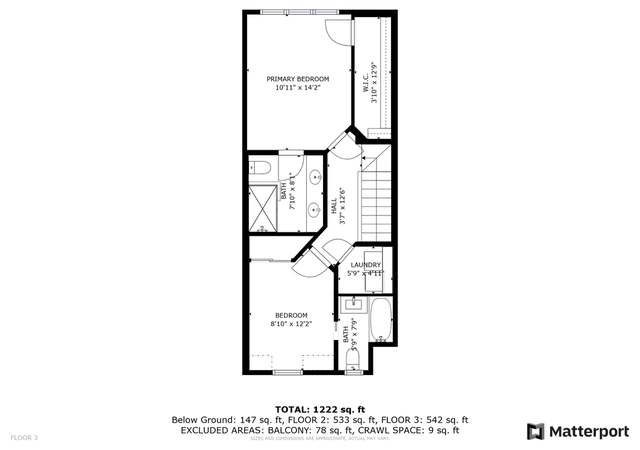
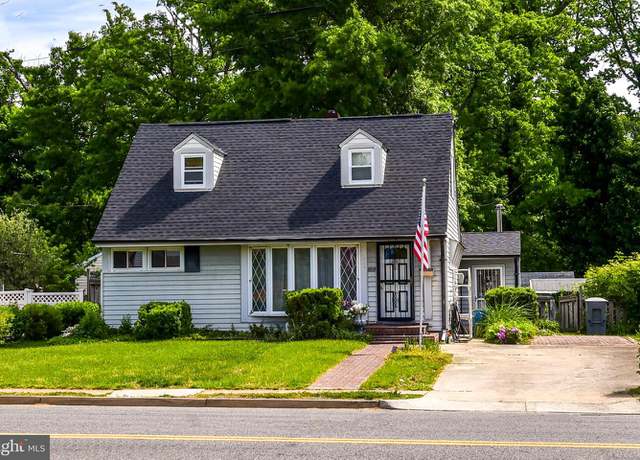
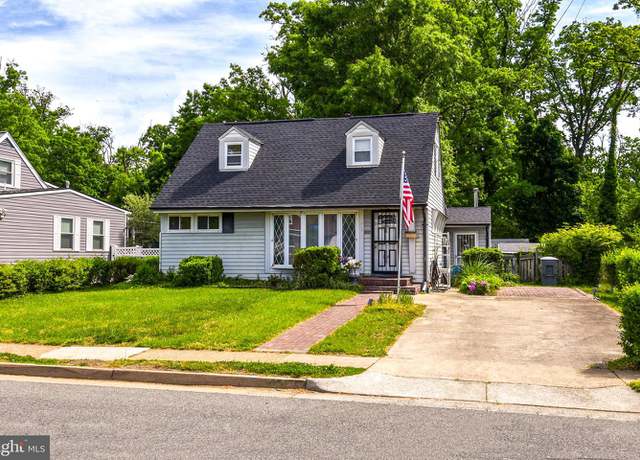
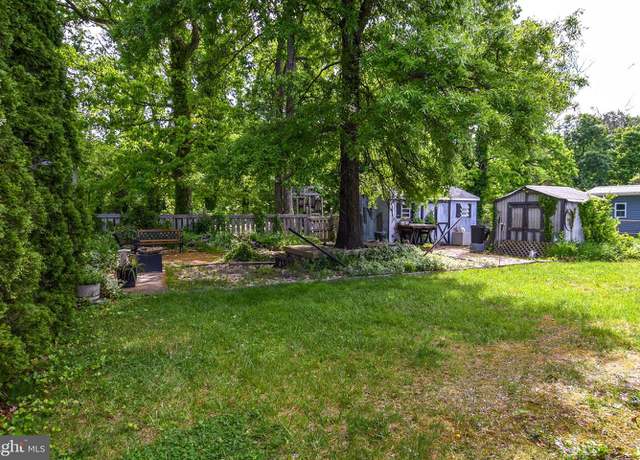
Welcome to this charming Cape Cod in a fantastic location! This delightful home offers two comfortable levels of living space, featuring 3 bedrooms and 1.5 baths. Upstairs, you'll find two bedrooms, a convenient half bath, and the laundry area with washer and dryer. The versatile lower level boasts a bedroom, a full bathroom, wood floorings and an open living and dining area. The galley kitchen provides efficient functionality, while the spacious entertainment room with terracotta tile flooring is perfect for gatherings. This inviting space features a cozy gas log stove and two exits: one leading to the brick driveway and another to the expansive fenced backyard with goldfish pond and matur
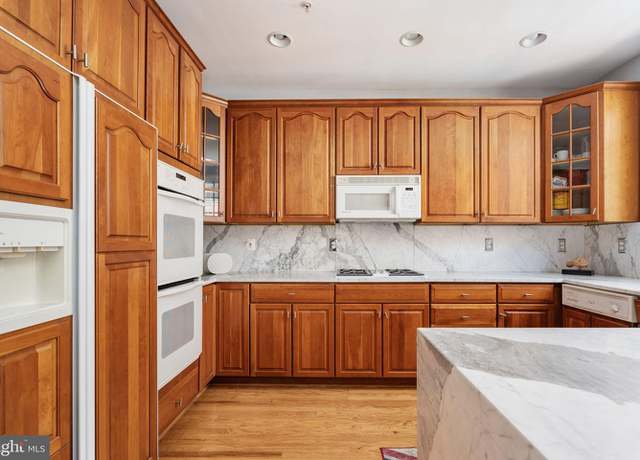
Welcome Home to This Beautiful Light Filled End Unit Townhome in Sought After Ford's Landing. Home Offers: Large Eat in Kitchen with Double Ovens, Stunning Marble Counters and Separate Formal Dining Area. Owners Retreat Offers Vaulted Ceilings and a Marble Tiled Bathroom with a Waterfall Shower and Jacuzzi Bathtub. Large Home Office with Built In Cabinets. All Bedrooms have their own Full Bath!! Tons of Surrounding Community Amenities. Bordered by the Potomac River and Parks on All Sides Offers an escape from the hustle and bustle of city. Within a short walking distance, You can easily reach King St. , a vibrant hub of activity. For the outdoor enthusiast there is the Mt. Vernon bik
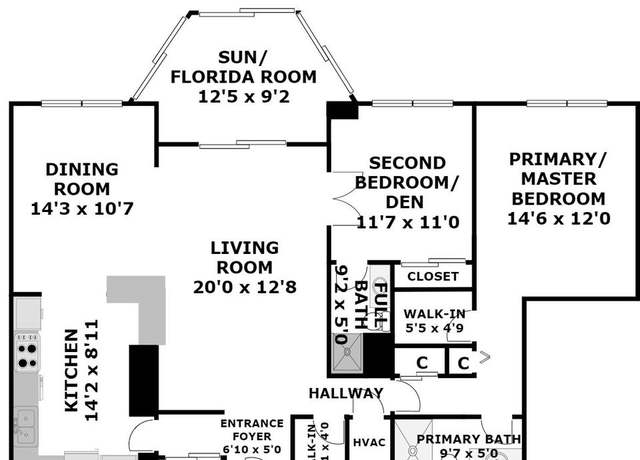
* * * * * JUST LISTED! - OPEN HOUSE SAT. 5/04 FROM 11:00 AM - 1:00 PM. * * * * * Welcome Home to 5901 Mount Eagle Drive, Unit #116 at Montebello, -- the area's premier "award-winning" luxury condominium! •2-BEDROOMS/2-FULL BATHS MONTEBELLO HOME w/ SUN/FLORIDA ROOM: One of only two, 2-bedrooms floor plans where each bedroom has its own full bath! Overlooks valley-like wooded setting. PLUS, autumn/winter views of the Alexandria City Skyline, w/ the nighttime views being especially spectacular! MOVE-IN READY: Including beautifully renovated kitchen and baths w/ open-kitchen concept w/ breakfast bar, hardwood floors, six-paneled doors, custom plantation shutters, fresh
Remarkable short sale opportunity with an exceedingly spacious, updated condo with desirable amenities and beautiful views! Ideally situated in the highly-desirable and amenity-rich gated community of Montebello, this 2-bedroom and 2-bathroom condo affords an exceptional and nearly effortless opportunity to create the home of your dreams. Beaming with soft natural light, the interior features stunning wood flooring, crown molding, an open layout, perfect for entertaining dining area, screened-in patio with water views, and a sizable living room. Fully-equipped and ready for your unique vision, the kitchen delights with ample wood cabinetry, beautiful countertops, glass cooktop, built-in wal
Introducing 2846 Red Star Lane Located in Towns at South Alex built by Craftmark Homes. A hidden gem of a neighborhood! This stunning END UNIT, 4-level townhome boasts a 2-car garage, 3 bedrooms, and 4.5 bathrooms. Enjoy luxurious living with a gourmet kitchen, quartz counters, extended island, wine/coffee bar and top-of-the-line Bosch appliances. Beautiful hardwood floors throughout the entire home!! Park your car in the garage and enter into the lower level where you will be greeted with 13 foot ceilings, a beautiful full bathroom (with access to extra storage and mechanicals) and the perfect rec room for relaxing! The 2nd level features the main living space with a beautiful high end ki
Welcoming with a large front garden and stone walkway, this brick with shingle accents Villamay home is located on a . 34-acre lot and offers 2,800 sqft of living area. The main entrance level provides a spacious living room with fireplace, a separate dining room opening to a screened-in porch, a sunlit kitchen overlooking the rear patio and garden, a primary bedroom with a full bathroom, and two additional bedrooms. The lower level has been recently renovated with new floors, French doors, gallery lighting, and a full bathroom to complete the refinished fourth bedroom suite. The French doors in the family room open up to a blue stone rear terrace and a beautifully landscaped garden. Locate
Open House: Sat May 4th 1-3 & Sunday May 5th 1-3. Charming, expanded Cape Cod with 4 BR's, 2 BA's, and an extra room for an Office/Study or Rec Room. It is located in the sought-after Bucknell Manor neighborhood, just south of Alexandria in the Mt Vernon Area ! Freshly painted, this home offers 2 original levels with a significant addition on the right side. The main level with hardwood floors has 2 bedrooms, a full bath (tub/shower), large living room, and laundry room in the back with 2 large pantries. The upstairs has 2 bedrooms with hardwood floors and full bath (shower). The right side has a 3 level addition with the study/office or Rec Room above; the kitchen & large d
Say hello to 6948 Westhampton Drive. We will be on the market on May 2nd! Wait until you see it after the professional landscapers and contractors do their magic. The homeowner has already done hers! There are so many upgrades we are excited to tell you about. In the past 5 years, the homeowner has put on a new roof, siding and installed new HVAC and furnace, hot water heater, windows, interior doors, ceiling fans, lighting, kitchen appliances, kitchen cabinets, flooring, countertops and dining room built-in's. There is an updated electrical box, insulation and attic fan. An electric car charging station has been installed. They have installed a french drain and sump pump. Now that you know
Welcome to 5847 Monticello Road in Jefferson Manor, a friendly and quiet neighborhood with a strong sense of community. This nicely designed 3-level duplex is just a short 5 min walk to the Huntington Metro (0.2 mile door to escalator)! While there are many homes in Jefferson Manor that are similar to this home, you’ll notice many special features of this home that others don’t offer: Closer location to Metro; just 0.2 mile to Huntington Metro (Yellow Line) . Close to Jefferson Manor Park, just 0.2 miles away and offers a large open green space, a softball/baseball diamond, a basketball court, a playground, and parking . This section of Monticello Road feels much less crowded
Experience the epitome of luxury and outdoor living at this exceptional one-bedroom condo in the prestigious Porto Vecchio. Boasting an unusually large terrace, this light-filled home has a spacious and airy floor plan, an updated kitchen, and a renovated bath. Warm wood floor throughout. Storage is plentiful with closets galore, separate storage unit and garage parking. Porto Vecchio doesn't just offer a home; it provides a lifestyle. Residents benefit from exclusive amenities, including complimentary private limo service, on-site management, and an elegant party room perfect for social gatherings. Recently renovated exercise rooms cater to all your fitness needs, while the 24-hour front d
A rarely available, first floor, two-story, townhouse-style 1 BR/1.5 BA unit with patio with street-level private entry + one garage parking space at Saint Asaph Square Condominiums can be yours! The main level features open-plan living and dining with built-in shelves, a wood-burning fireplace, kitchen, storage closet, and powder room. A French door flanked with floor to ceiling panel windows invites in natural light and opens to the brick, privacy-walled patio and garden. Resilient, luxury vinyl plank flooring (engineered hardwood underneath, if preferred) provides comfort and style underfoot. Additional secure storage space is conveniently located across the hall. The carpeted upper l
Walk to Huntington Metro Station from your delightful move-in ready cape cod in the Fair Haven community! This corner lot charmer sits on one of the best lots in the neighborhood and is drenched with curb appeal. A kitchen addition with vaulted ceilings makes this property a neighborhood standout. This 4-bedroom 2-bathroom property has fresh paint throughout and newly refinished hardwood floors. Enter the home from your covered front porch into your light and bright living room. To the right you will find a pair of bedrooms and a full bathroom. Through the living room you can access your separate formal dining room and eat-in kitchen. Look up! Vaulted ceilings in the kitchen create an open
* * * * * JUST LISTED! - OPEN HOUSE SAT. 5/04 FROM 2:00 - 4:00 PM. * * * * * Welcome Home to 5904 Mount Eagle Drive, Unit #605 at Montebello, -- the area's premier "award-winning" luxury condominium! * * * * * Premium Montebello location just steps to Montebello's New Community Center! * * * * * •2-BEDROOMS/2-FULL BATHS MONTEBELLO HOME: One of the most desired and sought-after floor plans noted for its especially generous room sizes and large walk-in closets. MOVE-IN-READY w/ numerous upgrades and improvements. Including beautifully renovated kitchen and updated baths, brand-new upgraded flooring, upgraded HVAC system, freshly painted and more! •EN
Welcome to Unit #506 located at 5904 Mount Eagle Drive in Alexandria, Virginia! Nestled in the sought-after Montebello condominiums, this lovely 2 bedroom, 2 bath condo delivers 1,195 square feet of living space plus a spectacular sunroom delivering panoramic views! An open floor plan, rich hardwood floors, built-in shelving, lighted ceiling fans, and an abundance of windows combine to bestow a light and airy ambience, while a warm and neutral color palette and updated kitchen and baths create instant appeal. Upscale lobby, community center, convenience store, bar/lounge, café, salon, state-of-the-art fitness center, billiards room, bowling alley, tennis courts, and common grounds.
THIS IS THE ONE YOU HAVE BEEN WAITING FOR! ONE OF THE NICEST ONE BEDROOM UNITS THAT YOU WILL FIND OFFERING THE BEST OF BOTH WORLDS WITH A LARGE PRIVATE TERRACE PERFECT FOR OUTDOOR RELAXATION AND ENTERTAINING AND TWO DEEDED PARKING SPOTS!! A RARE FIND! LOCATED ON THE 7TH FLOOR, YOU HAVE EASY ACCESS TO THE PARTY ROOM, FITNESS CENTER, OUTDOOR SWIMMING POOL, GRILLING AREA AND OUTDOOR SPACE. THIS HOME HAS BEEN IMMACULATELY MAINTAINED AND UPDATED WITH NEW LUXURY VINYL PLANK FLORING, MODERN NEUTRAL PAINT, NEW LIGHT FIXTURES INCLUDING DINING ROOM, KITCHEN PENDANT LIGHTS, BATHROOM LIGHT AND HALL LIGHT. THE BATHROOM FEAURES NEW MIRROR, NEW RECESSED MEDICINE CABINET, NEW SHOWER ROD, NEW SHOWER HE
Rarely available 2-bedroom, 2 full bath “E” model in the highly desirable community of Montebello overlooking Old Town Alexandria and minutes to Washington, D. C. The unit features breathtaking panoramic views of the Potomac River, DC Skyline and National Harbor. This home has been thoughtfully renovated top to bottom and offers an open living-dining room combo pre-wired for surround sound, fully equipped kitchen with stainless steel appliances, granite countertops and ceramic tile floors. Premium hardwood floors and crown moldings throughout add to the appeal. Enjoy relaxing mornings on the private, year-round terrace or watch the national 4th of July firework displays with fri
This area's enrollment policy is not based solely on geography. Please check the school district website for more information.
Elementary schools
Middle schools
High schools
GreatSchools Summary Rating
3/10
Mount Eagle Elementary School
Public, PreK-6
3/10
Belle View Elementary School
Public, PreK-6
3/10
Bucknell Elementary School
Public, PreK-6
-/10
Alc At Bryant
Public, N/A
-/10
Achievement Integrity And Maturity
Public, N/A
Only showing 5 of
7 elementary schools.
School data is provided by GreatSchools, a nonprofit organization. Redfin recommends buyers and renters use GreatSchools information and ratings as a first step, and conduct their own investigation to determine their desired schools or school districts, including by contacting and visiting the schools themselves.Redfin does not endorse or guarantee this information. School service boundaries are intended to be used as a reference only; they may change and are not guaranteed to be accurate. To verify school enrollment eligibility, contact the school district directly.
Homes for sale in Belle Haven have a median listing price of $335K. Some of these homes are Hot Homes, meaning they're likely to sell quickly.
What are some of the most popular neighborhoods in Belle Haven?
Popular neighborhoods include Penn Daw, Hollin Hills, Belle View Condominiums, Hollindale, Old Town, New Alexandria, Villamay, Downtown Alexandria, Southwest Quadrant, and Fair Haven.
Belle Haven, Virginia boasts a well-connected transportation network, making it easy to navigate by car. The region experiences moderate traffic levels, ensuring a smooth driving experience for residents. Although Belle Haven does not have its own public transportation system, it is well-served by nearby towns and cities that do. Furthermore, the proximity of major highways and freeways makes Belle Haven easily accessible for residents and visitors alike.
What types of properties are available in Belle Haven?
Belle Haven, Virginia offers a variety of single-family home types, including ranch-style homes, colonial-style homes, and contemporary-style homes, among others. These homes can be found throughout the neighborhood, with many properties featuring three to five bedrooms and built in various years. To explore different property types for sale in Belle Haven, Virginia, use the 'Home type' filter located above the active listings. Customize your search by selecting options like single-family homes, condos, townhomes, and more.
What is life like in Belle Haven?
Belle Haven, Virginia offers a serene and picturesque living experience, surrounded by natural beauty. The landscape boasts lush greenery, with a mix of rolling hills and tranquil waterways. The weather is characterized by mild winters and warm summers, creating an enjoyable outdoor environment. The area presents a range of job opportunities across various industries, fostering professional growth. Residents can engage in a variety of recreational activities, such as exploring local parks, participating in community events, and enjoying the vibrant culinary scene.
What are the schools and amenities like in Belle Haven?
Belle Haven, Virginia offers a variety of public amenities to enhance your living experience. For dining options, the town boasts a restaurant that caters to a wide range of culinary preferences. Outdoor enthusiasts will appreciate the well-maintained park, perfect for leisurely strolls or picnics. For your daily shopping needs, a grocery store is conveniently located within the town limits. Additionally, other amenities such as a library and post office are also available for residents' use.
In the past month, 12 homes have been sold in Belle Haven. In addition to houses in Belle Haven, there were also 15 condos, 1 townhouse, and 0 multi-family units for sale in Belle Haven last month. Find your dream home in Belle Haven using the tools above. Use filters to narrow your search by price, square feet, beds, and baths to find homes that fit your criteria. Our top-rated real estate agents in Belle Haven are local experts and are ready to answer your questions about properties, neighborhoods, schools, and the newest listings for sale in Belle Haven. Our Belle Haven real estate stats and trends will give you more information about home buying and selling trends in Belle Haven. If you're looking to sell your home in the Belle Haven area, our listing agents can help you get the best price. Redfin is redefining real estate and the home buying process in Belle Haven with industry-leading technology, full-service agents, and lower fees that provide a better value for Redfin buyers and sellers.


 REDFIN IS COMMITTED TO AND ABIDES BY THE FAIR HOUSING ACT AND EQUAL OPPORTUNITY ACT. READ REDFIN'S FAIR HOUSING POLICY AND THE NEW YORK STATE FAIR HOUSING NOTICE.
 United States
 Canada