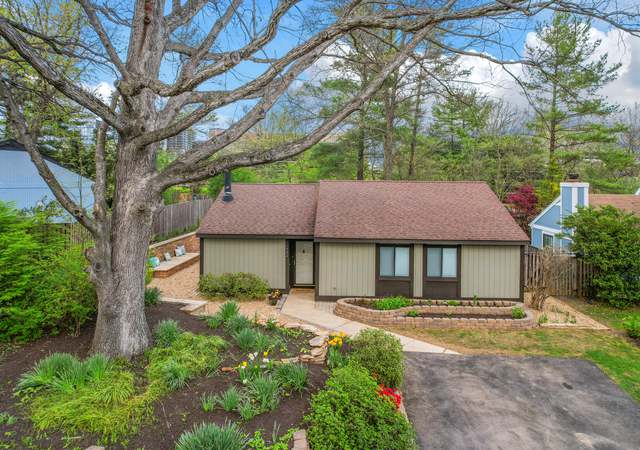
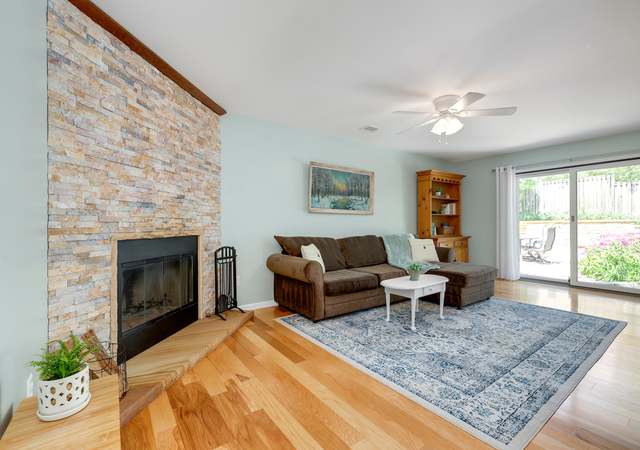
Beautiful oasis in the heart of Reston! This 3-bedroom, 2 full bathroom, single-family home is just steps from the metro, pool, lake, and tennis courts, and is ready for you to call home. Main level living at its best, this home is located on a quiet, wooded cul-de-sac and features a private yard. Open floor plan with hardwood flooring throughout. Updated eat-in kitchen with Quartz counter tops, subway tile backsplash, stainless steel appliances, recessed lighting, bar seating, and great cabinet space for storage. Family room showcases a beautiful stone wood-burning fireplace and hearth. Spacious primary suite has a walk-in closet and updated bathroom, with a walk-in spa shower and laundry
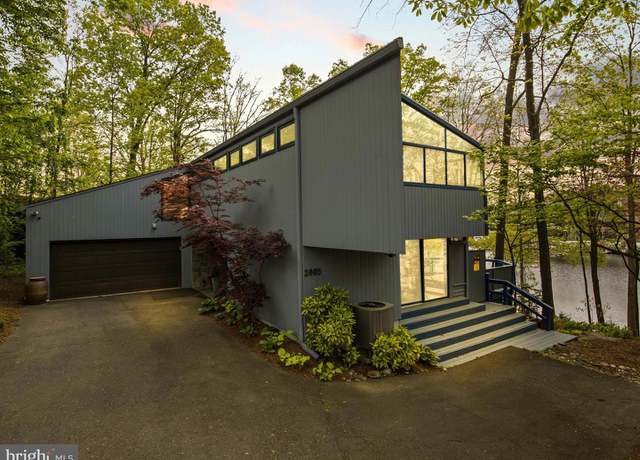
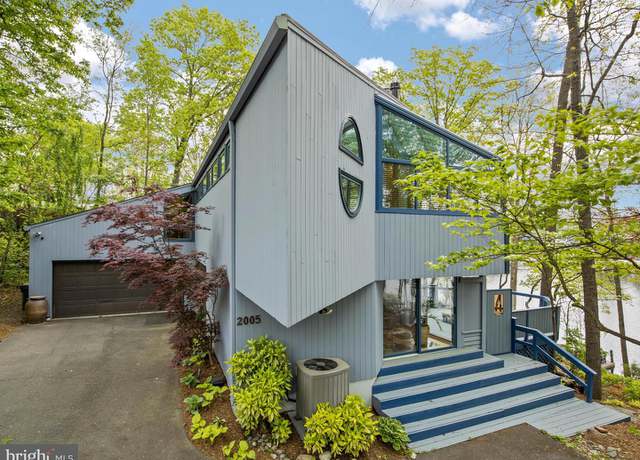
Welcome to Luxury Lake Living in Reston! This beautiful contemporary house is one of a kind. With nearly 5000 SF on 1/3 of an acre, you will be amazed by it inside and out. With 180 degrees of water views and water frontage, this home offers a lifestyle that is rare to find in the DC Metro area. This home once featured on Reston's Home tour features 4 bedrooms and 3 full bathrooms including main level living. The customizations to this home are unparalleled. The house features hardwood floor, gourmet kitchen, viking appliances, a plethora amount of windows, a wine cellar, custom walk in closets, a home theatre like layout in the basement, spa like bathrooms with large soaking tub in the pr
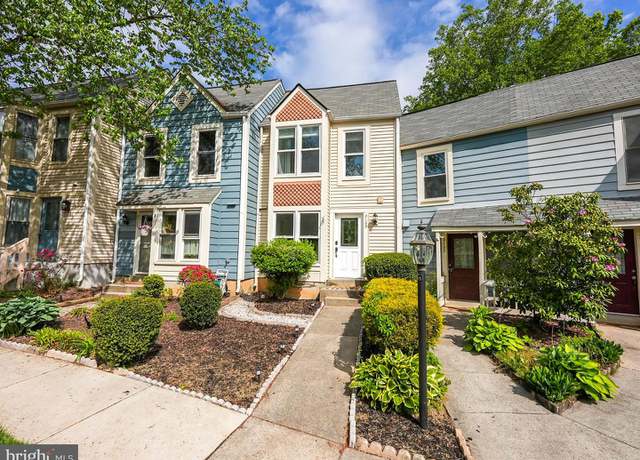
Ready for showings on May 1. You will fall in love with this home and the community. Charming townhome with beautiful updates. The current owners have remodeled the full bath and replaced the windows and doors. The neighborhood is close to shopping and dining at South Lakes Shopping Center. Very close to schools with easy access to the Dulles Toll Road. Access to all Reston Amenities. Paths and pool nearby. Your cluster fee covers trash, recycling, common area maintenance and snow removal.
Welcome to 1560 Woodcrest Dr. Conveniently located in the heart of Reston this fantastic home features 2 spacious bedrooms, 2 full bathrooms and one half bath. On the main level the kitchen boasts granite countertops and stainless steel appliances. Just off of the kitchen is the dining area and livingroom area which are floored in hardwood. Through the sliding door to the deck you'll enjoy the view and privacy of mature trees and the sounds of nature. The downstairs lower level features a full bathroom, LVP flooring and an unfinished storage area. Notable updates include 2018- New water heater, 2019- New HVAC (Carrier Heat Pump), LVP in basement, 2021 - New windows and entry door (Anderson
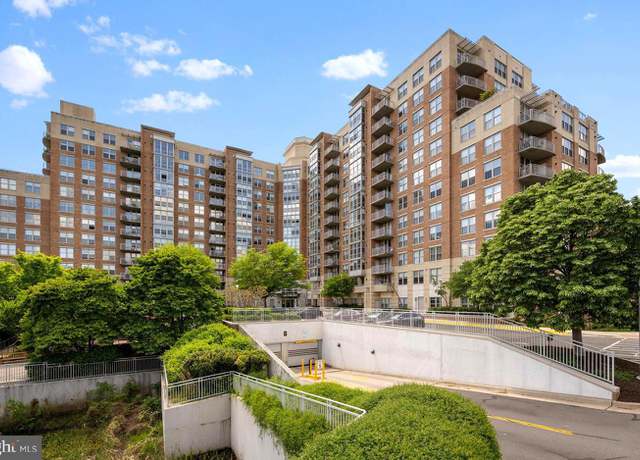
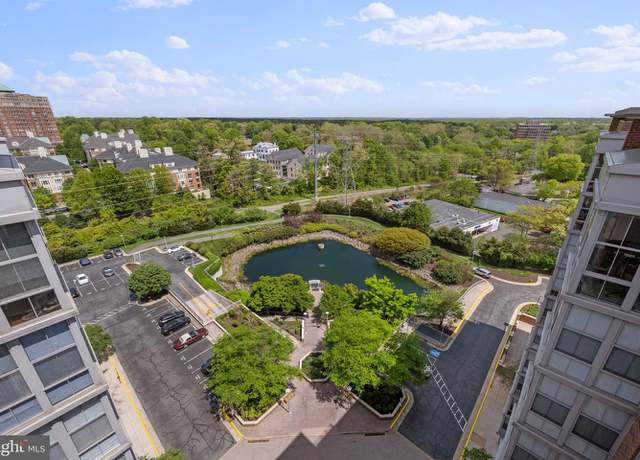
Welcome to this meticulously maintained 1 bedroom 1 full bath condo nestled within the coveted Carlton House in the heart of Reston. This unit boasts abundant natural light streaming through floor-to-ceiling windows that lead to the private balcony, and it shows brand-new with fresh paint throughout, new carpet in the bedroom, and immaculately maintained hardwood floors. The kitchen offers beautifully polished stainless steel appliances, granite countertops, Cherry wood cabinets, and ceramic tile flooring. The spacious bedroom features two walk-in closets, and an en-suite full bathroom with ceramic tile, granite counters, and an in-unit washer and dryer. Additional features include one assi
Nestled in a serene, tree-lined enclave, this exquisite 3-bedroom, 2.5-bath townhome offers an unparalleled blend of comfort and sophistication across three beautifully appointed levels. The stucco exterior and thoughtful landscaping invite you into a sunken family room, where a wood-burning fireplace creates a warm, inviting atmosphere. The kitchen, designed for both function and fellowship, seamlessly transitions into a dramatic two-story formal dining room, offering sweeping views of the lower level. A cozy office nook on the main floor provides a perfect spot for productivity. Upstairs, three generously sized bedrooms promise restful retreats, with the primary suite boasting a luxurious
Welcome to Woodwinds Condos. This stunning 1170 square foot, updated, contemporary unit has 2 bedrooms and 2 full baths. A beautifully maintained home with an open floor plan of kitchen, living and dining/office space features hardwood flooring throughout the unit. Soaring, vaulted ceilings and floor to ceiling windows flood the entire living area with natural light and the sliding glass door opens to a spacious covered balcony, overlooking trees and a neighborhood walking path. In the kitchen you will find stainless steel appliances, a gorgeous tile backsplash, granite countertops and plenty of cabinets for storage. The kitchen island provides the convenience of additional seating, storag
This 5 bedroom beautifully updated home sited on a . 43 acre lot in the desirable Deer Forest Neighborhood in North Reston is move-in ready! This picturesque property features an updated kitchen, updated bathrooms, fresh paint throughout, new door hardware, new shutters on front of home, stone walk. The fully finished walkout lower level offers a spacious recreation room and a second kitchen. Enjoy this large private lot with a fabulous new deck that backs up to wooded parkland. Conveniently located just minutes from North Point Village and major commuting roads.
* * * Open House Sunday May 5th, 12-2 pm * * * Check out this lovely updated 5-bed, 3.5-bath colonial nestled amongst lush woodlands. Beautiful hardwood floors, fresh paint, and brand-new carpeting invite you into a spacious haven. Entertain effortlessly in the gourmet kitchen, or unwind by the cozy family room fireplace. Host dinners in the elegant dining room, or step onto the deck for private summer BBQs amid towering trees. Find tranquility in the main-level home office, and retire to the extended primary suite with a balcony and ensuite washer & dryer. Discover added comfort in the bonus basement in-law suite and fully finished recreation room that walks out to the yard. Wi
* MUST SEE * FIRST FLOOR CONDO UNIT AT SOUTHGATE IN RESTON * MOVE-IN READY * * This condo of almost All are renewed in April, 2024! 2 bedrooms and 1 bathroom * ALL NEW PAINT, NEW CARPETS, newly renovated kitchen with new appliances * NEW cabinets, granite countertops, sink, and faucet * New washer and dryer, New refrigerator, New microwave oven. * PRIMARY BEDROOM SUITE with large walk-in closet * SECONDARY BEDROOM with closet * Closer to many amazing community amenities: GORGEOUS GULF COARSE with picnic area; RESTON COMMUNITY CENTER with party room, fitness and Olympic size swimming pool, hot spa; Brand-New Wegmans that is in a walk-in distance, few minutes away from Reston To
Please schedule online AND GO. Please park in the parking spot# 083 in front of the building entrance or in any unassigned parking spots (those without numbers). The code to access the building is #2321 ; the lockbox is on the condo door. Welcome to your new home in Reston Villas!! Beautiful, 2-bedroom, 2-bathroom condo located in Reston's North Point This lovely Condo property offers FRESH PAINT and a cozy and relax in the comfortable living area, Open floor plan, complete with ample natural light. Pet-friendly community Outdoor recreation areas nearby Community pool and fitness center Private balcony, assigned parking space and plenty of guest parking. Short distance to shopping and dinin
This updated 2-bedroom, 1.5-bath condo is nestled in the amenity-rich Chestnut Grove community. It has received numerous updates over the years, including a new carpet, fresh paint, a new dishwasher, washer, and dryer. The condo comes with two parking spaces: one assigned and one unassigned, plus an additional visitor's pass for guests. The spacious living room features a separate formal dining area and a private balcony. Additionally, there is a separate breakfast morning room that can be used as an office. All rooms are enhanced by floor-to-ceiling windows. Storage options include a separate downstairs storage space and a large hall closet. The community's amenities include a pool, playgr
INVESTORS! Great opportunity awaits in the Pavilion of Reston Town Center, bring your contractor and your vision! The property needs some updating and repairs, but the idealistic neighborhood makes it truly desirable. The home features 4 bedrooms and 3.5 bathrooms, nested in a quiet cul-de-sac, and is selling as-is. A potential 5th bedroom in the basement with an existing full bathroom is perfect for a guest suite! The sought after neighborhood enjoys a community pool, tennis courts, playground and is close to shopping, restaurants and Reston Metro Station.
This classic Reston home is close to 1/2 acre, in a beautiful garden setting! The property gives a sense of calm and wellbeing with an abundance of beautiful elements and natural light. A major renovation resulted in many lovely changes including warm oak floors on main and upper level. The totally custom Kitchen has creamy white cabinetry, granite counters, high end SS appliances plus stunning built-in china cabinet and "coffee altar". A wet bar adjoining the spacious Living Room is perfect for entertaining. Curl up with a book in the updated SunRoom with ceiling fans, granite floor and a wall of doors to the patio outside. The Primary Suite is a restful retreat. Enjoy the enl
Welcome to serene lake living at 2053 Swans Neck Way, nestled in the heart of Reston, Virginia. This meticulously maintained 3-bedroom, 3.5-bathroom townhouse offers the perfect blend of modern comfort and natural beauty, complete with two assigned parking spaces for your convenience. The canoe conveys as residents of the Walden Cluster are provided with lake access and storage for kayaks, canoes, paddle boards, and non-gas-powered boats. As you step inside, you'll be greeted by a bright and inviting main level featuring a coat closet, powder room, well-appointed kitchen, dining room, and a spacious living room. The living room boasts a beautiful three-panel sliding glass door leading to a
With NO stairs, this charming 2-bedroom, 2-bathroom, ground-level condo in popular Sutton Ridge has everything you need. It has an attached private garage that allows you to enter directly into your condo and walk through your mud-room with full size side-by-side washer and dryer! The open living room and dining area are perfect for gatherings and has a French door that takes you out to your own private, covered deck. The primary bedroom has a large walk-in closet and ensuite bathroom with double sink vanity and walk-in tile shower. The garage has extra Storage Space. HVAC was replaced in 2016. The location is unbeatable; located in the North Hills Park complex-- which features recently re
Up to the minute Style and Pizzazz in this Uber-Updated Grand Monet from Renaissance. Boasting about 11,000 square feet of breathtaking space, Luxury abounds, thanks to impeccably tailored stylistic choices. .. . Nestled on a 1.73 acre Cul de Sac lot and backing to extensive wooded acreage with a peaceful meandering creek, this elegant property beckons you to live life on a higher plain. Absolutely no detail has been forgotten by these meticulous owners, who have updated every detail. Magnificent renovations on every level of both indoor and outdoor space. The 2-story foyer ushers you in, with an unobstructed view of the wooded privacy beyond. From that breathtaking entrance to the extensi
Welcome to this charming two-car garage updated townhouse at 1284 Wedgewood Manor Way in desirable North Reston. As you step inside, you'll be greeted by a spacious foyer with a coat closet and powder room. To the right is a beautifully renovated kitchen with 42 in. cabinets, granite countertops, newer stainless steel appliances, ceramic floors, and an inviting breakfast room with recessed lighting. The main-level living room, dining room, and office feature beautiful hardwood floors. Work from home in the spacious main-level office with a wall of windows. The 2-story living room has a cozy fireplace, skylights, and sliding glass doors to the rear landscaped yard with a gorgeous paver patio
Discover the perfect blend of tranquility, modern convenience and vibrant community life in this beautiful townhome. Your serene retreat from the bustling tech corridor is surrounded by lush greenery and picturesque walking trails and golf course. From the spacious deck with breathtaking views, ideal for hosting, to the beautifully updated interiors, every detail enhances your living experience. Seize your opportunity to live, work, relax and play in style surrounded by year-round events like summer concerts, holiday parades and farmers markets--all within close proximity to Reston Town Center and two metro stations! Seller is moving onto the next adventure and has priced the home fairly f
Situated on the lovely 43 acre Lake Thoreau in Reston, this beautiful all brick, spacious, end-unit townhome is approximately 2,300 square feet on three levels, featuring 3 large bedrooms and 2 ½ baths. The lower level is plumbed for a full size bathroom. The main level boasts a roomy, light & bright living room and a nice size dining room. The sliding door just off the kitchen opens to a large deck with low-maintenance composite flooring that overlooks a wooded area…perfect for summer entertaining! Enjoy the peaceful serenity of living in the sought after Walden Cluster lake front community. Amenities include a private community dock with kayak and canoe storage, that
Welcome to this quintessential North Reston townhome, full of charm and character! With three levels of living, three bedrooms, a fenced front patio for al fresco dining, the fully fenced rear yard and balconies off two bedrooms, this home is sure to please! The main level features an open living/dining room concept with wood burning fireplace, two doors to the backyard and the kitchen with a door to the front patio. Upstairs, the primary ensuite features an updated bathroom, deck and two closets. Also, upstairs are two additional bedrooms (one with a deck) and a renovated full bath. On the lower level, you’ll find a den, updated bathroom, laundry room and an additional recreational s
Introducing a masterpiece of elegance and craftsmanship, this exquisite residence embodies luxury living at its finest. Nestled on a sprawling 2.66-acre lot in a prime location, this meticulously designed home offers a sanctuary of sophistication and style. Boasting a well-built structure and impeccable attention to detail, every corner of this property exudes quality and charm. From the moment you arrive via the grand circular driveway, you are greeted by the grandeur of this exceptional estate. The expansive lot size of 2.66 acres provides ample space for outdoor enjoyment and endless possibilities for landscaping and recreation. Whether you seek tranquility in the beautifully landscaped
Fairfax Hunt Estates: highly exclusive luxury community in the heart of Fairfax County, crafted by award-winning builder, Kingston Royce Homes. Fairfax Hunt Estates will represent luxury living at its finest in Reston, Virginia. Comprised of just 8 custom-built homes in a cul-de-sac neighborhood, Fairfax Hunt Estates will offer private, wooded vistas of Lake Fairfax and access to an abundance of outdoor amenities (if they want, we can include some of the amenities here). Located minutes from Mclean, Great Falls, Vienna, and Tysons Corner, residents of Fairfax Hunt Estates can enjoy world-class shopping, dining, and entertainment options. Close proximity to Dulles Toll Road provides easy acc
No stone has been unturned with this home, its a showstopper and will please all from empty nesters to families alike. Newer features adorn the exterior with new windows, roof, siding, garage doors, and over $80,000 in rear patio, landscaping, and irrigation. Inside you're greeted by a welcoming foyer, and gleaming hardwoods throughout the main floor. The large dining room with chair rail give a formal dining option while the eat in kitchen flows seamlessly from the patio across the open concept kitchen with breakfast bar into the family room with cozy fireplace. Sliding doors tie the kitchen to the NEW techno-block patio with built in gas grill and refrigerator, and another set of large sl
Just Listed! One of only 8 Conrad model ELEVATOR residences at The Townhomes at Reston Station! This 4-level townhome, completed in late 2022, offers top of the line finishes and features and has been loaded with upgrades. The gourmet kitchen features quartz countertops including a waterfall edge at the island, Bosch & Thermador appliance package, and upgraded shaker cabinets with soft-closing doors and drawers. The elevator reaches all four levels of the home including the enormous private roof terrace, which offers ample space for outdoor living and separate dining, a remote-control retractable awning, and a gas line for grilling or fire feature. The 2-car garage offers extra stor
Situated in a prime location, this beautiful 2-bedroom 2-bath condo has it all! The bright and open living room/dining room combo provides ample space for gathering and entertainment. The spacious kitchen is equipped with stainless steel appliances that were all renewed in 2018. Master bedroom and second bedroom both comprise of large walking closets with plenty of storage. Step into the private balcony surrounded by trees for your morning coffee or afternoon drinks. Luxury vinyl flooring throughout the unit was placed in 2020. Additional updates include a new AC unit in 2021 and new water heater in 2017. Enjoy all the amenities Reston has to offer including parks, lakes, swimming pools, vo
This fantastic 4 bedroom, 2.5 bathroom home, located in Reston but free from Reston Association fees, offers a perfect blend of charm and modern amenities. Nestled on a quiet cul-de-sac, this property boasts a beautiful exterior complemented by a backyard patio shaded by a pergola and wisteria. Upon entering the home, the warmth of the gleaming hardwood floors welcomes you, extending throughout the main level and seamlessly integrating the living spaces. The heart of the home is the bright ultra modern gourmet kitchen with Thermador & Miele appliances, that opens up to a spacious family room highlighted by vaulted ceilings and a cozy gas fireplace. Ideal for entertaining or relaxing,
TRULY UNIQUE CONDO WITH 20 FT CEILINGS, LOFT & 2 GARAGE PARKING SPOTS IN RESTON TOWN CENTER. There are only two Penthouse Condos with this stunning design located in the center of Market Street. Stretch out with Palladian windows that soar 90 degrees from the Juliet doors all the way to the 20 foot ceiling. This condo was totally remodeled in 2018 and EVERYTHING IS NEW! It features a Gourmet Kitchen with upgraded appliances and high end fixtures, granite counters and tile floors. The Dining and Living areas are warmed by streaming light and a cozy Gas Fireplace with Matching Granite Surround. A large Master Suite has His and Her Closets, and a Dual Entry Master Bath with upgraded gran
This 7,000+ square-foot home on a wooded, one-acre lot offers unparalleled space and privacy, with high ceilings, hardwood floors, and wide sky, forest views in nearly every room. The home's 9 bedrooms, 6 bathrooms, 4-car garage, 3 fireplaces, and 2 full kitchens provide a variety of options, with an optional separate living area offering a private entrance, garage, kitchen, washer and dryer, and utility metering.
Beautiful Condo in Reston! Searching for a ready-to-move-in condo in a prime location? Look no further! This ground-level condo boasts two spacious bedrooms and two full bathrooms, making it an ideal starter home. The primary bedroom offers ample space with a walk-in closet and a private en suite bathroom. The second bedroom is generously sized with a spacious closet. Enjoy the comfort of brand-new carpeting in both bedrooms and the living room. The kitchen has been recently updated and features plenty of cabinetry, elegant white countertops, and new appliances. Additional highlights of this unit include in-unit laundry with a washer and dryer purchased in 2022, as well as an assigned stora
* LOCATION LOCATION * THIRD FLOOR CONDO UNIT AT EDGEWATER AT RESTON TOWN CENTER * LIGHT AND BRIGHT WITH VAULTED CEILINGS * 2 bedrooms and 2 bathrooms * 1224 square feet * ENTRY with tiled floor and coat closet * KITCHEN with stainless steel appliances, pantry and gas-cooking * NEW granite counters, sink and faucet * LAUNDRY ROOM with tiled floor, stacked washer and dryer and wire shelves * LIVING ROOM with gas fireplace and mantel, LED recessed lights and access to large balcony with NEW deck boards, utility closet and separate storage room * DINING ROOM with LED recessed Lights * PRIMARY BEDROOM SUITE with ceiling fan, linen closet and large walk-in closet * PRIMA
* LOCATION LOCATION * BEAUTIFUL THIRD FLOOR CONDO UNIT WITH GARAGE PARKING * This well maintained 2 bedroom and 2 bath unit is freshly painted throughout * Luxury LVP flooring throughout ( 2021) * ENTRY with coat closet * LAUNDRY with washer and dryer (NEW Dryer 2023) * KITCHEN with granite counters and conversation-bar * Stainless steel appliances (NEW microwave 2022, NEW refrigerator 2023) * LIVING AND DINING ROOM with halogen track lights * Crown molding * Living room access to large balcony * Bedroom suits with walk-in closet, linen closet and ensuite bath with sink vanity, granite counters and Tub/Shower * NEW AC unit 2022 * NEW garbage disposal 2022 * Gar
Welcome Home to The Mercer at Reston where convenience and luxury meet! This condo has been loved by original owner and includes Quartz kitchen countertops (2024), tiled flooring in kitchen (2017), all new appliances, (November 2022), under cabinet lighting, gorgeous updates to primary bathroom that include large standing shower with frameless shower door. The second suite includes a large garden tub and quartz countertop. Bedroom suites include large walk-in closets. Other recent updates include new carpet in both bedrooms with upgraded 7/16 Tempur -Pedic Material/Padding (2020) and a new hot water heater (2017) Full size washer/dryer. Located in the smaller building on the top level (4th
Lovely LUXURY condo. Newly upgraded bathroom with standing shower. New cabinets. Freshly painted and newly hardwood floor in living room. New light fixtures throughout the house. New fan with lights, new microwave and new blinds. 2 year old stackable washer/ dryer. Water heater replaced 4 years ago. Stainless steel appliances. Dual-entry Master Bath. Walk-in closet. Secure gated community w/ on-site management. 2 community pools, hot tub, fitness center, club house, BBQ and picnic area. Walking distance to Herndon metro station! 10 mins to the international airport! 3 miles to Reston Town Center. Walk to Harris Teeter, shopping, dining and more! Lots of amenities including concierge service
WHAT A LOCATION!! FRESHLY PAINTED THROUGHOUT! One bedroom condo in the heart of Reston. Wood burning fireplace in living room, granite counter tops, stainless appliances, NEW REFRIGERATOR with icemaker. Eat in area. DECK overlooks trees! NEW full size washer and dryer in unit. Extra storage in laundry room. Walk in closet in bedroom. NEW HVAC (2023) Condo fee includes water and sewer, onsite fitness center, swimming pool and carwash stations. Easy access to WO & D path and Lake Ann trail. Convenient to Silver Line metro stop, Reston Town Center, shopping, restaurants and grocery stores. Reston offers 15 pools, miles of trails, parks, lakes, tennis courts, pickle ball courts and many e
Additional professional pictures and video posted this weekend! Welcome home to this beautifully updated home in sought-after North Reston, on one of the prettiest and quietest cul-de-sac streets! Finally, an exterior with a wide wrap porch for enjoying an evening cocktail or weekend morning coffee as you recount the week’s happenings. So many contemporary and modern updates found inside and outside that include more than the typical cosmetic updates. This house will certainly surprise and please even the most discerning tastes. Nine-inch wide-plank hardwood flooring (not vinyl plank) greets you as you enter this tastefully updated home with new contemporary molding and trim; all n
Welcome to 1400 Northgate Square, #22B! Fresh paint throughout. New carpet and vinyl flooring throughout. Perfect for first time home buyer or investor! Condo fees include all utilities other than cable and internet.
School data is provided by GreatSchools, a nonprofit organization. Redfin recommends buyers and renters use GreatSchools information and ratings as a first step, and conduct their own investigation to determine their desired schools or school districts, including by contacting and visiting the schools themselves.Redfin does not endorse or guarantee this information. School service boundaries are intended to be used as a reference only; they may change and are not guaranteed to be accurate. To verify school enrollment eligibility, contact the school district directly.
Homes for sale in Reston have a median listing price of $565K. Some of these homes are Hot Homes, meaning they're likely to sell quickly.
What are some of the most popular neighborhoods in Reston?
Popular neighborhoods include Sunset Hills, Upper Potomac, Cooktown, Reston Town Center, Bull Run, Pinecrest, Hattontown, and Herndon Heights.
How often does Redfin update their new listings?
Most of our new listings in Reston are updated every 5 minutes so you can see new homes as soon as they come on the market. Learn more
What is transportation like in Reston?
Reston, Virginia is well-equipped with a variety of transportation options, making commuting and traveling convenient for residents. The area experiences moderate levels of traffic, especially during peak hours, making car travel a bit slower. Public transportation is readily available, with the Washington Metropolitan Area Transit Authority providing bus and Metrorail services. Additionally, Reston is conveniently located near major highways, including the Dulles Toll Road and Fairfax County Parkway, providing easy access to surrounding areas. Learn more on our Reston city guide.
What types of properties are available in Reston?
Reston, Virginia offers a variety of single-family home types, including ranch-style, split-level, and contemporary homes, among others. These homes can be found throughout Reston, Virginia, in neighborhoods such as North Point, South Lakes, and Lake Anne. Most properties in Reston, Virginia feature three to five bedrooms and were built between the 1960s and 1990s. To explore different property types for sale in Reston, Virginia, use the 'Home type' filter located above the active listings. Customize your search by selecting options like single-family homes, condos, townhomes, and more.
What is life like in Reston?
Reston, Virginia offers a unique living experience with its diverse range of amenities and services. The landscape is characterized by a harmonious blend of urban and natural elements, providing residents with a tranquil environment. The weather in Reston is mild, with four distinct seasons that allow for a variety of outdoor activities throughout the year. The job market in Reston is thriving, with numerous opportunities in various industries such as technology, healthcare, and finance. Residents can enjoy a wide array of recreational activities, including exploring parks, engaging in sports, and participating in cultural events.
What are the schools and amenities like in Reston?
Reston, Virginia is a community rich in public amenities for its residents. The town boasts a plethora of restaurants offering a wide range of cuisines to satisfy diverse culinary tastes. Numerous parks provide ample space for relaxation, recreation, and enjoyment of nature's beauty. Grocery stores are conveniently located throughout the area, ensuring easy access to daily necessities. Additional amenities include a community center, library, and fitness facilities, all designed to enhance the quality of life for those who call Reston home.
In the past month, 78 homes have been sold in Reston. In addition to houses in Reston, there were also 70 condos, 58 townhouses, and 1 multi-family unit for sale in Reston last month. Reston is a minimally walkable city in Virginia with a Walk Score of 40. Reston is home to approximately 58,512 people and 68,461 jobs. Find your dream home in Reston using the tools above. Use filters to narrow your search by price, square feet, beds, and baths to find homes that fit your criteria. Our top-rated real estate agents in Reston are local experts and are ready to answer your questions about properties, neighborhoods, schools, and the newest listings for sale in Reston. Our Reston real estate stats and trends will give you more information about home buying and selling trends in Reston. If you're looking to sell your home in the Reston area, our listing agents can help you get the best price. Redfin is redefining real estate and the home buying process in Reston with industry-leading technology, full-service agents, and lower fees that provide a better value for Redfin buyers and sellers.


 REDFIN IS COMMITTED TO AND ABIDES BY THE FAIR HOUSING ACT AND EQUAL OPPORTUNITY ACT. READ REDFIN'S FAIR HOUSING POLICY AND THE NEW YORK STATE FAIR HOUSING NOTICE.
 United States
 Canada