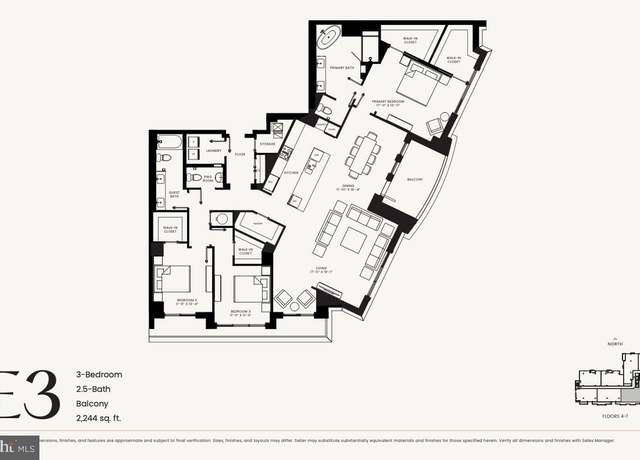
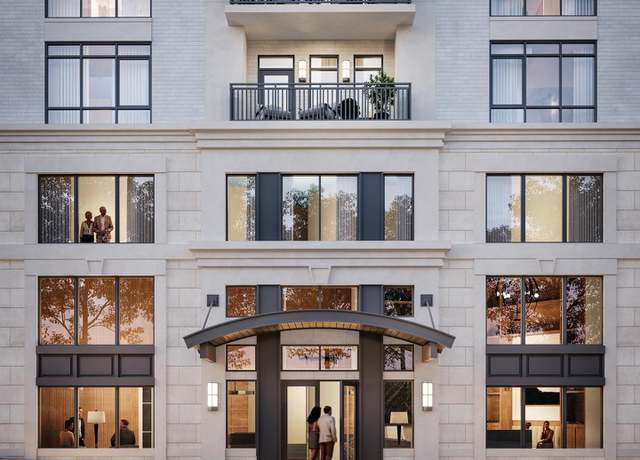
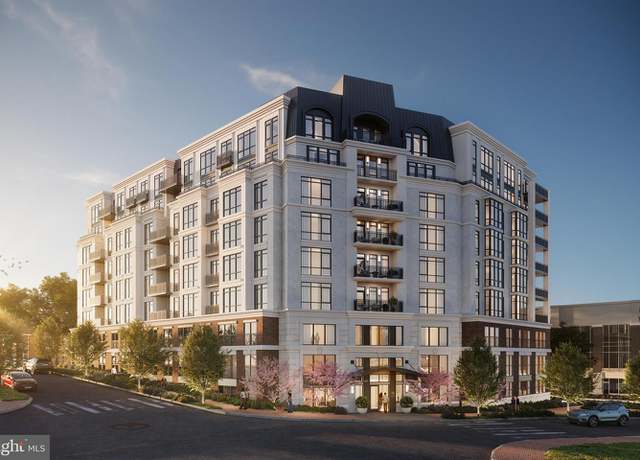
Now Selling! The Lowell Condominiums is a boutique building with only 44 homes! Availability ranges from Two Bed/Two Bath to Three Bedrooms +Den homes. Experience the array of amenities and the charm that The Lowell brings to life. The Lowell creates a holistic lifestyle with on-site amenities, including a fitness center, multiple club rooms, a landscaped courtyard with gas grills, designated dining areas, gas firepits, and a 2-story lobby with onsite staff. Garage parking is included. EV Chargepoint and residential storage are available for purchase. Located in the heart of downtown Mclean, The Lowell's location offers more than just local convenience. You'll enjoy seamless access to the
Now Selling! The Lowell Condominiums is a boutique building with only 44 homes! Availability ranges from Two Bed/Two Bath to Three Bedrooms +Den homes. Experience the array of amenities and the charm that The Lowell brings to life. The Lowell creates a holistic lifestyle with on-site amenities, including a fitness center, multiple club rooms, a landscaped courtyard with gas grills, designated dining areas, gas firepits, and a 2-story lobby with onsite staff. Garage parking is included. EV Chargepoint and residential storage are available for purchase. Located in the heart of downtown Mclean, The Lowell's location offers more than just local convenience. You'll enjoy seamless access to the
Now Selling! The Lowell Condominiums is a boutique building with only 44 homes! Availability ranges from Two Bed/Two Bath to Three Bedrooms +Den homes. Experience the array of amenities and the charm that The Lowell brings to life. The Lowell creates a holistic lifestyle with on-site amenities, including a fitness center, multiple club rooms, a landscaped courtyard with gas grills, designated dining areas, gas firepits, and a 2-story lobby with onsite staff. Garage parking is included. EV Chargepoint and residential storage are available for purchase. Located in the heart of downtown Mclean, The Lowell's location offers more than just local convenience. You'll enjoy seamless access to the
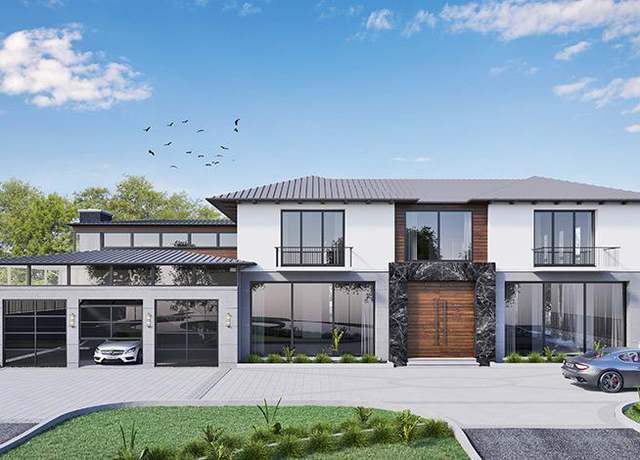
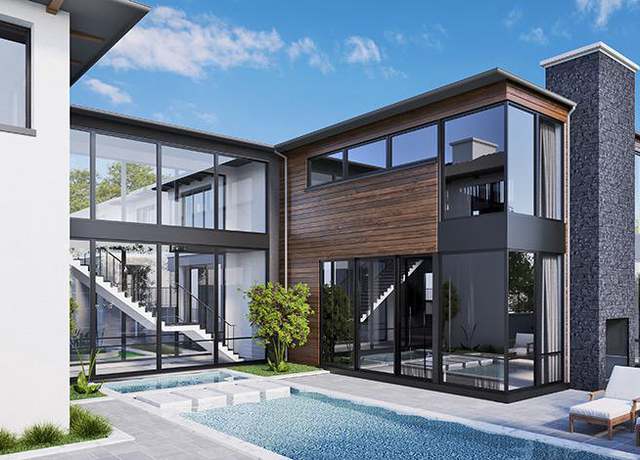
Welcome to Dogwood Estate, a remarkable modern residence envisioned by Harrison Design, nestled on an extraordinary 62,700 SF lot offering a rare blend of seclusion and convenience, setting an unparalleled standard of luxury living in McLean. Comprising a main house and a separate guest/guard house, this property presents a once-in-a-lifetime opportunity to reside in McLean's esteemed "Gold Coast. " With 12' ceilings, expansive windows, and numerous indoor and outdoor entertainment spaces, including a pool and elevator, this home is tailored for the most discerning buyer. Fully equipped with smart home automation, a Zinc Roof, and eco-friendly features, it seamlessly integrates su
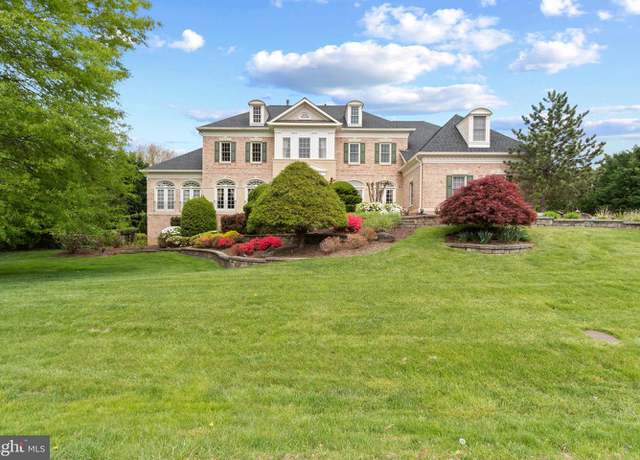
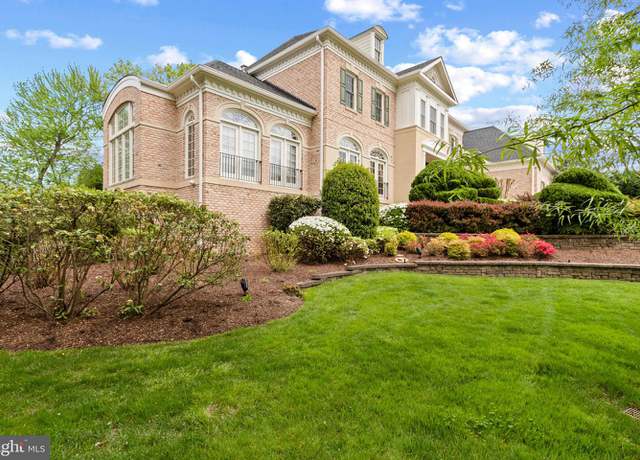
Welcome to this exquisite residence nestled in the prestigious Foxhall McLean, offering unparalleled luxury and sophistication. Over 9,400 square feet with 5 bedrooms, 7 bathrooms, hand painted entire sunroom, sauna and 3 car garage with electric vehicle charging station. Foyer, dining room, 2 story family room and upper-level hallway with custom decorative faux painting. Backyard is as private as it is expansive with large pool, huge deck and patio which can be a great entertainment venue. Fully finished walkout basement with sauna offers a personal spa experience. Large primary room offers huge closet space and sitting room with gas fire place. Recent renovation including Kitchen (2023),
Now Complete with a new price! Serene privacy and gorgeous dramatic nature views await. Discover your custom dream home on 1.47 sprawling acres in sought-after in McLean VA's Langley Forest. Look out onto a strikingly-beautiful backyard and stream from this spectacular 3-level home's balconies and fully-screened porch with Fireplace, 3-tiered decking, along with a heated salt water pool with automatic cover for perfect indoor/outdoor family living. Modern living meets timeless luxury with four-sided brick and stucco for unparalleled design: Over 11k sq feet, Gorgeous 10.25 inch Engineered White Oak Hardwood Floors first two floors. 11-foot ceilings! 3 levels with Elevator, a 4-car garage (
Oct'24 Deliver! 3 Car Garage! 2nd Kitchen! Office!Elevator Shaft! Main Level Bedroom! Pet Shower! EV Charger! Fully Fenced Backyard! Welcome to the epitome of luxury living in McLean. This stunning custom home spans an impressive 7600 sq. ft. , offering a grandeur that is simply unparalleled. From the moment you arrive, you'll be captivated by the exceptional quality and attention to detail that defines this residence. As you explore the main level, you'll discover a showcase of sophistication. With high ceilings, 8-foot interior doors, 2nd kitchen, a separate office room, and a spacious bedroom with an attached full bath, this level offers both convenience and style. The main kitchen is a
A must see, large one-bedroom condo within 1 mile of the McLean Metro Stop. This spacious 789 square foot 1 bedroom/1 bathroom condo has a large living/dining room on the top floor of the garden style building. The bright , move-in ready condo overlooks the woods and features brand new luxury vinyl plank flooring and brand new kitchen appliances. The kitchen was renovated in 2023 with beautiful Quartz countertops and a chef's sink. The bathroom is also upgraded and the entire unit has been freshly painted. The Hot Water heater was replaced in 2023. The condo also features a large walk in closet and in-unit laundry. The condo comes with a reserved garage parking spot along with access to add
Welcome to 1916 Wilson Ln #102 in McLean, Virginia! This charming garden-style condo offers convenient and comfortable living in a sought-after area of McLean. Featuring 2 bedrooms and 1 bathroom, this home offers a traditional floor plan with a spacious dining area, ideal for entertaining or enjoying meals. The upgraded countertops in the kitchen complement the modern appliances, including a gas range, microwave, dishwasher, and refrigerator. Additional conveniences include a washer and dryer. Enjoy the amenities of this community, including a refreshing community pool, volleyball courts and accessibility features for added comfort. It is an unbeatable location just a few blocks from the M
Luxury and attention to detail converge in this completely remodeled (2019) 4-bedroom, 4.5-bathroom Chesterfield residence on a quiet no-through street. A bright foyer and formal dining room with wainscoting and millwork lie adjacent to an office/library at the front of the home. The open-concept family room/ kitchen area with stone fireplace, coffered ceiling, custom Fabuwood cabinetry, floating shelves and walls of windows is a vision of elegance. The kitchen is equipped with a showstopper quartz backsplash, the same modern custom Fabuwood cabinetry as featured in the family room, quartz countertops, and top-of-the-line stainless steel appliances, including a Thermador 6-burner gas range.
Experience luxury living in this 1,778 square foot 2-bedroom, 2.5-bath, with a DEN! Complete with Italian cabinetry, under cabinet lighting, and Bosch appliances, this kitchen is perfect for quiet cooking nights in. Otherwise, one block away will take you to the heart of Tysons, outfitted with an array of restaurants like Circa, Flower Child, North Italia and Poki DC! Retreat into the comfort of the primary bedroom fitted with recessed lighting and tray ceiling. Ample space is provided in a custom walk-in closet! Luxury abounds in the primary bathroom which boasts porcelain Calacatta marbleized flooring and surrounds. It also is finished with a custom 2 sink Italian vanity and a frameless
This magnificent custom home, nestled on a cul-de-sac in McLean's prestigious Langley Forest neighborhood, boasts over 10,000 square feet of meticulously crafted luxury. Every detail has been thoughtfully considered, from the grand foyer leading to elegant living spaces to the immaculate kitchen featuring Wolf and Sub-Zero appliances, custom cabinets, quartz countertops, and a Calcutta marble backsplash. Ideal for entertaining, the kitchen seamlessly flows into the breakfast area and spacious family room, adorned with a gas fireplace, custom built-ins, and a charming beamed ceiling. The main level also features a lovely bedroom suite and a convenient mudroom with custom built-ins. Wide plan
Step into luxury and sophistication with this stunning three-level end townhome, ideally situated in the heart of downtown McLean . Meticulously crafted for both elegant entertaining and comfortable family living, no detail has been spared in this exquisite residence. Recent enhancements, including newly installed windows and French doors, the home radiates with natural light throughout. Revel in the tastefully updated kitchen and baths featuring stainless steel appliances, quartz countertops, and quality finishes. The spacious family room, adorned with gleaming hardwood floors, seamlessly connects to the kitchen, creating a perfect gathering space. Retreat to the generous primary bedroom b
This top-floor 2-bedroom condo in Tysons Corner boasts vaulted ceilings, wood-style floors, and upgrades throughout. Enjoy the convenience of walking to Starbucks, Harris Teeter, Tysons Galleria Mall, and more. With high ceilings and windows on two opposite sides, the home feels open and receives plenty of natural light. Features include a washer and dryer in the condo, walk-in closets, and two assigned parking spaces. The Fountains at Mclean community offers on-site management, a fitness center, an outdoor pool, a clubhouse, a car vacuum area, and more. Don't miss out on this special find!
Welcome to 2146 Lily Pond Drive. A covered entry welcomes you to this stone-front craftsman-style home. Step into a charming foyer with designer wallpaper that lets you know this place is special. This 5 bedroom 4.5 bath home features hardwood floors, lavish details, and generous room sizes. A sunny office is just inside the front door, and across the hall is an alcove with a coat closet, powder room, and wine fridge with separate settings for reds and whites. The dining room is stunning, with elaborate moldings, a striking chandelier, and wall sconces. The sun-drenched open floor plan combines a dream kitchen, breakfast area, and large family room that walks out to a massive screened porch
Located in the Verse at the Boro, Tysons’ most sought after full service residential building, this stunning 22nd Penthouse floor level residence with soaring ceilings exudes sophistication, ease, and delight throughout every space. With 2 Bedrooms, 2 Full Bathrooms, one Half Bathroom, and a Den with a door and windows, 2206 is one of three residences in the building featuring this exceptional floorplan. Stunning western sunset views illuminate the open main living area through floor-to-ceiling windows while the expansive wrap around balcony extends living space to the outdoors. Gorgeous wide plank wood floors flow seamlessly throughout the spaces. The modern and sleek Kitchen by Cecc
Welcome home! Step into luxury as you enter this impeccable residence, featuring expertly designed upscale living spaces and 5 spacious bedrooms, each with their own private bathrooms. The light-filled formal dining and living room are the picture of modern elegance, with refined finishes like bold crown molding and large windows. In the exquisite gourmet kitchen, you’ll discover two-tone Shaker-style cabinets, gleaming marble countertops, impressive oversized island bar, and high-end stainless steel appliances crowned by an artful stove hood. A striking wall of windows in the enviable sunroom showcases a breathtaking panoramic view while flooding the entire space with natural lightin
Construction complete! New privacy fence. A luxurious 7,200+ square foot, 6-bedroom, 6-Full, 2-Half Bath home offering unsurpassed quality of construction, design and finishes. Set on a spacious one-third-acre corner lot in McLean's prestigious Broyhill McLeans Estate neighborhood - a prime location near Metro, Tysons, 495, in the Mclean HS cluster. The home offers sleek design, highest quality components and construction, and every possible amenity, in a serene environment. You will see superior quality in the home's inspired floor plan, featured ten-foot-tall ceilings, eight-foot-tall doors, large black trim Anderson windows and exterior doors, premium engineered hardwood flooring, Kohle
Spacious unit- great views in gated community-freshly painted-hardwood floors in LR, Dr, FY & Hall-Kit w/ granite counter-3 ceiling fans w/ lights- Garage parking- many amenities - parkland setting-ready for the new owner- Photos will be posted
Also listed as a land only MLS # VAFX2161920. Step into a world of lavishness and sophistication in this exquisite 7- bedroom, 11-bathroom chateau in the heart of McLean. Designed with meticulous attention to detail and with an elevated European-twist, this soon-to-be-built masterpiece boasts over 11,000 square feet of living space across three levels, offering the ultimate in luxurious living. On the exterior, oversized, black framed windows create a bold contrast against the classic stone exterior, beautiful slate roof, and circular stone driveway – truly an extravagant street appeal. From the moment you enter the grand foyer, you'll be mesmerized by the stunning, sundrenched open-
Explore this radiant and inviting home located in the distinguished River Oaks neighborhood of McLean, set on a serene cul-de-sac with park-like surroundings. This grand residence offers an impressive layout featuring 8 bedrooms, 7 bathrooms, a 2-car garage, and an elegant circular driveway. Standout features include a walkout basement and a deck that provide secluded, scenic vistas. Ready for your personal enhancements, this property represents a unique opportunity in an elite community where homes typically range from $3 to $10 million. Experience a perfect harmony of sophistication and potential. The main level showcases a vast living room, kitchen, dining room, and office, complemented
Spacious 2 BD 2 BA unit in beautiful Colonies at McLean! This unit is conveniently located on the first floor and features a roomy open floor plan. Neutral tile flooring runs throughout the main living areas, while the kitchen and bedrooms feature warm wood flooring. Updated kitchen boasts rich wood cabinetry, black granite counters, and stainless steel appliances. Both bathrooms also feature updates including travertine tiled walk-in shower and tub/shower combo with updated sleek black tile. Enjoy in-unit washer/dryer, plenty of extra closet space, extra storage space in garage, and ASSIGNED GARAGE PARKING! Elevator in building. 2023 water heater! The Colonies is a lush, well landscaped co
Experience the epitome of luxurious living in this French-inspired contemporary masterpiece. Nestled in the heart of McLean, this exquisite property spans nearly 8,000 square feet on a lush half-acre lot, offering a blend of sophistication and high functionality tailored for entertaining and enjoying life to its fullest. The home boasts a stunning atrium foyer leading to a meticulously designed layout that includes five spacious bedrooms, 5 full baths, and one half bath across three beautifully appointed levels. The chef’s kitchen, inspired by Michelin-star standards, features top-of-the-line KitchenAid Architect Line appliances, custom bamboo cabinetry, and a grand center island with
Welcome to 1035 Carper St. , an exquisite residence located in the highly sought after town of McLean, Virginia. This stunning property, only 9 years old shows as a brand new home. Freshly painted exterior and interior, new floors, newer HVAC, Security system, new pet electric fence. The home sits graciously on . 46 acres with lovely curb appeal and exceptional landscaping. The gourmet kitchen is a chef's dream, featuring top-of-the-line appliances, custom cabinetry, and granite countertops with an open floor plan to the Great room and adjoining family room. Seven generous bedrooms all with en-baths make this floor plan thoughtfully designed and perfect for privacy and gatherings. Th
A special and rare chance to customize or expand a house according to your unique vision and needs. Step into exclusivity with this 3-bedroom, 4-bathroom home nestled on a wooded and secluded 2-acre lot off Georgetown Pike with quick access to 495. Spanning a generous 5,116 square feet, this house is an air of understated elegance waiting to be transformed by your vision into a one-of-a-kind sanctuary. The entire house is graced with large, sunlit windows that frame the views of large mature trees and open sky, which brings in plenty of natural light throughout the house. A new roof, installed in 2024, ensures peace of mind, while fresh drywall and paint in the main kitchen and dining are
Step into luxury living in the sought-after Franklin Park neighborhood of McLean with this stunning 6-bedroom, 5.5-bathroom home boasting approximately 6,125 total square feet of quality construction and comfort. Built in 2015, this meticulously maintained residence is loaded with upgrades and offers a fantastic floor plan with 5 bedrooms located on the upper level and hardwood floors throughout the top two levels providing a seamless blend of sophistication and functionality. There is flexibility in living spaces and every detail has been thoughtfully considered, from the custom library bookshelves to the added basement bar complete with an ice maker, under-counter wine fridge, and TV&mdas
Gorgeous condo in amazing McLean location is waiting for you! This is your very own luxurious retreat in the middle of exciting Tysons! You couldn’t ask for a better place to call home. This beautiful first-floor condo features lovely hardwood floors, a balcony, custom cabinets in the bathroom, a custom display/storage cabinet in the kitchen, tons of storage space in several closets, and beautiful “golden hour” light. A four seasons porch offers a great space for relaxing and for viewing the great outdoors. And that’s just the beginning of what this property has to offer! Living in the Rotonda is like living in a resort. An active and extremely well-maintained commun
Wow What A View!! From the Balcony you can watch tennis and pickle ball being played on the OneLife Fitness Club courts, (membership available) and enjoy the beautifully landscaped Plaza. On the Plaza you can also enjoy strolling the pathways, sitting and relaxing in the sunshine, marveling at the lush landscaping, enjoying our three pools, or in the evening meeting friends at the fire pits. 943 sq. ft. one bedroom condos in Tysons Corner are hard to find especially with all the extras the Regency INCLUDES. To list just a few . .. . a garage space, a secure building, a gated entrance, 24/7 concierge service, all utilities included, metro service about 1 mile away, new pedestrian/bike b
Open Sun 1-3. PRIDE OF OWNERSHIP IS ON FULL DISPLAY IN THIS GENE MAY BUILT HOME WITH 4,450 TOTAL ESTIMATED FIN. SQ. FT. THIS SERENE OASIS FEATURES A 40X20 HEATED POOL WITH STONE HARDSCAPE & COLORFUL LANDSCAPING, NESTLED ON A . 40 ACRE CUL-DE-SAC LOT IN CLOSE-IN EVERMAY. METICULOUSLY CRAFTED, IT OFFERS THE ULTIMATE IN COMFORT, STYLE, AND REFINED ELEGANCE. THIS 5 BEDROOM, 4.5 BATH HOME IS A UNIQUE OPPORTUNITY FEATURING A DISCREET SAVARIA ECLIPSE ELEVATOR, 2015 REAR 2-STORY BRICK ADDITION WITH PRIMARY BEDROOM, EN’SUITE BATH WITH ADA COMPLIANT WALK-IN SHOWER, NANTUCKET STYLE IPE SCREENED PORCH WITH ELEVATED CUPOLA CEILING, AND AN ADDITIONAL GARAGE, FOR A TOTAL OF 3 OVERSIZE HEATED G
McLean's newest and most energy efficient new home. This home features an open floor plan with exceptional use of space. More than 7,000 square feet, 6 ensuite bedrooms, which yield 7 full bathrooms plus 1 half bath. The main floor has an oversized foyer, flanked by living and dining rooms, with the very inviting staircase being the focal point. Just beyond the foyer and staircase, is the family room with a floor to ceiling Crave natural gas fireplace with remote. The family room is open to the kitchen and breakfast area. The kitchen has an oversized island, with seating and a built-in Wolf microwave oven. Other chef-quality kitchen appliances include a Wolf 36” gas range and Wolf bui
JUST LISTED! Gorgeous 1 Bedroom + Den features a sunny wall of glass overlooking the tree canopy from the landscaped courtyard on the third floor. The open floor plan includes a chef’s kitchen and balcony and features a chandelier and gorgeous light fixtures from an international glass lighting artist. The sense of calm is highlighted by a custom-painted sky and clouds on the ceiling. Luxury amenities include 24/7 front desk and concierge, 3,000 Sq Ft private fitness center with a sauna and steam rooms. Pet friendly with a Grooming & Wash Station. Two secure parking spots and a storage cage convey. The popular Signet is an easy stroll to great restaurants, shops and grocery opt
An exceptional opportunity for a better than new custom home built by Buchanan-Price, a local McLean builder known for their quality and attention to detail. Much bigger than it looks, this modern farmhouse offers approx. 6,100 SF with stunning 10’, 13’ and 16' ceilings on the main level, a MAIN-LEVEL Primary Suite, designer finishes, and a fantastic outdoor space that will captivate even the most discerning buyer. Located on a great street in the heart of the Village of West McLean, a sought-after community with excellent proximity to downtown McLean. Step inside and be wowed by the open floor plan, designed by architect Richard Foster of Foster Zimmerman. This home effortlessl
Brand new construction! From the esteemed and award-winning modern home builder, TriCrest Homes, comes this exceptional offering. Situated on a sprawling one-acre lot in the highly coveted Langley Forest neighborhood of McLean, this property promises unparalleled luxury. TriCrest Homes is renowned for seamlessly blending fresh design, practicality, innovation, and superior craftsmanship. This forthcoming modern masterpiece boasts 7 bedrooms, 7 full baths, and 2 half baths spread across three expansive levels, totaling over 10,000 square feet. Anticipate striking walls of glass flooding the interiors with natural light, innovative architectural elements, European wide-plank flooring, and an
This condo has been fully renovated, down to the studs. With all new fixtures, fresh paint, LVP flooring, brand new appliances, luxury hand-laid tile in the kitchen and bathrooms, and so much more, this condo has a completely new vibe. The kitchen has quartz countertops, stainless steel appliances, ceramic tile floors, and an under-counter sink. The living space is open, and leads out to a beautiful patio, with tons of natural light. The bedrooms are spacious, with large closets, and the unit has new a washer and dryer, as well. Don't miss the opportunity to own this beautifully renovated condo in a highly desirable location in McLean. The condo fee includes all utilities except electric, a
Custom-Quality Winthrop home with gorgeous pool located at the end of a quiet cul-de-sac of 3 homes, perfectly sited on a private 5-acre lot. Serene setting, surrounded by trees and mature, professionally-maintained landscaping and extensive hardscaping - offering incredible views and privacy, in a convenient location - just minutes to 495, Tysons and downtown McLean. This impressive home, with 4 bedrooms, 4 full and 3 half baths and over 7,000 sq ft of living space, offers all the conveniences of how we live today. The main level with high ceilings, gorgeous trim detail, hardwood floors throughout and an abundance of oversized windows, feels open and airy, while also providing options for
This enchanting French country estate is positioned prominently on the hilltop of a picturesque 1.73 acre site. Surrounded by mature landscaping and lush gardens, the main residence features five generous bedrooms, including a spacious primary suite with a separate sitting room and private terrace overlooking the gardens. The home is resplendent with luxurious amenities including multiple living and entertainment areas, 2 kitchens, an AGA range, Subzero refrigerators, Miele appliances, 6 fireplaces, a complete spa, Sonos sound system with 14 zones, and a home theater. A covered breezeway connects the main residence with the carriage house which includes a full kitchen, two bedrooms, a full
An absolute gem, built by Gruver Cooley, on a beautifully manicured ¼ acre lot, in desirable Timberly South. This 4 bedroom, 4.5 bath brick colonial with nearly 4,800 sq ft of living space, has been lovingly maintained by the original owners. Your opportunity to live on one of the most beautiful cul-de-sac streets in this sought-after neighborhood with multiple annual community events, which feeds to the Langley High School pyramid. The traditional floor plan begins on the main level with a two-story foyer, a main level office, large living room and dining room connecting to the well-proportioned kitchen, highlighted by the breakfast nook, with stunning views of the professionally la
Welcome to this meticulously maintained gorgeous 3 finished level Colonial with over 6000 finished square feet in the sought after Carrington community! Built by the luxury builder Gulick, stunning in every way, this home has it all! This luxurious 5-bedroom, 4.5-bath home has a grand, two-story foyer that features an elegant staircase leading to the second level. The main level offers a spacious family room with a gas fireplace that leads to a private deck, a lovely sunroom, a dedicated office room, a formal dining room and a gourmet kitchen with breakfast area and an oversized two-story window. This main level has newly finished hardwood floors and porcelain tile flooring. The kitchen, of
This area's enrollment policy is not based solely on geography. Please check the school district website for more information.
Elementary schools
Middle schools
High schools
GreatSchools Summary Rating
10/10
Bannockburn Elementary School
Public, PreK-5
8/10
Churchill Road Elementary School
Public, PreK-6
8/10
Haycock Elementary School
Public, PreK-6
8/10
Spring Hill Elementary School
Public, PreK-6
8/10
Westbriar Elementary School
Public, PreK-6
Only showing 5 of
23 elementary schools.
School data is provided by GreatSchools, a nonprofit organization. Redfin recommends buyers and renters use GreatSchools information and ratings as a first step, and conduct their own investigation to determine their desired schools or school districts, including by contacting and visiting the schools themselves.Redfin does not endorse or guarantee this information. School service boundaries are intended to be used as a reference only; they may change and are not guaranteed to be accurate. To verify school enrollment eligibility, contact the school district directly.
Homes for sale in McLean have a median listing price of $2.51M. Some of these homes are Hot Homes, meaning they're likely to sell quickly.
What are some of the most popular neighborhoods in McLean?
Popular neighborhoods include The Rotonda, Williamsburg, North Arlington, East Falls Church, Langley, West McLean, Country Club Hills, Carderock, Carderock Springs, and Bannockburn Heights.
How often does Redfin update their new listings?
Most of our new listings in McLean are updated every 5 minutes so you can see new homes as soon as they come on the market. Learn more
What is transportation like in McLean?
McLean, Virginia boasts a robust transportation system, with several options for residents to navigate the region. The area is well-connected by roads, but it's worth noting that traffic levels can be high, particularly during peak hours, making driving by car a bit challenging. Public transportation is available in McLean, with a network of buses and the nearby Metro stations providing easy access to surrounding areas. Additionally, the region is conveniently located near major highways and freeways, including the Interstate 495 and Route 123, facilitating quicker commutes. Learn more on our McLean city guide.
What types of properties are available in McLean?
McLean, Virginia offers a variety of single-family home types, including ranch-style homes, split-level homes, and contemporary homes, among others, each with their own unique architectural features and designs. These homes can be found throughout McLean, Virginia, in neighborhoods such as Chesterbrook, Langley, and West McLean, among others. Most properties in McLean, Virginia offer multiple bedrooms and were built in various years, providing a range of options for potential buyers. To explore different property types for sale in McLean, Virginia, use the 'Home type' filter located above the active listings. Customize your search by selecting options like single-family homes, condos, townhomes, and more.
What is life like in McLean?
McLean, Virginia offers a vibrant community with a variety of amenities and opportunities. The region boasts a picturesque landscape, characterized by lush greenery and serene neighborhoods. The weather in McLean is pleasant, with distinct seasons and mild winters. The area provides a range of job opportunities, with a thriving economy and a diverse range of industries. Residents can engage in numerous recreational activities, including outdoor sports, cultural events, and local festivals.
What are the schools and amenities like in McLean?
McLean, Virginia, is a vibrant community, boasting a wide range of public amenities for its residents. The town offers a variety of dining options with numerous restaurants to choose from. For those who enjoy the outdoors, there are several parks available for leisure and recreation. Grocery shopping is convenient with multiple grocery stores located within the town. Additionally, McLean provides other amenities such as libraries, fitness centers, and shopping centers for the convenience and enjoyment of its residents.
In the past month, 47 homes have been sold in McLean. In addition to houses in McLean, there were also 4 condos, 13 townhouses, and 0 multi-family units for sale in McLean last month. McLean is a not walkable city in Virginia with a Walk Score of 23. McLean is home to approximately 48,107 people and 13,029 jobs. Find your dream home in McLean using the tools above. Use filters to narrow your search by price, square feet, beds, and baths to find homes that fit your criteria. Our top-rated real estate agents in McLean are local experts and are ready to answer your questions about properties, neighborhoods, schools, and the newest listings for sale in McLean. Our McLean real estate stats and trends will give you more information about home buying and selling trends in McLean. If you're looking to sell your home in the McLean area, our listing agents can help you get the best price. Redfin is redefining real estate and the home buying process in McLean with industry-leading technology, full-service agents, and lower fees that provide a better value for Redfin buyers and sellers.


 REDFIN IS COMMITTED TO AND ABIDES BY THE FAIR HOUSING ACT AND EQUAL OPPORTUNITY ACT. READ REDFIN'S FAIR HOUSING POLICY AND THE NEW YORK STATE FAIR HOUSING NOTICE.
 United States
 Canada