Lovely Updated Home in Serene Neighborhood - Ideal for Comfortable Living. Experience the allure of a home that combines comfort with stylish flair in a tranquil, community-oriented neighborhood. This beautifully updated home, renovated in 2019, offers a unique living space that's both inviting and modern. Situated among lush greenery, it provides a perfect retreat from the hustle and bustle. As you enter, you're greeted by a welcoming foyer that leads you to either the upper or lower levels. The home is painted in custom colors that enhance each space, creating a warm ambiance. The living room opens to an expansive deck. The dining area and kitchen are seamlessly connected, featuring high-
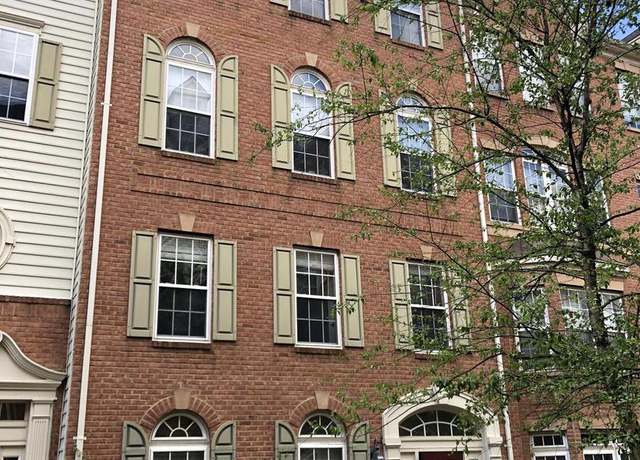
Don't miss this 3 Bed, 2.5 Bath Matisse model in the heart of Alexandria's popular Residences at Sullivan Place! Walk in on main level to an open floorplan with high ceilings, recessed lights, kitchen and family room. The Kitchen features granite counter tops, stainless steel appliances, gas cooktop and an island with bar stool seating that looks out onto the family room. The main level also has a pantry, powder room and garage entry. The upper level offers a primary bedroom with 2 secondary bedrooms. The primary bedroom is spacious with primary en suite luxury bath with dual vanity and custom tile shower and walk in closet. Two secondary rooms are spacious and share a full hall bath. The
1/4
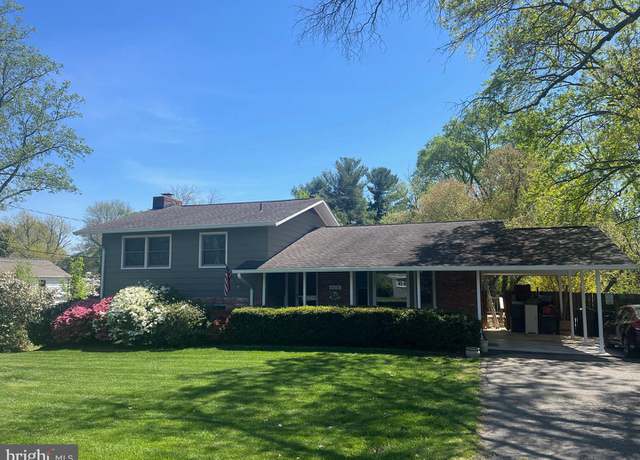
$500,000
3 beds2.5 baths1,642 sq ft
5643 Harrington Falls Ln Unit C, Alexandria, VA 22312
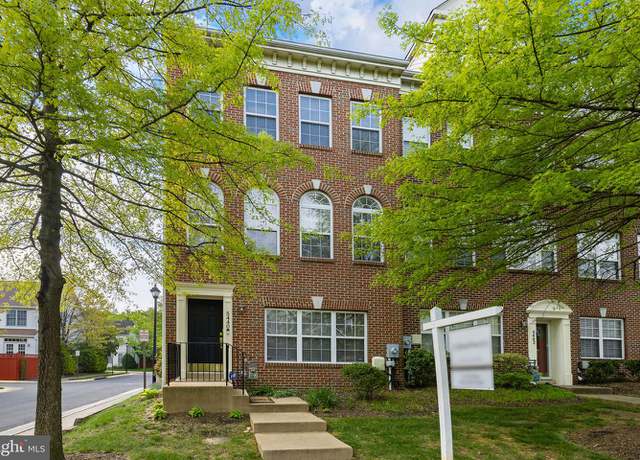
Welcome to Windy Hill at Lincolnia a small community centrally located in Alexandria just 10 miles from DC and Fort Belvoir. Community amenities include an outdoor pool, clubhouse, and playground. This low-maintenance, 4-level, end-unit townhome is flooded with natural light and comes with a 2-car garage. Garage enters to living room/den. The main level has an open floor plan with 2nd living room, dining area, powder room, and spacious eat-in kitchen with fireplace. Deck off kitchen is perfect for your morning coffee or happy hour. Upper bedroom level with laundry, primary suite with soaking tub, double vanity, and separate shower & 2nd bedroom with its own bath. 4th floor bedroom mak
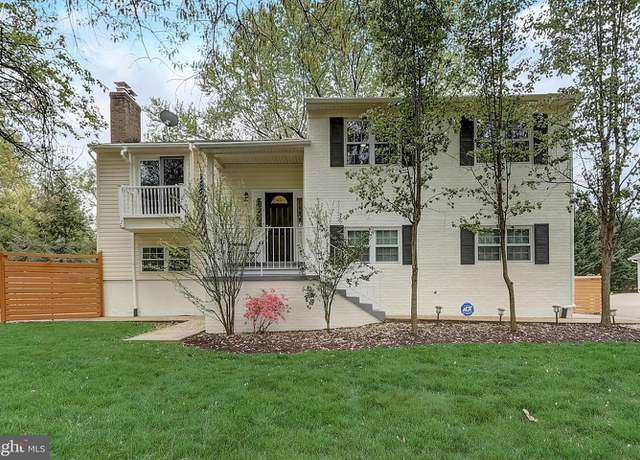
BEAUTIFUL, RARE, .72 ACRE LOT IN THE HEART OF FAIRFAX COUNTY IN PRIME LOCATION! Don't miss out on this opportunity! Stunning, relaxing, fenced back yard with pool, open grass areas, mature trees, patio, and deck will make you feel like vacation every day! Great curb appeal with covered front porch and carport plus multi-car parking * Open main level floor plan with wood floors, living room with bay window, formal dining room with sliding door to back deck, and eat-in kitchen with breakfast bar, granite counters, and updated stainless steel appliances within the last year * Lower level family room with tile flooring, cozy fireplace with brick hearth and wood mantle, and sliding door to
Welcome to a beautifully maintained property boasting an array of enhancements! This home effortlessly sets a cozy and serene tone with its fresh interior paint, applied in a lovely neutral color scheme that lends an air of tranquility to every room. The expansive primary bathroom doesn’t disappoint, featuring the luxurious ease of double sinks designed for convenience and style. The heart of the home, the kitchen, shines with eye-catching stainless steel appliances, all updated and ready for home cooking or even entertaining. A kitchen island takes center stage, providing extra counter space for meal preparation or casual dining. The ambiance is further elevated by a warm and invitin
Welcome to 6567 River Tweed Lane, a modern and stylish home located in the heart of Alexandria, VA. This stunning property offers 3 bedrooms, 3.5 bathrooms. Upon entering, you'll be greeted by a bright and airy interior with recessed lighting, creating a contemporary ambiance throughout. The main level features a formal dining room, perfect for hosting intimate gatherings and creating lasting memories. The gourmet kitchen is a chef's dream, boasting granite countertops and ample storage space. Step outside to the balcony and deck, ideal for enjoying your morning coffee or hosting outdoor barbecues. The living room is the perfect place to unwind, complete with a cozy fireplace for those chil
This lovely end-unit townhome features a two-car garage and numerous updates throughout, including all beautifully remodeled bathrooms. As you step inside, the bright entryway with sidelight windows flanking the front door creates an inviting atmosphere in the family room with newly installed tile as well as a convenient half bathroom. Walk upstairs to the main level where you are greeted by the stunning shiplap accent wall, coat rack and shelf. The main level offers open concept living with hardwood floors and kitchen updates, including Smart Samsung appliances. Enjoy your morning coffee in the breakfast and dining area just off the kitchen or relax on the back deck overlooking the peacefu
Stunning Views From This 9th Floor 2 Level Condominium in the Luxury Fountains- Approximately 943 Square Feet, New Floors-Updated Owner's Bath with Private 10th Floor Entry- Convenient Half Bath Main Level-Double Glass Doors From Dining Room and Living Room to Oversized Balcony and Breathtaking Views-Condominium Fee Includes Most Utilities- Outdoor Pool-
Welcome to the Watergate at Landmark! The resort-like community inside the Beltway. Spacious 2 Bedrooms, 2 Full Baths G model unit (1309 Sq) is just waiting for you to call it home! it is located on the 9th floor featuring a large balcony with spectacular views overlooking the mature trees and a quiet park-like setting off the living room. Newly updated unit. Wood flooring in living/dining area, Updated kitchen with New floor, countertop, and backsplash. Full-size front-load washer/dryer. Updated baths with new vanities. Spacious bedrooms with lots of storage. New Light Fixtures. The condo fee includes all utilities except phone and cable. This condominium complex features pet areas (with
Fully Renovated townhome located in Fairfax County, New Roof * being installed * * * * * * OPEN HOUSE * * * * * * * * * SATURDAY APRIL 20 AND SUNDAY APRIL 21 2024 12PM-3PM * * * * * * * * * This newly renovated and freshly painted townhome in Virginia is a gem waiting to be discovered. With hardwood floors and laminate in the basement, this home exudes elegance and comfort. The kitchen features new quartz countertops and a farm sink, while the foyer and upstairs bathrooms boast new marble floors, toilets quartz countertops, sinks, fixtures, tile, and lighting fixtures. What sets this property apart is its versatility. With county approval, the basement could easily
Welcome to the superb sought-after The Isabella at Monticello Mews condominium in Alexandria, where luxury meets convenience at a great value. This spacious and bright condo is filled with natural light. It features wood and ceramic flooring, granite countertops, beautiful kitchen cabinetry, stylish backsplash, stainless steel appliances, a washer and dryer, a custom closet in the primary suite for enhanced organization, and a balcony. Enjoy the blackout shades in both bedrooms enhancing comfort and privacy. Two garage spaces ensure convenience while the storage unit provides additional space for all your needs. This gated community offers a perfect blend of convenience and amenities, which
Nestled on a peaceful lot just off Lincolnia Rd, this meticulously maintained 4-bedroom, 2.5-bathroom Colonial brick home offers a harmonious blend of comfort and contemporary updates. As you step inside, the newly installed Bolivian Ceramic flooring throughout the main level welcomes you with its understated elegance, extending seamlessly from the foyer and beyond. Adding to the allure, the foyer boasts a new crystal light chandelier, casting a warm and inviting glow upon entry. The kitchen has undergone a thoughtful transformation, with replacement cabinets and countertops installed just a year ago, along with a new wine fridge that conveys with the home. Adding to the convenience, the ki
This meticulously maintained 2,050 square foot interior townhome, located in the Pinecrest community, offers 2 owner suites and 3.5 bathrooms. The home features a living room with a woodburning fireplace and built-in shelving, a library that steps out onto a balcony, and a bonus loft with vaulted ceilings and skylights. Brand new kitchen flooring, cabinets, owner's suite bathrooms, and freshly painted interior. The kitchen features gorgeous Silestone countertops, along with a breakfast nook bathed in sunshine. Upstairs, you'll find two spacious owner suites with plush carpeting, both with private bathrooms, and a laundry area. The carpeted lower level features a remodeled bathroom, leading
Welcome to your new home at 6305 Crestwood Drive, a stunning residence nestled in the heart of Alexandria, Virginia's sought-after 22312 ZIP code. with close proximity to I-395 This elegantly appointed property boasts a perfect blend of sophistication and comfort, making it an ideal retreat. As you step inside, you'll be greeted by a bright, airy interior that exudes modern charm. The heart of this home is its gourmet kitchen, where beautiful, top-of-the-line stainless steel appliances await to inspire your culinary adventures. Every detail has been thoughtfully considered to create a space that is as functional as it is beautiful, from the sleek refrigerator to the professional-grade range
Welcome to your dream home in Alexandria, VA! Nestled in a tranquil corner, this stunning end unit townhouse offers an unparalleled combination of luxury, comfort, and convenience, with a host of desirable features to elevate your lifestyle. As you step through the door, you're greeted by a large entry area with ceramic tile floors leading into a spacious living area that beckons you to unwind by the fireplace. Head up the stairs to the timeless elegance of solid hardwood floors that grace the main level, leading you into the spacious living area where natural light pours in through large windows, creating a bright and welcoming atmosphere. The heart of this home is the large eat-in kitchen
Welcome to Spacious / updated / Luxury two bedroom and two bath unit at the Isabella at Monticello Mews. This community is equipped with security features that include a gated entrance and security code to enter the building. The unit comes with 2 parking spaces (1 garage space # 4 and 1 Surface space# 6) and 2 storage locker. In addition to the one elevator going to P2 garage residents, (Handicapped) can use the freight elevator as well. The home features engineering hardwood floors throughout, A gourmet kitchen with oversized island (Wider and Longer Island), that has been upgraded to a first grad granite and 42" Custom made cabinets with custom made pull up drawers, Stainless steel
Showing: Saturday, March 16 from 2:00pm - 4:00pm Showing: Sunday, March 17 from 2:00pm - 4:00pm Half an acre lot on a quiet cul-de-sac in the heart of Alexandria, Fairfax County! Centrally and strategically located, this home combines privacy and convenience! This is an expanded brick single-family home, rambler style, with an attached large one-car garage, a long wide driveway for about 5 cars and plenty of parking in front of the house and cul-de-sac. A huge front and back yard, fully fenced in, and NO HOA! NEW roof, exterior/interior paint, kitchen cabinets and backsplash, stainless steel appliances, granite countertop, and new windows and water heater (only 2 years old). This single-fam
* * * * * * * * * * GREAT OPPORTUNITY TO OWN THIS LOVELY, SPACIOUS TWO BEDROOMS, TWO FULL BATHS CONDO . FRESHLY PAINTED, UPDATED KITCHEN AND BATHS W / BALCONY OFF DINING ROOM. MINUTES TO METRO, REAGAN NATIONAL AIRPORT AND DC . CONVENIENCE TO SHOPPING, RESTAURANTS AND MAJOR HIGHWAYS . THIS UNIT IS MOVE IN READY . YOU HAVE ONE GARAGE AND ONE OPEN SPACE PLUS STREET PARKING.
Unbeatable Location!!! Shopping's just few minutes away. Easy access to 395 / 95 / 495. Tons of restaurant's around the area. Easy get to Old Town Alexandria, Springfield Town Center, Pentagon Mall. Under 20 minutes to DC lifestyle - Entertainments, National Harbor and much more. A center location gives you the easy travel to DC, Maryland and most important locations of Northern Virginia. 2 Parking passes 1 reserved and 1 for additional car. This 3 BR 2 BA condo has New light fixtures, Kitchen updated <3, Freshly painted, New carpet, Door Hardware's. Lowest Condo Fees in Town. Come see and make it your home.
This area's enrollment policy is not based solely on geography. Please check the school district website for more information.
Elementary schools
Middle schools
High schools
GreatSchools Summary Rating
7/10
Belvedere Elementary School
Public, PreK-5
6/10
Bren Mar Park Elementary School
Public, PreK-5
3/10
Parklawn Elementary School
Public, PreK-5
2/10
Weyanoke Elementary School
Public, PreK-5
-/10
Alc At Montrose
Public, N/A • Choice school
School data is provided by GreatSchools, a nonprofit organization. Redfin recommends buyers and renters use GreatSchools information and ratings as a first step, and conduct their own investigation to determine their desired schools or school districts, including by contacting and visiting the schools themselves.Redfin does not endorse or guarantee this information. School service boundaries are intended to be used as a reference only; they may change and are not guaranteed to be accurate. To verify school enrollment eligibility, contact the school district directly.
Transportation in Lincolnia, Virginia is primarily car-dependent, with the majority of residents relying on their cars for commuting and daily activities. Traffic levels can be high, particularly during peak hours, making driving in Lincolnia a bit challenging at times. The region does offer public transportation options, including buses and metro services, providing alternatives to driving. Additionally, Lincolnia is conveniently located near major highways and freeways, offering easy access to surrounding areas.
What types of properties are available in Lincolnia?
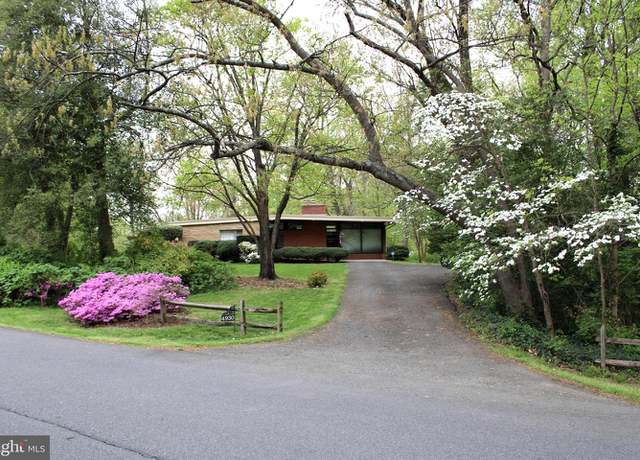
Lincolnia, Virginia offers a variety of single-family home types, including ranch-style homes, split-level homes, and colonial-style homes, among others. These homes can be found throughout the Lincolnia area, providing a range of options for potential buyers. Most properties in Lincolnia feature two to five bedrooms and were built in various years. To explore different property types for sale in Lincolnia, Virginia, use the 'Home type' filter located above the active listings. Customize your search by selecting options like single-family homes, condos, townhomes, and more.
What is life like in Lincolnia?
Lincolnia, Virginia offers a unique living experience with its tranquil surroundings and picturesque landscape. The region boasts a variety of outdoor activities, from hiking trails to serene parks, allowing residents to immerse themselves in nature. The weather in Lincolnia is characterized by mild winters and warm summers, providing a pleasant climate for outdoor enthusiasts. The area also presents a range of job opportunities across various industries, ensuring a diverse and thriving economy. Residents can indulge in a vibrant social scene, with numerous entertainment options such as local festivals, community events, and a bustling nightlife.
What are the schools and amenities like in Lincolnia?
Lincolnia, Virginia offers a variety of public amenities to enhance your living experience. You will find a selection of restaurants to satisfy your culinary cravings. For those who enjoy outdoor activities, the area boasts a well-maintained park. Shopping for daily essentials is convenient with the presence of a grocery store. Additionally, you can find more amenities that cater to various lifestyle needs.
In the past month, 12 homes have been sold in Lincolnia. In addition to houses in Lincolnia, there were also 12 condos, 11 townhouses, and 0 multi-family units for sale in Lincolnia last month. Lincolnia is a minimally walkable city in Virginia with a Walk Score of 41. Lincolnia is home to approximately 23,440 people and 10,533 jobs. Find your dream home in Lincolnia using the tools above. Use filters to narrow your search by price, square feet, beds, and baths to find homes that fit your criteria. Our top-rated real estate agents in Lincolnia are local experts and are ready to answer your questions about properties, neighborhoods, schools, and the newest listings for sale in Lincolnia. Our Lincolnia real estate stats and trends will give you more information about home buying and selling trends in Lincolnia. If you're looking to sell your home in the Lincolnia area, our listing agents can help you get the best price. Redfin is redefining real estate and the home buying process in Lincolnia with industry-leading technology, full-service agents, and lower fees that provide a better value for Redfin buyers and sellers.


 REDFIN IS COMMITTED TO AND ABIDES BY THE FAIR HOUSING ACT AND EQUAL OPPORTUNITY ACT. READ REDFIN'S FAIR HOUSING POLICY AND THE NEW YORK STATE FAIR HOUSING NOTICE.
 United States
 Canada