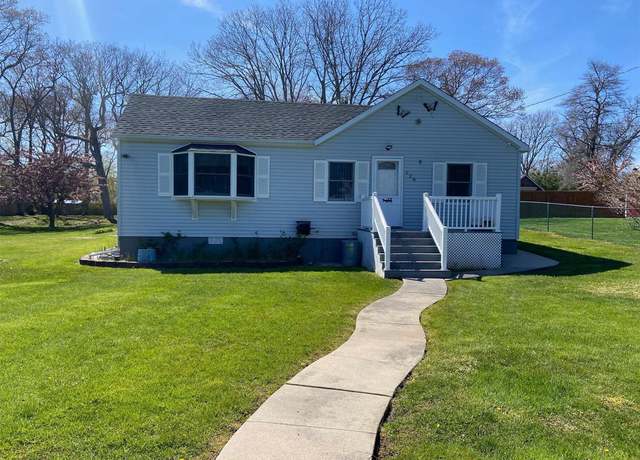
Welcome to 128 Maywood Dr. Mastic Beach. Lovely 3 Br 1 Bath Ranch nestled on well maintained spacious lot. This cozy home is perfectly located just minutes from Smith Point Beach. This home features a new oil burner, newer roof, fenced in yard, sunroom, and low taxes. The expansive property allows room for additions and renovations to create the home of your dreams.
This well-maintained two-family dwelling offers a rare opportunity for an investor to rent both units or for someone to live in one unit and rent the other. Both units have completely separate entrances. Unit 1 consists of 3 bedrooms, 2 baths, an eat-in kitchen, and a living room. Unit 2 consists of 2 bedrooms, 1 full bath, a walk-in closet, eat-in kitchen, and a living room. Many upgrades include 200-amp service, new vinyl floors, and a freshly painted interior. Extra parcel of wooded land included for potential subdivision. Two sheds featured, one with electric. Featuring low total $9150.32 taxes. Close to transportation and shopping!?
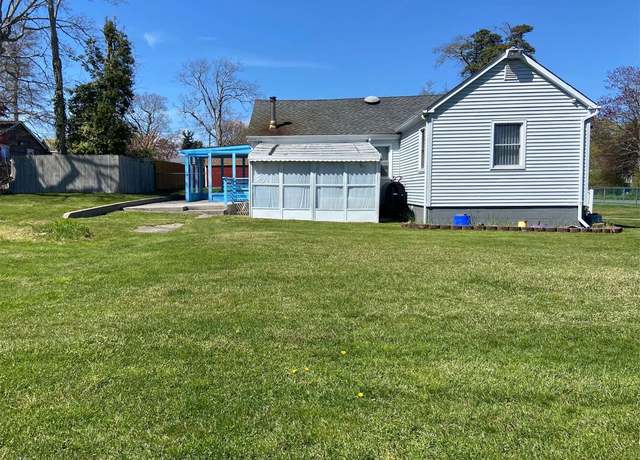
Charming 3-bedroom 1-bath home situated in the serenity of Long Island's bay. Newly renovated kitchen adds modern flair to this cozy space. Perfect for those seeking a tranquil retreat. Low Taxes, Low flood insurance, and financed solar panels (not a lease or power share!) to lower your utilities. Solar panels can be paid off at closing. Bonus structure with CO's on the property to make your own. The force is strong with this one.
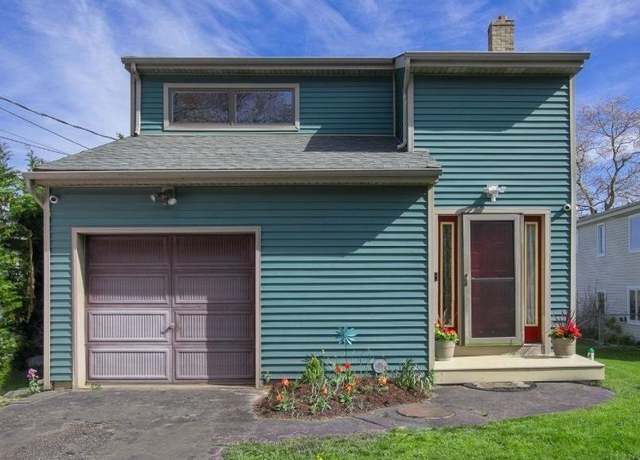
Great Property Just Minutes From Beaches, Marinas, Fishing Piers & Museums. House Features 4 Bedrooms, 2 Baths, Large Living Room & Eat in Kitchen. Detached 2 Car Garage. Needs a lot of TLC. Being Sold As Is ! Low taxes!
Exquisite Waterfront Living. Nestled along the tranquil banks of a picturesque waterway this remarkable two-story custom build contemporary home offers a perfect blend of modern luxury and serene waterfront living. As you step inside, you are greeted by an open and inviting floor plan that seamlessly combines the kitchen, dining room, and living room, all with breathtaking views of the water. The first floor features a recently updated kitchen, complete with granite countertops, new appliances, and light cherry wood cabinets with under cabinet lighting. The spacious dining room and living room area boasts luxurious vinyl plank flooring, creating a warm and welcoming atmosphere for entertain
Nestled in the heart of Shirley, this one level Ranch style home offers a perfect blend of comfort, convenience, and modern amenities. This charming home boasts a total of three bedrooms and two full bathrooms. The primary bedroom offers direct access to a full bathroom for maximum convenience. Hardwood floors extend throughout the home including under bedroom carpets. The heart of the home is undoubtedly the open concept common area. This space is free of disruptive columns, promoting a seamless flow between living, dining, and kitchen areas. The kitchen is a culinary enthusiast's dream, equipped with a large center island, quartz countertops, a pot filler, a dual fuel range (gas on top wi
Totally Renovated colonial. Featuring new flooring, new paint job. Updated heating, updated lighting throughout. This Amazing Home is ready for a large family. This home was recently spruced up so you just move right in. 20 new hi hats throughout, The Living room boast 20 foot cathedral ceilings, With a wood burning fireplace, Stainless steel appliances, Partially finish basement, ready for your finishing touches, Large fenced in yard. New Driveway Great neighborhood, Very private & quiet and so much more. Immediate occupancy.
Beautifully Maintained Cape with 3 Bedrooms, Master on First Floor, Formal Dining Room, Kitchen, Full Bath and Family Room. Newer Appliances Less Than 2-4 Years Young. Freshly Painted with Wainscoting, Chair Rails. Driveway for 6-8 Cars and Walkway with Pavers Added in 2022. Fence, One Year Young. Spacious Yard For Entertaining, Patio, 3 Sheds. This Home Is Move In Ready! Low Taxes! MORE PHOTO'S COMING!
This charming ranch-style home offers the epitome of comfortable living. Step through the inviting front door into a spacious foyer illuminated by natural light filtering in through large windows. The open-concept living area with its warm ambiance, and elegant hardwood floors that extend throughout. The heart of the home is the well-appointed kitchen, boasting Quartz countertops, stainless steel appliances, and ample cabinetry for storage. A central island provides additional workspace and doubles as a breakfast bar for casual dining. Adjacent to the kitchen is a versatile dining area, perfect for hosting intimate gatherings or family meals. The master suite is a serene retreat, complete w
Pristine and Spacious 2 bed, 1 bath Raised Ranch that is filled with natural light and contemporary amenities! As you enter, you're greeted by gleaming hardwood floors and recessed lighting. The Eat-in-Kitchen features Granite Countertops & Stainless Steel Appliances! Full basement features 2 bonus rooms, washer/dryer, and walk-out! Fit with energy star appliances and modern furnishings, this home won't be on the market for long! Snap up this gem today!
Welcome To This Cozy Cape On An Oversized Lot. This Freshly Painted Perfect Starter Home Features Over A Thousand Square Feet Of Living Space With An Eat In Kitchen, Living Room, Sun Filled Enclosed Front Porch And 3 Bedrooms. New Boiler And Oil Tank Installed. Oversized 2 Car Garage With Plenty Of Room For Storage Or Mechanics Tools. Plenty Of Yard To Create Your Own Backyard Oasis!! Don't Miss This One!
This Amazing Custom Built Colonial is Settled on 1.3 Acres. Beautiful Park Like Grounds with Tons of Privacy. Boat Dock on Open Creek that Leads to the Great South Bay. Features a Magnificent Open Floor Plan with Spacious Foyer. Massive Eat in Kitchen. Very Large Dining Rm. The Great Room Has High Ceilings with Floor to Ceiling Stone Fireplace. Upstairs Balcony Overlooks the Downstairs. Office/ 4th Bedroom on the Main Floor. Full Bathroom also on the Main Floor. Primary Bedroom has a Full Bath and a Spacious Walk in Closet. 2 Additional Bedrooms and Full Bath on 2nd Floor along with Laundry Room. Full Basement. 2 Car Garage with Heat and AC. Beautiful Hard Wood Floors. Front Covered Porch.
1 Family, Excellent Opportunity For Investment & Living, A Beautiful 1 Family House In Prime Residential Area, 2 Bedrooms, 1 Bath, Kitchen, Living & Dining, Basement, Pvt Driveway, Taxes: $8,859, Building Size: 1,368 Sf, Lot Size: 0,23 Acres, Prime Location, Shops, Malls, Restaurants & Schools Are Easily Accessible and Much More. .. .. . A Lot Of Potential
This Beautiful 2 story style home offers spacious Living room, Dining Room, 5 Bedrooms and 3 Bathrooms perfect for a big or extended family. Additionally, this home offers both renovated kitchens with state of the art cabinetry, stunning quartz countertops, stainless steel appliances, as well as a wet bar with plenty of storage for all your needs. The second floor features a large one bedroom apartment with an outside entrance possible accessory apartment with proper permits. And an oversized Primary Bedroom that includes a Balcony, Walk-in closet, Jacuzzi, and Fireplace. Meanwhile, the connecting bathroom hosts a stand up shower and Sauna Room. The backyard offers a pond, inground Swimming
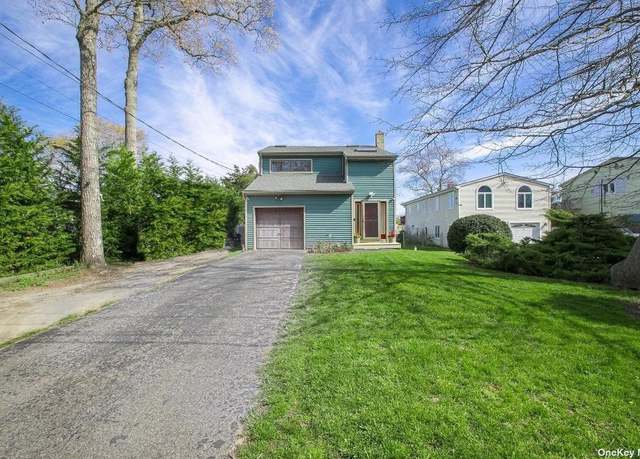
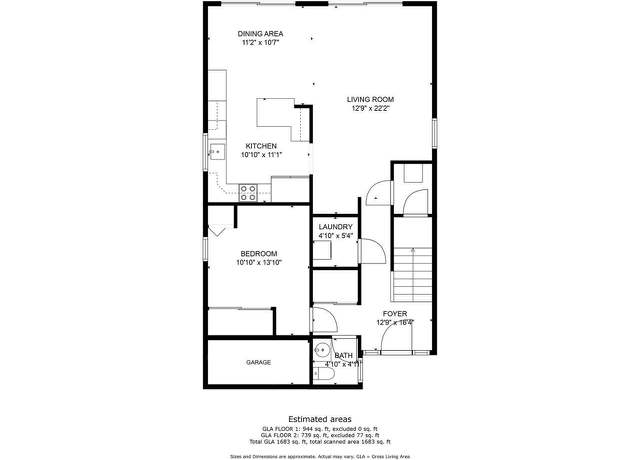
Don't miss your opportunity to own this beautiful two story traditional home on the north side of Mastic Beach. The home is so much more than it appears with four bedrooms, two full bathrooms and roughly 1,700 sqft of living space all between the main and upper level. Affording so much opportunity to entertain, the sunroom, expansive deck and generous sized backyards yields potential for a pool or anything else your lifestyle dreams. Attached is a full two car garage with high ceilings, room for a lift, large circular driveway perfect for any car enthusiasts to set up shop. Don't miss this amazing opportunity to own on Cypress Dr.
Welcome to this inviting high ranch nestled in the sought-after William Floyd school district. This spacious abode boasts four bedrooms and two baths, offering ample space for comfortable living. Stepping inside, you'll be greeted by an airy ambiance and modern amenities. The heart of the home is its open-concept layout, seamlessly connecting the living room, dining area, and kitchen, perfect for entertaining guests or relaxing with family. Enjoy the convenience of central air conditioning, ensuring year-round comfort. Outside, a private oasis awaits, featuring an inviting in-ground pool surrounded by pristine concrete patio, ideal for summertime gatherings and relaxation. With its desirabl
Completely Renovated Colonial ready for you to turn the key and call it home. Fully revitalized 4br 2ba colonial, nestled in a blossoming neighborhood near Smith's Point Beach. Every corner of this home has been meticulously restored, inside and out, offering a blend of modern comforts and classic charm. Perfectly situated a short drive from Smith's Point Beach, offering endless opportunities for seaside relaxation. Generously sized 100x100 ft lot, providing ample space for outdoor activities and a fenced yard for privacy and security. Brand new crushed bluestone driveway. Recent upgrades include a new roof, windows, and siding, ensuring both aesthetic appeal and long-term durability. Don't
Have You Been Waiting For That Affordable Opportunity To Purchase A Home? Now Is Your Chance To Make This 4 Bedroom 2 Bath With LOW Taxes Your Own! Presenting A Cape Style Home Situated On A Half Acre Plot With A Detached Garage, Offering A Partial Finished Basement For Overnight Guests With A Seperate Entrance Or Even A Private Home Office. Conveniently Located Near Shopping, Schools, Eateries, Library, Beautiful Beaches, In addition To The Long Island Railroad. Easy Access To Major Highways For Smooth Commuting. Just Waiting For Your Personal Touch, Having Lots Of Potential. So Make Your Move Before Its Gone. BEST Price In The Area For The Size Home & Property!!Taxes Without Star Ar
Come and fall in love with this Gorgeous house in Mastic Beach! Kept in pristine condition. NO FLOOD INSURANCE!!!! Double French door opens from the dining room onto the large deck for barbecue. Primary bedroom with high ceiling and Large French window that lets in plenty of natural light. Brand new oil tank with 30 year warranty. Above ground pool. New sprinkler system. Outside Shed. 2 Separate AC units, 1 for each floor. Luscious garden with privacy trees, red and white roses. Minutes away from the bay and about 10 minutes from Smith Point beach. Close to Shirley Shopping centers and the cheapest gas station on Long Island.
Brand New Construction!! Almost Complete! Features Hardwood Floors throughout, Stainless Steel Appliances, Stainless Steel Kitchen Sink, Quartz Countertops, Center Island and Solid Wood interior doors HI/Hats.
Step into this charming two-bedroom, one-bathroom retreat exuding a cozy and welcoming ambiance. Ideal for creating lasting memories, this cherished home presents a serene environment for relaxation or exciting beach adventures. The spacious living and dining area sets a delightful stage for close-knit gatherings with loved ones. Featuring two cozy bedrooms for restful nights and a shared bathroom for extra convenience, this home prioritizes comfort and happiness. Moments away from Sands Point and the William Floyd Estate, this property features a partially unfinished basement with outdoor access, along with a roomy unfinished attic that holds promising possibilities. The house includes rec
South Shirley, Just Minutes to Smith Point Beach and Marina - This 3 Bedrooms, 2 Bathroom High-Ranch is Situated on 1/3+ Acre. Living Room, Dining Room with Sliding Door Leading out to 2nd Story Deck that Overlooks Large Fenced Backyard. Kitchen with Quartz Counter Tops, Tile Backsplash, Appliances and Pantry (Updated Less than 2 Years), Master Bedroom with Master Bathroom - Both Bathrooms Updated within the last 2 Years, Attached 1-Car Garage, In-Ground Sprinklers and Double-Wide, Brick Paver Driveway and Walkway. Possible Mother-Daughter with Proper Permits. Conveniently Located to Shopping, Area Library, Parks, Beaches and Public Transportation. Award Winning William Floyd School Distric
Welcome home to Mastic Beach! Exquisitely designed and flooded with natural light this elevated construction ranch, boasts an open floor plan. The spacious eat-in kitchen features a large island, stainless steel appliances, and ample space for dining and entertaining guests. The primary en-suite bedroom is elegantly appointed with plentiful storage, providing the perfect retreat after a long day. Two additional bedrooms are nestled on the opposite end of the house, off of an elegant bathroom; offering privacy and ample space for family or guests. This home is designed for comfort and luxury, featuring Bergamo hardwood floors throughout, high hats, and central AC and heating. The 2-car det
Beautiful views from this newly built raised 2 story home !! Elevation certificate available! 1 year builders guarantee on boiler, air handler, hvac condenser, appliances, siding, roofing, plumbing lines and 200 amp electrical system until 1-22-25!! Low taxes do not reflect star exemption! Wont last at this price! Be the 1st!!
HOUSE HAS NO CENTRAL HEAT-SOLD "AS-IS" WITH CONTENTS! CAR ENTHUSIASTS DREAM! DETATCHED 2.5+ CAR GARAGE WITH ROOM FOR HYDROLIC LIFT! 3 OTHER OUT BUILDINGS. LARGE ENOUGH FOR 7 CARS-GIANT DOUBLE LOT 1/3ACRE COMBINED!
NEW EXPANDED CAPE WITH AN OPEN CONCEPT. HARD WOOD FLOORS THROUGHOUT. WHITE SHAKER CABINETS AND QUARTZ COUNTERTOPS WITH STAINLESS STEEL APPLIANCES. MASTER BEDROOM ON 1ST FLOOR. 2 BEDROOMS AND FULL BATH ON 2ND FLOOR. GARAGE- FULL BASEMENT WITH OUTSIDE ENTRANCE AND EGRESS WINDOW. NICE SIZE PROPERTY, JUST UNDER 3/4 OF AN ACRE.
Current tax as per TOB ASSESSOR OFFICE IS $786.10. THAT WILL CHANGE WHEN THE FULL ASSESSMENT FOR THE NEW BUILD IS COMPLETED. NEW CONSTRUCTION- CUSTOM BULIT CENTER HALL COLONIAL. TRADITIONAL MEETS MODERN WITH HARD WOOD FLOORS THROUGHOUT. CUSTOM MOLDING PACKAGE. WHITE SHAKER CABINETS WITH HUGE ISLAND, QUARTZ COUNTERTOPS AND STAINLESS STEEL APPLIANCES. 2ND FLOOR MASTER SUITE PLUS 3 BEDROOMS, HALLWAY FULL BATH.
Spacious and Handicap Accessible 4 Bed, 2.5 Bath Colonial, featuring Hardwood Floors, an Eat-in-Kitchen w/ adjacent Formal Dining Room, Stainless Steel Appliances, and Alarm System! The additional Den/Family Room has gorgeous Cathedral Ceilings and Bay Windows that fill the room with natural light, making it perfect for entertaining! Sitting on just under a quarter-acre, the possibilities for this property are endless! Jump on the chance to see this wonderful property today!
Nestled in the sought-after area of Mastic Beach, this 4 bed 1 1/2 bath expanded Cape is a perfect opportunity for those seeking a project to make their own. Situated near the Mastic Beach Yacht Club, this property offers a prime location for enjoying the coastal lifestyle. The Expanded Cape design offers ample space for comfortable living and entertaining. This property presents a fantastic opportunity for those with a vision to restore and customize a home to their exact preferences. The property is fully fenced, providing privacy and security for all your needs. Currently in need of a new oil tank, the home requires some work, including the restoration of the heating system. This propert
Completely renovated and absolutely beautiful!! This 2176 sf expanded ranch offers 4 Bedrooms, 4 full Bathrooms, Formal Dining room, Stunning Kitchen, Den (could be 5th bedroom), Office(could be 6th bedroom), foyer/ mudroom, 2 living rooms and a 2 car garage all on a . 37 acre lot. Perfect for extended family. Possible accessory apartment with proper permit. Must see! Landscaping in progress. All info deemed correct however should be verified by the buyer and agent.
Are you looking for the perfect combination of relaxation and entertainment? Look no further than 59 Riverside Ave in Mastic Beach. This stunning property boasts a private dock and inground pool, making it the ideal location for those who love waterfront living. Featuring 3 bedrooms and plenty of space for entertaining this turnkey home has everything you need for a comfortable and luxurious lifestyle. Enjoy the breathtaking views of the water from your outdoor porch, or take a dip in the crystal clear pool on hot summer days. But that's not all - for investors, this property is an incredible opportunity. Don't miss out on your chance to experience the best of Mastic Beach's waterfront livi
Calling all investors. This ranch style home features 3 bedrooms 2 bathrooms. Super Low taxes $5400. Close to beach, transportation and shopping. No viewings of this property. AS is Cash deal only!!!
Discover serenity at 2 Cedar Road E. in Mastic Beach - a meticulously maintained 3-bed, 1-bath ranch-style home nestled on a secluded block. This inviting residence features a cozy interior with a well-designed layout, offering both comfort and versatility. The practical kitchen complements the living spaces, while the three bedrooms provide ample room for relaxation or flexible use. Outside, the expansive yard beckons for outdoor activities and quiet moments. With its peaceful ambiance and privacy, this home is a retreat from the everyday hustle. Embrace the charm of 2 Cedar Road E. and schedule a showing to make it your own - an idyllic haven on Long Island's south shore.
Based on information submitted to the MLS GRID as of Thu May 02 2024. All data is obtained from various sources and may not have been verified by broker or MLS GRID. Supplied Open House Information is subject to change without notice. All information should be independently reviewed and verified for accuracy. Properties may or may not be listed by the office/agent presenting the information.
School data is provided by GreatSchools, a nonprofit organization. Redfin recommends buyers and renters use GreatSchools information and ratings as a first step, and conduct their own investigation to determine their desired schools or school districts, including by contacting and visiting the schools themselves.Redfin does not endorse or guarantee this information. School service boundaries are intended to be used as a reference only; they may change and are not guaranteed to be accurate. To verify school enrollment eligibility, contact the school district directly.
Mastic Beach, New York, offers a variety of transportation options for its residents. The area is served by Suffolk County Transit buses, providing public transportation to various local destinations. For those who prefer to drive, traffic levels can range from moderate to heavy, especially during peak commuting hours. Additionally, Mastic Beach is conveniently located near several major highways, including the Sunrise Highway and the William Floyd Parkway, making car travel to surrounding areas relatively straightforward.
What types of properties are available in Mastic Beach?
Mastic Beach, New York offers a variety of single-family home types, including ranch-style homes, split-level homes, and colonial-style homes, among others. These homes can be found throughout the Mastic Beach area, with some located near the waterfront and others nestled in residential neighborhoods. Most properties in Mastic Beach feature two to four bedrooms and were built between the 1950s and 1990s. To explore different property types for sale in Mastic Beach, New York, use the 'Home type' filter located above the active listings. Customize your search by selecting options like single-family homes, condos, townhomes, and more.
What is life like in Mastic Beach?
Living in Mastic Beach, New York offers a unique experience with its coastal landscape and proximity to the water. The area enjoys a moderate climate with warm summers and cool winters. Job opportunities in Mastic Beach are diverse, with a range of industries including retail, healthcare, and construction. Residents can enjoy a variety of recreational activities such as boating, fishing, and exploring nearby nature trails. The community also offers a range of local events and activities to engage in.
What are the schools and amenities like in Mastic Beach?
Mastic Beach, New York is home to a variety of public amenities for its residents. For dining options, the area boasts a selection of restaurants to cater to diverse culinary preferences. Outdoor enthusiasts will appreciate the local park, offering a green space for relaxation and leisure. For everyday necessities, there is a grocery store conveniently located within the community. Furthermore, Mastic Beach provides additional amenities such as a library, post office, and a school, ensuring the needs of all residents are met.
In the past month, 10 homes have been sold in Mastic Beach. In addition to houses in Mastic Beach, there were also 0 condos, 0 townhouses, and 1 multi-family unit for sale in Mastic Beach last month. Find your dream home in Mastic Beach using the tools above. Use filters to narrow your search by price, square feet, beds, and baths to find homes that fit your criteria. Our top-rated real estate agents in Mastic Beach are local experts and are ready to answer your questions about properties, neighborhoods, schools, and the newest listings for sale in Mastic Beach. Our Mastic Beach real estate stats and trends will give you more information about home buying and selling trends in Mastic Beach. If you're looking to sell your home in the Mastic Beach area, our listing agents can help you get the best price. Redfin is redefining real estate and the home buying process in Mastic Beach with industry-leading technology, full-service agents, and lower fees that provide a better value for Redfin buyers and sellers.


 REDFIN IS COMMITTED TO AND ABIDES BY THE FAIR HOUSING ACT AND EQUAL OPPORTUNITY ACT. READ REDFIN'S FAIR HOUSING POLICY AND THE NEW YORK STATE FAIR HOUSING NOTICE.
 United States
 Canada