Ready to make your own in the highly desired MANTUA community! This home features 7 bd/5.5 bath with almost 6,000 total square feet. Main level features space for days with a living room, dining room, sitting room, family room, kitchen, primary bedroom and 3 secondary bedrooms. Upper level features a second primary bedroom and 2 additional spacious secondary bedrooms with a shared full hall bath. The lower level boasts of additional square footage and offers a rec room, den, workshop, large storage room and a full hall bath. The exterior boasts of mature landscaping creating a private oasis. There is a full front porch and 2 decks to enjoy the scenery from. Plenty of parking spaces with 2 a
Exceptional Contemporary home, with 4,393 finished square feet and filled with style and quality features throughout. A quiet refuge, with a serene yard and mature landscaping, to enjoy with family/friends, or for large scale gatherings and outdoor entertaining. Freshly painted exterior and new driveway add to the curb appeal of this handsome home. Approach the covered entry with its impressive, mahogany custom double-front door, which opens into a welcoming wide foyer and beautiful hardwood floors. The center foyer opens up to the bright, large family room with, large windows to catch the evening sun. There is ample room for an informal dining area. The family room flows into the attr
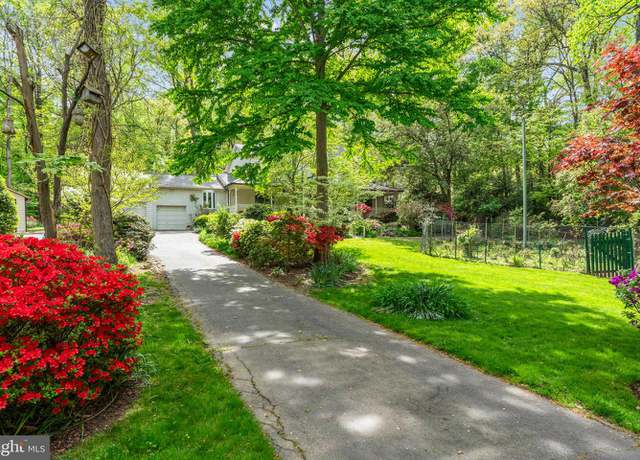
No one knows exactly why Mantua is named so—perhaps after an Italian town, or maybe inspired by Shakespeare's Romeo and Juliet. Regardless, one thing is certain: Mantua is a vibrant community, home to over 7,000 residents and conveniently located in the suburbs of Washington D. C. Welcome to this move-in ready, exquisitely renovated home, perched on a generous 0.46-acre premium lot in a quiet cul-de-sac within the heart of Mantua. Upon entering, you are greeted by a flawlessly updated interior that combines modern luxury with comfort. The heart of this home is undoubtedly the custom-designed kitchen, a dream for culinary enthusiasts with its top-of-the-line appliances, striking quartz
ACCOTINK CREEK MOSAIC DISTRICT SUN PORCH THREE-SEASON SUN PORCH SEPARATE DINING ROOM LARGE KITCHEN EAT-IN AREA This is a beautiful, very spacious 3600 sq ft move-in ready split-level home in the sought-after Mantua neighborhood. The home offers hardwood floors in the living room, dining room, and 3 of the 5 bedrooms. There is a wood burning fireplace in the living room and one in the finished basement. The large kitchen offers an eat-in area and bay window. Off the kitchen is a separate dining room. A three-season sun porch with screened windows provides an opportunity to enjoy a meal while watching the deer walking outside. The sun porch leads to steps down to the rear yard and patio. Pat
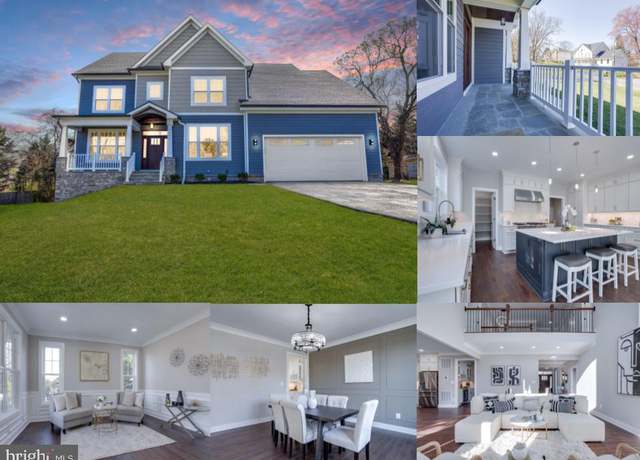
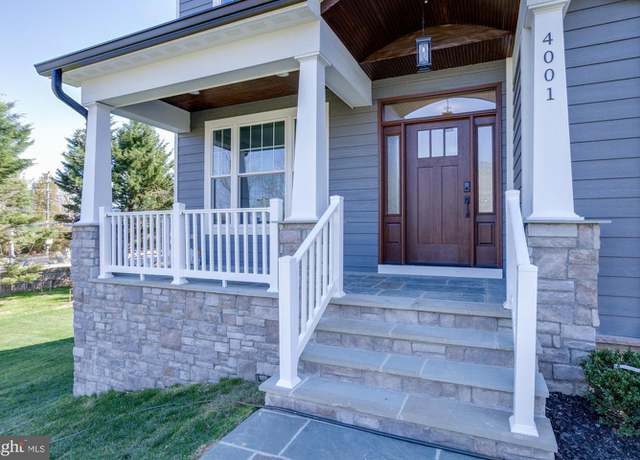
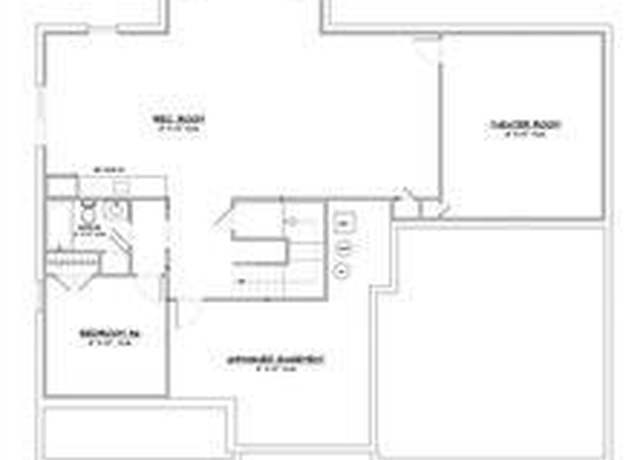
Get in now Still time to make changes. Reel Homes presents an exquisite Pre-construction Opportunity nestled in the highly sought-after Mantua Subdivision. This residence, adorned with a Three-Car Garage, graces a pristine 0.60-acre Lot. Discover the Main Level Spacious En-Suite Bedroom accompanied by an additional 5 Bedrooms Upstairs for unparalleled comfort. The Kitchen, a Chef's Dream, features a 6-Burner Wolf Range, a 42-inch Sub Zero Refrigerator, and a Bosche Dishwasher set amidst Custom Cabinets. Custom ceiling work adorns the entire Main Level, harmonizing with the wide beautiful Hardwood Floors. Elevator Ready! Step onto a spacious Front Porch or enjoy the Mudroom with Cubbies, Dra
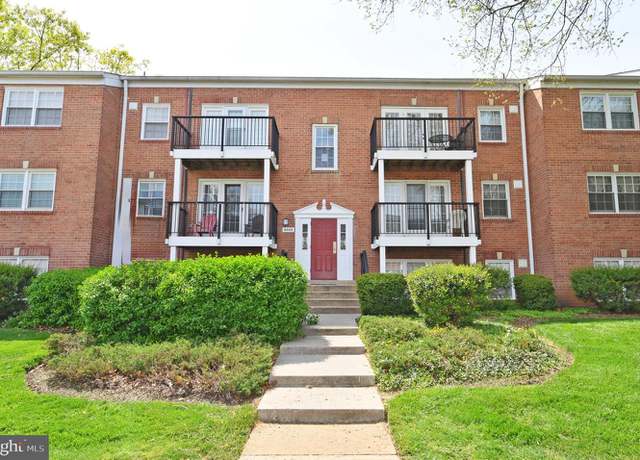
For the buyers as their primary residence only . Large 1 bedroom, 1 bath light-filled second-floor Condo located in the heart of Fairfax, All utilities (water, gas, electricity) included in condo fee. Freshly painted , New carpet throughout. Open floor plan, Light filled living room has balcony access overlooking the quiet courtyard, Separate dining area. Spacious bedroom with large closet. Foxcroft Colony offers community pool, picnic areas and grills, tot-lots, tennis, and basketball courts. Additional storage and plenty of parking included. Easy access to 50, 29 and 236, I-66 and I-495. Close to shops, restaurants and Vienna metro station. Laundry room in Building.
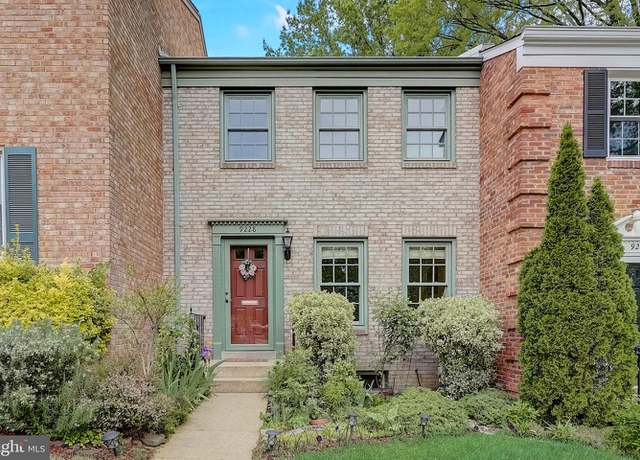
Charming Townhouse in Ideal Location - Move-In Ready! Discover the charm and convenience of this well-maintained townhouse, perfectly situated with easy access to major commuter routes like I-66, I-495, and Rt. 50. Just a short walk to the Vienna Metro and close to shopping hubs like Mosaic and Fair City Mall (Trader Joe’s) this home is designed for those who appreciate convenience paired with a comfortable living environment. This inviting home features freshly painted interiors and thoughtful updates throughout. The kitchen boasts a new range and dishwasher and a modern multifunction kitchen faucet, creating a welcoming space for meal preparations. In the dining area, enjoy meals su
Delivery Early 2025! Introducing Elysium House—The Quintessence of Modern Elegance Welcome to Elysium House, a masterpiece of modern design and luxurious living. Nestled in the vibrant heart of Fairfax, VA, at 3317 Prosperity Ave and just moments from the bustling Mosaic District, Elysium House is a beacon of sophistication and high-end lifestyle. Elysium House is more than just a residence; it is a bold statement of contemporary living, perfectly marrying state-of-the-art amenities with designs that resonate with the soul. Every element of Elysium House has been carefully crafted to not only provide a living space but to offer a thriving sanctuary. Here, cutting-edge technology and t
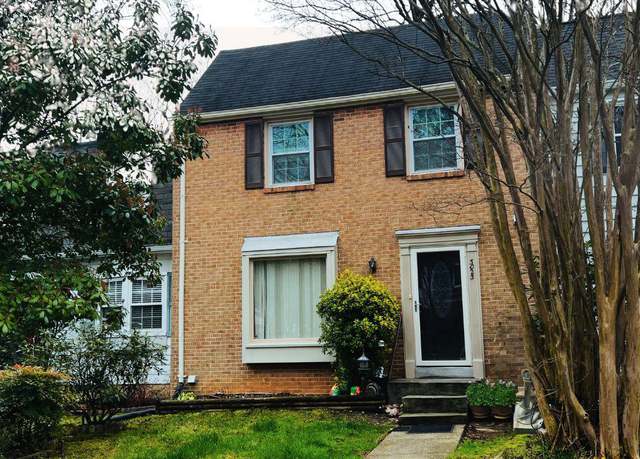
Immaculate townhome with 3 finished levels, boasting a formal living room and dining room with hardwood flooring. The living room features a bay window, creating a bright and spacious atmosphere. The finished lower level includes a recreation room and a full bath, with a walk-out to a private, fenced yard backing onto woods, offering a serene and private outdoor space. The heating and cooling systems have been recently updated, Located just 1 mile from the Vienna Metro for easy commuting. new stove and refrigerator, 2023, Dishwasher Washer and Dryer 2020, HVAC. 2018.
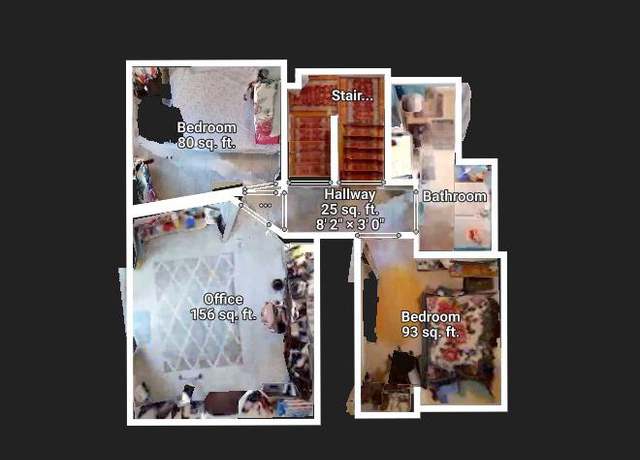
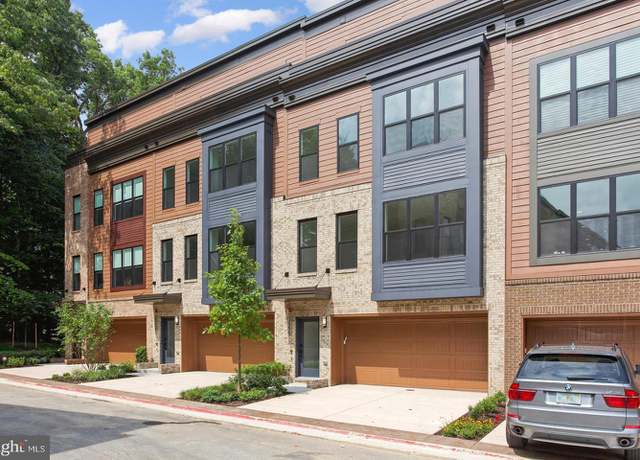
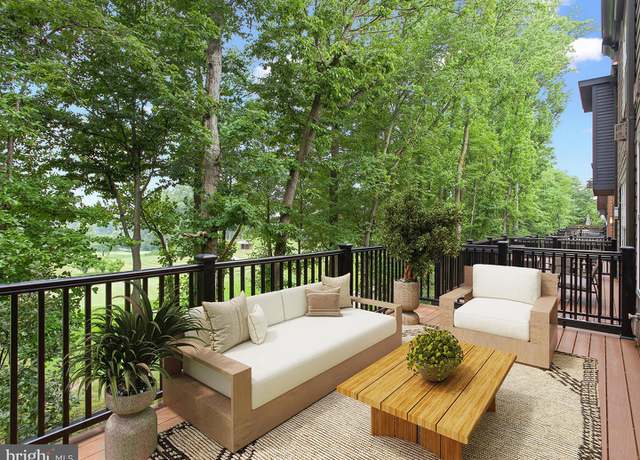
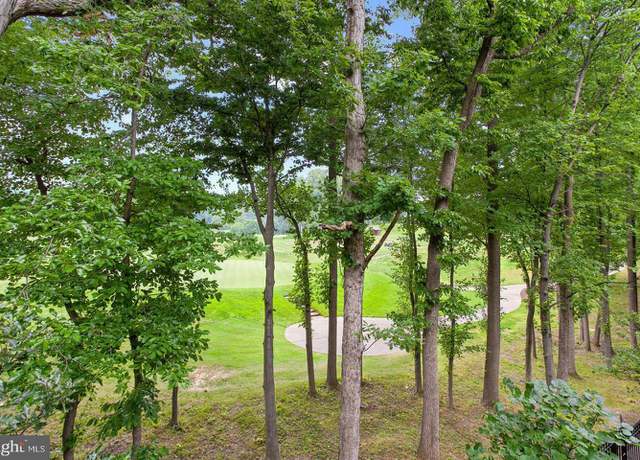
Fantastic brand new Townhouse with gorgeous views to the Golf course from every room!! Great opportunity to live in this new community with easy access to public transportation, shops and highways. This delightful 4-level townhouse has over 3000 Sq/ Ft of space with open views to the front and Golf course views to the back. The ENTRY LEVEL features a two-car garage, a recreation room with glass doors open to the backyard, a half bath, and a storage closet. The FIRST LEVEL features a big open space that has a living , dining, and family room with a deck, a powder room; all open to a lovely white kitchen with a center island, quartz counter tops and stainless steel appliances. The SECOND
A must see New Build Luxury Home by Palladium Homes Featuring 6 Rooms and 5 full baths! An amazing gourmet kitchen with Thor appliances. . Beautiful quartz countertops with island sink and main apron sink make food prep a breeze. A butlers pantry with a built in wine cooler adds additional counter space for drink and cocktails. Enjoy breakfast in the natural light from the morning room or relax near the gas fireplace in the 2 story great room. Main level offers a room with full bathroom, perfect for guests, parents, or au pair. Beautiful hardwood floors, a separate dining room , office, powder room and mudroom with builtin storage completes the main level. Take the stairs to the upper leve
4 level ELEVATOR!! Brand New EYA 4 level ELEVATOR contemporary style townhouse. Never lived in. Fabulous views!! Overlooking the Army/Navy Country Club Golf Course. 4 finished levels. Front loading TWO car garage plus private driveway parking. A walkout lower-level recreation room that opens to a flagstone patio. Open space design living, dining, kitchen, family room plus large deck on the main level. Upper lever has three bedrooms and two full bathrooms. On the 4th level there is a large loft area, a bedroom/full bath, and a roof top terrace with gorgeous views of the golf course. Just a few miles from the Vienna Metro, 495, 66, Tysons Corner, the Mosaic District and Fairfax Inova Hospita
Discover this non-buildable lot, approximately 25ft x 380 ft, located in a prime area. This versatile lot offers various possibilities, including parking space for motorhome, housecar, travel trailer, truck camper, or camp trailer, sheds for storage, real estate signage and similar or even an urban garden. For further information, use the Fairfax County Tax Assessment page with Tax ID number: 0483 01 0047A. Access the page via the link: Fairfax Real Estate Tax Assessment page The lot does not have an address, so use the coordinates: 38°52'08.0"N 77°16'34.7"W in your GPS to locate it. __________________________________________________________________________________________
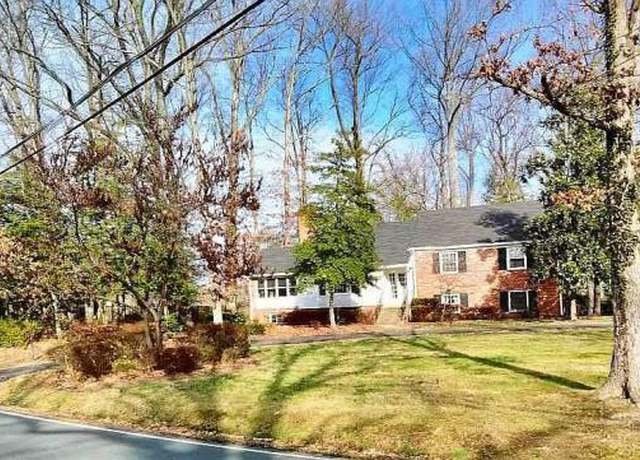
Welcome to this colonial-style brick front home located on an over 1-acre lot on a quiet cul-de-sac that sits on a hill and is nicely landscaped. This house is structurally very solid. The main structural framing of the house is steel. Only exterior walls are load-bearing, with the exception of a few members around the stairways. This property is comprised of two sections. The new part of the house, which was custom-built in 2003, has 3 levels with a footprint of 2500 sqft, 5 bedrooms and 5.5 bathrooms, and the remodeled part of the original house, built in the 1950s, has 750 plus sqft and is comprised of 3 bedrooms and 1 full bathroom with a separate entrance, which makes it a great stand-
Welcome to the fully remodeled, well equipped 4-bedroom 3 bathroom home located at 3007 Fairhill Rd. This turn-key home is located on a large, flat lot at the end of a dead-end street. This location offers superb privacy and convenience to the Mosaic District. Gourmet kitchen, quartz counter tops, stainless steel appliances, new hardwood floors throughout as well as over 1000 square feet of additional living space in the fully finished basement are just some of the highlights! The expansive lot provides ample space for outdoor activities, gardening, as well as future expansion possibilities. Situated in the sought-after Fairfax community, this residence offers the perfect blend of tranquili
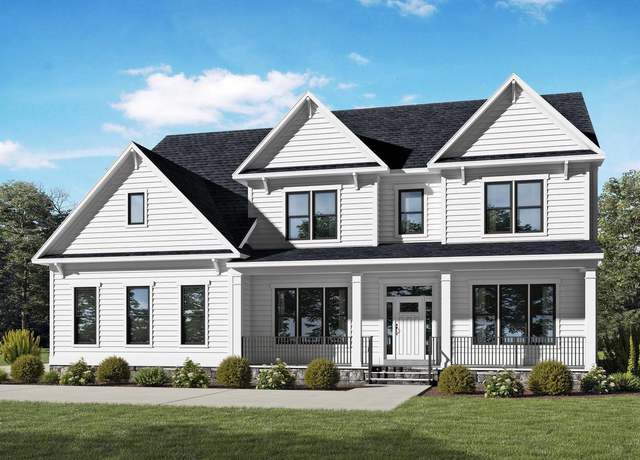
* Open House Saturday & Sunday 12pm-4pm * 25k interest rate buy down with contract by 05/15/2024 * We are proud to present our new 3 lot community in the Woodson HS district, Wakefield Grove! Lot sizes range from 10,000-16,000 sq ft. Quality, Value, and Location! Conveniently located just minutes from 495 and 50, this community offers easy access to a multitude of dining and shopping opportunities as well and parks and transit opportunities. Evergreene Homes is proud to present The Carlyle. This home offers 5 bedrooms and 4.5 bathrooms above grade. Our updated List price now includes $191,000 of structural options and upgrades including upgraded 9.25” wide plank hardwood floo
* Visit our Model at 4003 Lee Place for an Open House Saturday & Sunday 12pm-4pm * . 25k interest rate buy down with contract by 05/15/2024 * We are proud to present our new 3 lot community in the Woodson HS district, Wakefield Grove! Lot sizes range from 10,000-16,000 sq ft. Quality, Value, and Location! Conveniently located just minutes from 495 and 50, this community offers easy access to a multitude of dining and shopping opportunities as well and parks and transit opportunities. Evergreene Homes is proud to present The Carlyle. This home offers 5 bedrooms and 4.5 bathrooms above grade. Our updated List price now includes $197,000 of structural options and upgrades including upg
Pre-Construction Opportunity!!! – November/December 2024 completion forecast. Quality, Value, and Location! Luxury living on . 5 acre quiet lot in the highly sought after Woodson HS district! Enjoy the privacy of this incredible home site. Convenient location with easy access to Rt 236, 495 and 66 and tons of shopping and dining options just minutes away in Fairfax. We are proud to present our most popular floor plan - The Chapman. Our List Price includes our Platinum Finishes Package with the ability to further personalize this home by selecting from the following Structural Options: 2 or 3 car sideload garage, Morning Room Extension, Main level Guest Suite with full bathroom, Butler
School data is provided by GreatSchools, a nonprofit organization. Redfin recommends buyers and renters use GreatSchools information and ratings as a first step, and conduct their own investigation to determine their desired schools or school districts, including by contacting and visiting the schools themselves.Redfin does not endorse or guarantee this information. School service boundaries are intended to be used as a reference only; they may change and are not guaranteed to be accurate. To verify school enrollment eligibility, contact the school district directly.
Homes for sale in Mantua have a median listing price of $1.15M. Some of these homes are Hot Homes, meaning they're likely to sell quickly.
What are some of the most popular neighborhoods in Mantua?
Popular neighborhoods include Woods of Ilda, Ilda, New Hope, Fairlee, Strathmeade Springs, and Mantua Hills.
How often does Redfin update their new listings?
Most of our new listings in Mantua are updated every 5 minutes so you can see new homes as soon as they come on the market. Learn more
What is transportation like in Mantua?
In Mantua, Virginia, transportation primarily revolves around the use of cars, with residents relying heavily on personal vehicles for commuting and travel. Traffic levels can vary, with peak hours often seeing a significant increase in congestion, particularly during the morning and evening rush hours. Public transportation is limited in the area, with no major bus or rail services operating within the region. However, Mantua is conveniently located near several major highways and freeways, providing easy access to surrounding areas and cities.
What types of properties are available in Mantua?
Mantua, Virginia offers a variety of single-family home types, including ranch-style homes, split-level homes, and colonial-style homes, among others. These homes can be found throughout the neighborhood, providing residents with a range of options to choose from. Most properties in Mantua, Virginia feature three to five bedrooms and were built in various years. To explore different property types for sale in Mantua, Virginia, use the 'Home type' filter located above the active listings. Customize your search by selecting options like single-family homes, condos, townhomes, and more.
What is life like in Mantua?
Living in Mantua, Virginia offers a peaceful and serene environment surrounded by lush greenery and rolling hills. The landscape is characterized by beautiful parks, expansive forests, and picturesque lakes, providing ample opportunities for outdoor activities such as hiking, biking, and fishing. The weather in Mantua is pleasant, with mild winters and warm summers, allowing for year-round enjoyment of the natural surroundings. The town boasts a range of job opportunities across various industries, including technology, healthcare, and education. Residents can also engage in a variety of recreational activities, such as visiting local markets, exploring art galleries, and enjoying the vibrant culinary scene.
What are the schools and amenities like in Mantua?
Mantua, Virginia offers a variety of public amenities to enhance the living experience of its residents. The region boasts a selection of restaurants, providing a range of culinary options. For outdoor enthusiasts, there are several parks available for leisure and recreation. Residents can conveniently access grocery stores for their daily necessities. Additionally, Mantua is home to other amenities that cater to diverse interests and needs, further enriching the resident's lifestyle.
In the past month, 2 homes have been sold in Mantua. In addition to houses in Mantua, there was also 1 condo, 2 townhouses, and 0 multi-family units for sale in Mantua last month. Find your dream home in Mantua using the tools above. Use filters to narrow your search by price, square feet, beds, and baths to find homes that fit your criteria. Our top-rated real estate agents in Mantua are local experts and are ready to answer your questions about properties, neighborhoods, schools, and the newest listings for sale in Mantua. Our Mantua real estate stats and trends will give you more information about home buying and selling trends in Mantua. If you're looking to sell your home in the Mantua area, our listing agents can help you get the best price. Redfin is redefining real estate and the home buying process in Mantua with industry-leading technology, full-service agents, and lower fees that provide a better value for Redfin buyers and sellers.


 REDFIN IS COMMITTED TO AND ABIDES BY THE FAIR HOUSING ACT AND EQUAL OPPORTUNITY ACT. READ REDFIN'S FAIR HOUSING POLICY AND THE NEW YORK STATE FAIR HOUSING NOTICE.
 United States
 Canada