Terrific opportunity for owner-occupied or investment buyers to own this fully renovated two-family home conveniently located close to shops, schools, and the commuter rail as well as walking trails. Both units have 2 bedrooms, one bathroom and an in-unit laundry. Finished basement is part of first floor unit. Fully rented - tenant at will.
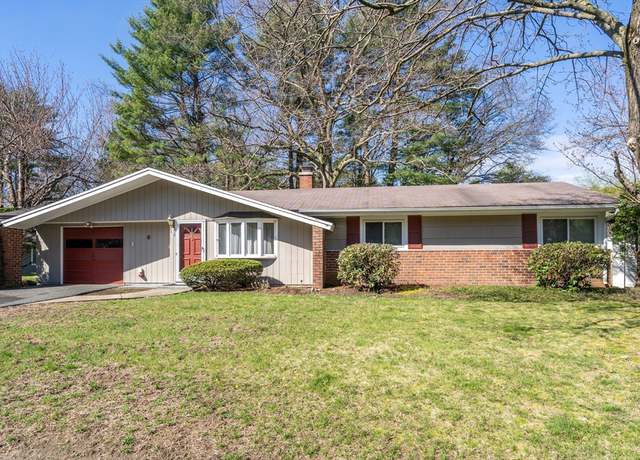
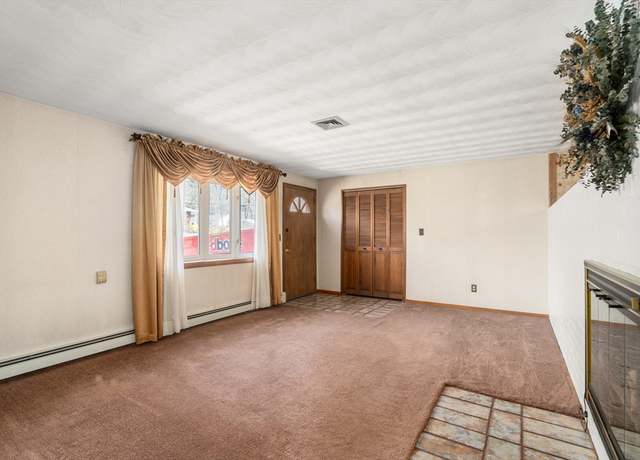
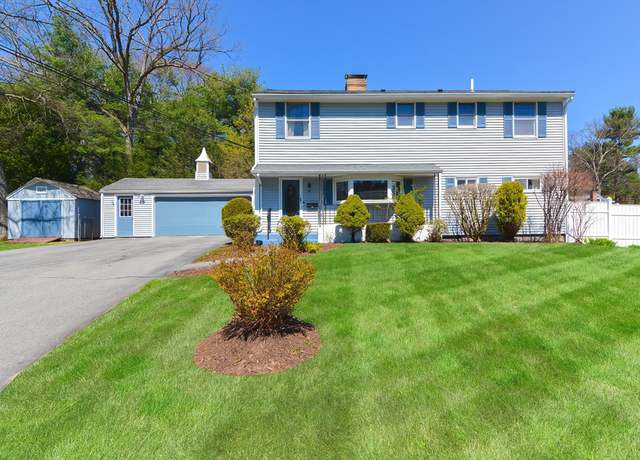
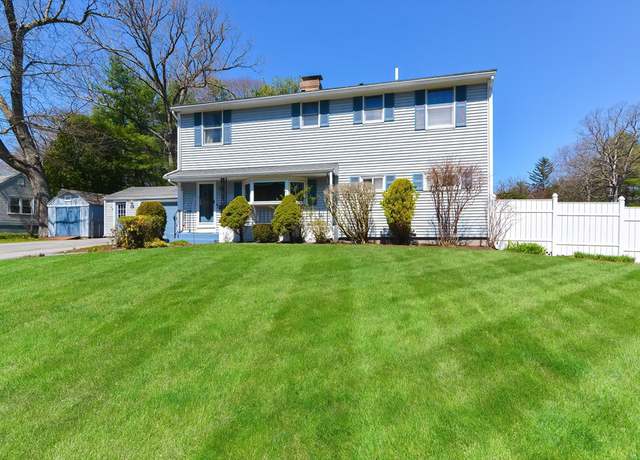
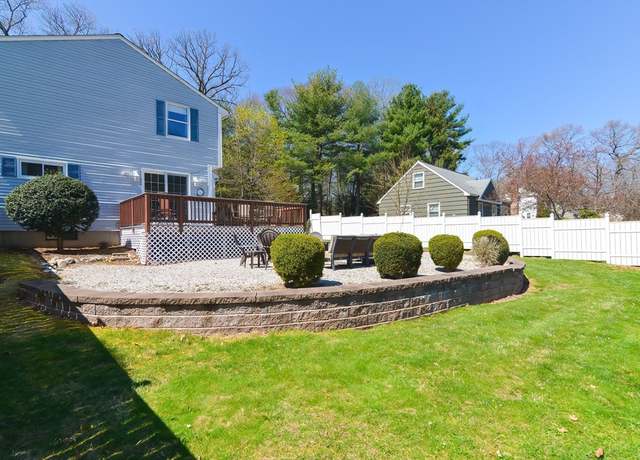
Spacious, well maintained 3 bdrm 1 1/2 bath ranch on a beautiful parklike half acre, located in a sought after neighborhood in North Framingham on the Sudbury line. Bright livingroom with large bay window and brick fireplace leads to the dining room. The large family room with recessed lights and ceiling fan leads to the bonus room, which could used as a be a 4th bdrm, office, game room etc: and leads to the picturesque, wooded private yard. The washer/dryer are in a separate area off the kitchen. The main bedroom has great space, a private half bath and good closet space. Two additional bdrms with good closet space. The heating system has been upgraded to forced hot water and a new oil ta
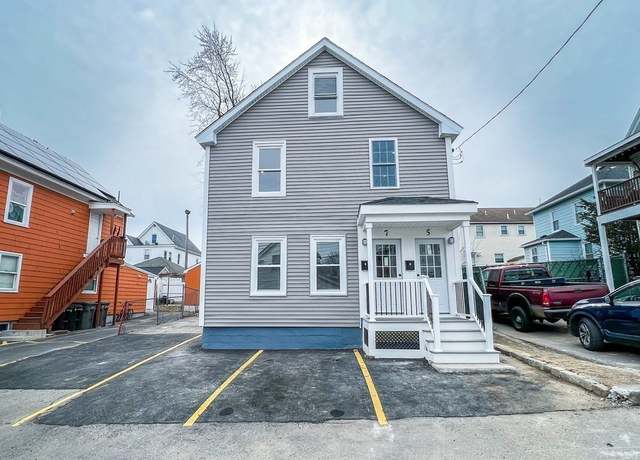
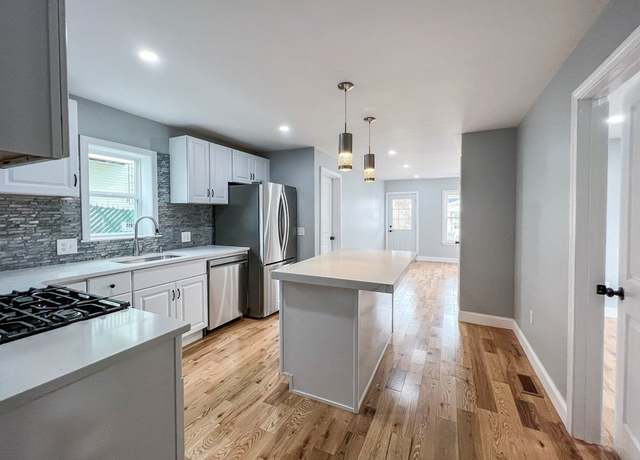
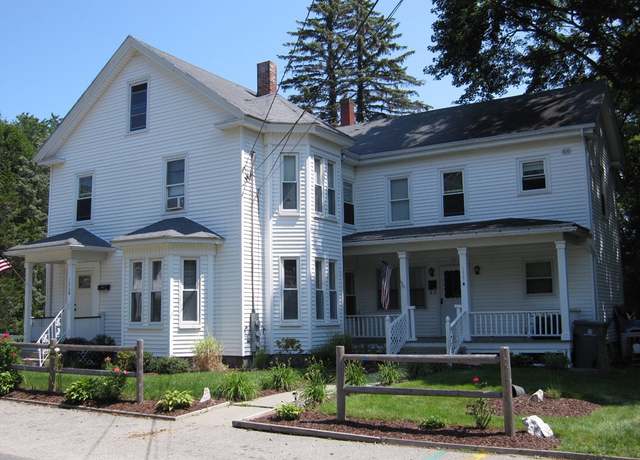
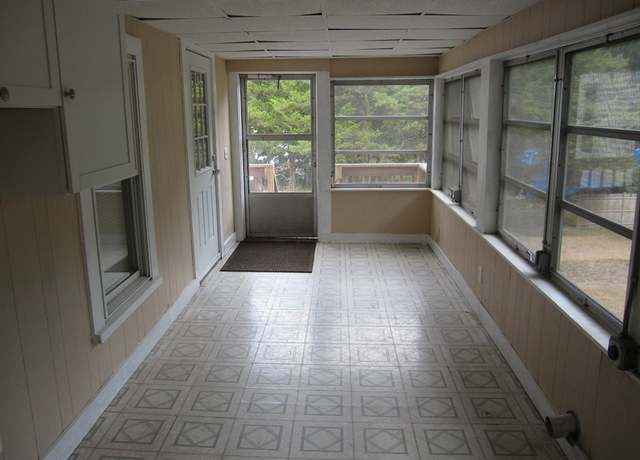
Sought after Saxonville location for this updated large two-family home. The large level half-acre lot is perfect for an owner-occupant or investor. The first-floor unit has a large eat-in kitchen with birch cabinetry, granite countertops, stainless steel appliances (new stove and dishwasher), tile flooring, and a pantry. In the second-floor unit you will find an office, ceiling fans, and a walk-up attic. There are separate heating systems fueled by natural gas and separate electric services. Both units have hardwood flooring in most rooms and bay windows in the primary bedrooms. In each unit there is a laundry and washer/dryer hook-up plus a separate three season porch. Additional updates
Welcome to your dream home! This 4-bed (potentially 5), 3-bath haven boasts a fenced-in corner lot, offering ample space for relaxation and entertainment. The heart of the home is its renovated kitchen (2008) with Silestone counters, tons of cabinets, pantry space, and oversized counter seating, perfect for culinary adventures. The living spaces flow seamlessly, from the cozy living room with fireplace to the eat-in dining area & den that leads to back deck. Generous bedrooms ensure comfort and privacy, with one bedroom conveniently located on the first floor, ideal for guests or as a home office. Upstairs, the primary suite is accompanied by two additional bedrooms, accessible via th
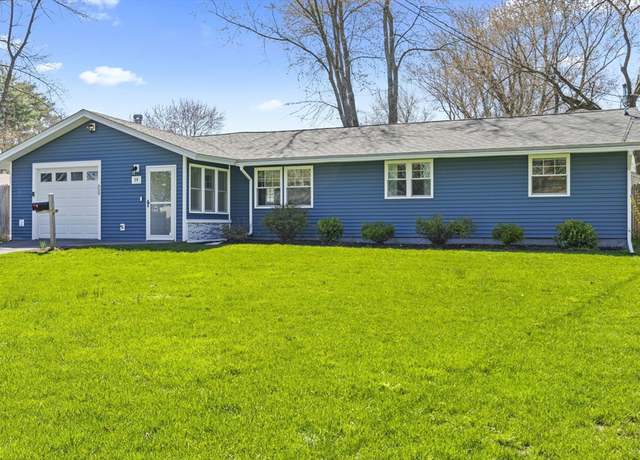
Experience sheer beauty in this recently remodeled ranch home! Step into a seamless one-floor layout, where the living room and dining area converge around a gourmet kitchen boasting creamy white quartz counters, kitchen island, and stainless steel appliances. Bask in natural light on luxurious vinyl flooring throughout. The elegant main bath offers tile flooring, double vanity sinks, and a tiled tub and shower with convenient washer-dryer access. Discover three bedrooms, including a master suite with a stunning private oversized tiled shower featuring double glass doors. Outside, revel in the fully fenced yard and newly laid paver patio. Nestled in an ideal neighborhood, this gem offers ea
Discover the charm of this antique Colonial ideally located on a scenic road. This home features 3 levels of living to include 4 spacious bedrooms, the primary with a walk in closet, complemented by two full bathrooms and 2 half baths. The heart of the home is its expansive kitchen, a chefs dream, which seamlessly blends modern amenities with classic colonial style. Warmth and character radiate throughout the fireplaced living room with French Doors leading to a large enclosed brick patio. Embrace the tranquility of outdoor living on the expansive deck, ideal for entertaining or simply enjoying the picturesque surroundings. Situated on almost 3/4 acre lot, this property offers ample space f
Beautifully updated and meticulously maintained multi-level home in wonderful neighborhood at end of a quiet cul de sac! Freshly painted, shiny hardwoods, open and airy! Family room with gas fireplace open to bright and light kitchen, eating area and additional bonus room, great for playroom or office! Upstairs to the 3 bedrooms, including custom California closets and full bath. Down to additional office space, family room/gym space, and bathroom! Large two tier deck that overlooks a beautiful private fenced yard. So many updates including a high efficiency boiler, mini-splits, solar panels, updated windows and hot water heater! Minutes from great restaurants, shopping and easy commuting!
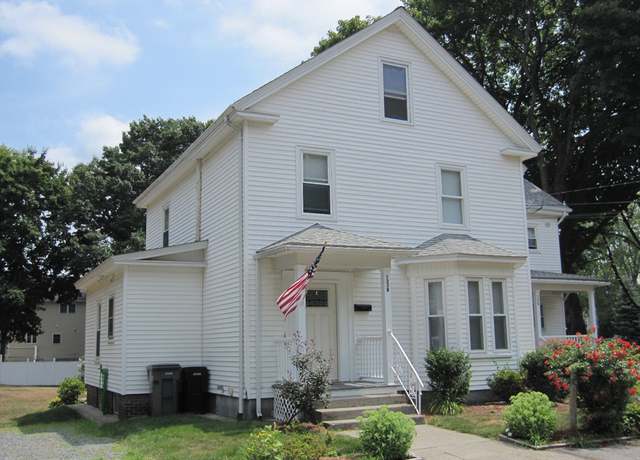
Location, Location! Don't miss out on this great 2-family home owned by the same family for over 20 years. Great investment opportunity for any buyer! First and second floors are mirror images. Each floor has eat-in kitchen, living room, 3 bedrooms and one bath. Lots of natural light in all rooms with beautuful hardwood floors throughout the living room and bedrooms. Kitchen has linoleum flooring and ceramic tiles in the bathrooms. Easy access to large and dry basement. Separate washer & dryer hook-ups. Amazing large back yard totally fenced in with shed. Plenty of parking. New cement front stairs just redone. New roof last year 2022. New heating system on the second floor 2023 with
Discover elegance in this exquisite Single-Family Home (Condo) nestled within the sought-after Montage Development, bordering the idyllic Framingham/Wayland line. Boasting 3 Beds and 2.5 Baths, this Colonial Style residence offers a harmonious blend of luxury & comfort. Step into the Kitchen featuring energy-efficient Appliances, White Cabinets, Beautiful Countertops, seamlessly flowing into the expansive Living Room adorned with a Gas Fireplace, accompanied by a distinct Dining Area. Gleaming HW floors grace the two Main Floors, alongside Two additional generous Bedrooms. Custom light fixtures, Walk-In Closets, exquisite Crown Moldings add a touch of refinement throughout. Descend in
Meticulously maintained split level in a spectacular Framingham neighborhood! This spacious 4 bedroom 2.5 bathroom house is bright and sunny with tons of natural light. The open floor plan living room and dining room has a wall of sliders that lead out to one of the two composite decks. A large family room addition, with custom built-ins, windows all around provides access to both decks overlooking a spacious flat back yard. 4 bedrooms on the first floor including a large primary with en-suite bath. Lower level features another family room, dedicated laundry room and a bonus room that is perfect for an office or gym. Attached 2 car garage. Ideally located close to Ashland Town Forest and mi
This is the one you've been waiting for - just put your bag down & get settled in this phenomenal, updated home! Interior of this home was gut renovated in 2019 including new plumbing, electrical, HVAC & insulation. Open floor plan eat-in kitchen w/ gorgeous white cabinets, granite counters, backsplash, ss appliances & pantry open to living room w/ recessed lights, all w/ hardwood floors. Current owners added kitchen island w/ additional cabinet space, XL trash/recycling & seating. Gorgeous primary suite w/ carpeted bedroom, custom storage walk in closet, bathroom w/ lovely double wide tile shower, tile floor & granite topped vanity. Two additional carpeted bed
Introducing a stunning custom-designed home, boasting 2790 sq feet of meticulously maintained living space. This residence showcases an array of extensive updates & improvements, ensuring modern comfort & style. Step inside to discover a flexible floor plan, seamlessly blending functionality w/ elegance. Soaring ceilings in the living room & dining room w/ rich hardwood floors. Sun drenched family room w/ gas fireplace & custom built-ins, perfect for entertaining. Opens to dining area w/ captivating views of Stearns Reservoir. Whether enjoying morning coffee on the deck or entertaining under the stars, this is an extension of the home's charm. Granite kitchen w/ SS a
Introducing 1057 Grove Street — Where traditional charm meets contemporary comfort: Your Perfect Blend of Home. Built in 2022, this property boasts an open concept floor plan accentuated by soaring vaulted ceilings and abundant natural light. The heart of the home is its expansive eat-in kitchen featuring a captivating waterfall island, perfect for culinary enthusiasts and entertaining alike. Retreat to the primary bedroom oasis with double oversized closets & a luxurious en suite bath with a soaking tub and double vanity sink. Three additional spacious bedrooms offer comfort and flexibility. Take your party downstairs to the sprawling basement outfitted with a gorgeous custom b
Beautiful colonial sited on a spacious lot in Framingham. This expansive home has an open 2 tone kitchen with Bosch appliances & a large eat in area. The private dining room features french doors & beautiful millwork. The formal living room has a cozy fireplace & luxurious wainscoting paneling. The first floor features gleaming hw floors & crown molding throughout. The main floor is completed with 2 bathrooms & 2 bedrooms (or offices)! Upstairs is a large primary suite bathed in natural light. The ensuite bathroom features a double vanity, walk in shower & soaking tub. The walk-in dressing room is a jaw dropper! 2 bedrooms sharing a jack & jill bath
OFFER DEADLINE 4/23 5pm * * Welcome home to 15 Weybossett Ave! Amazing location for commuters, proximity to train & all major highways, shopping restaurants, parks, & more! Take advantage of school choice with North Framingham schools & neighboring towns for possible school choice options! This stunning home has so much to offer- completely remodeled in 2012, every inch has upgraded & high-quality features to view. This beautiful lot has always been professionally landscaped, 3-zone irrigation system, fully enclosed fence, upgraded stonework & fully paid-off solar making bills minimal! This 3 bed 1.5 bath colonial is welcoming & sunny as soon as you ente
Beautiful three bedroom, 2.5 bath contemporary Cape in convenient Framingham location. Located in the Framingham Country Club area, this home is a commuters dream, located just minutes from the Mass Pike, Rt 9, and the Framingham commuter rail. This home features a renovated kitchen, with separate breakfast nook, and baths updated to reflect a modern style. Recently refinished hardwood flooring and driveway, a two car garage, and an additional 500+ ft. ² partially finished walk-out smart basement which includes a 26’ x 14’ flex room, a home office and decent size storages. A large backyard and a deck off the fireplaced living room with skylight complete this home.
Welcome to this charming, sunny and bright 3 bedroom home that has undergone major renovations and is ready for a new owner to move in! The first floor features a good sized living and dining room, 1/2 bath with laundry and a new, modern kitchen complete with soft gray cabinetry, white quartz counters and stainless steel appliances plus a greenhouse window. All new luxury vinyl flooring on the main level . Upstairs you will find 3 bedrooms all with hardwood flooring and a full bath. Updates also include a NEW 2 zone gas hot air furnace, NEW central air for the upcoming summer, NEW ductwork , NEW 10 x 12 shed, LED lighting, NEW electric panel, exterior and first floor freshly painted, refini
Open House 11-1pm Sun (4/21)Investors & builders! Golfers' paradise, commuters' dream! This bright 3 bedroom, 2 full bath Ranch is near the Framingham Country club golfcourse on a quiet side street. An inviting concrete patio w/ new front door opens into a large fireplaced living room/dining room complete sliders to a private backyard. An office/play room is steps down from main level w/ closets, laundry room/2nd bathroom & sliders to access front yard. A/C throughout! Country kitchen has extra counter space w/ peninsula, new dishwasher, new garbage, newer stove and back door to access the backyard patio. Two good sized bedrooms & a third bedroom w/ custom closets & a
Wonderful opportunity to live in a great townhouse at a reasonable price. Pastoral views out of your front window of Danforth Park and a very convenient location. Good size living room and kitchen all with neutral laminate flooring and numerous updates. Replacement windows, bright eat-in kitchen with solid countertops and lots of cabinets. Central air throughout the unit and lovely updated full bath on the second floor. Primary bedroom has lots of natural light and will accommodate a king bed with room to spare. Extra room in the basement not included in the living area for a small office, workshop, etc. In-unit laundry - washer & dryer included. No condo fees which makes owning this
Investing in a three-family home w/ easy access to the Boston train system is an opportunity ripe w/ potential. Not only does this location offer convenience for tenants commuting to Boston but it also promises steady rental income, a fundamental aspect of any sound investment strategy. With a total monthly rental income of $5,000, this property showcases its attractiveness as a lucrative investment avenue. The property is being conveyed w/ the tenants in place. The studio unit has a “property manager” in place, lease until 12/2024. The 1st floor one bedroom is on a lease until 2/2025 & the 2nd floor one bedroom would very much like to continue renting after being there f
In a market that is hard to find value, HERE IT IS. Welcome to 42 Vose St perched atop a wonderful and well kept neighborhood sits this massive home with even more room to expand. This unique property has been well cared for and carefully expanded over years of family ownership, with a sprawling first floor offering an incredible amount of flexible space. Whether its endless entertaining inside and out, or reconfiguration for a a first floor in-law suite, this layout provides many options. The second level has 3 bedrooms and 2 full bathrooms, featuring a cathedral ceiling primary suite w/ an updated spa like full bathroom, 2 walk in closets a makeup room & additional custom closet. TH
Buyer financing fell thru - The former John Macomber Estate, this one of a kind, beautifully laid out home w/ fabulous in-law apartment, is meant only for a special buyer, ready to steward this gorgeous property. Cathedral ceiling eat-in kitchen w/ stand alone SubZero fridge & freezer, oversized pantry, 6 burner gas cook top, & double oven open to family rm w/ pot belly stove. Beautiful living & dining rms w/ hdwds, gas fireplace & wet bar; perfect for entertaining. Amazing library finished in 2008 w/ custom bookshelves, gas fireplace & window seat. Stunning primary bdrm w/ huge double dressing room style closets & separate sitting rm leading to private pa
Best location in Millwood Preserve for this 1 yr old resale! Gorgeous popular Atwood model, 3 level townhouse w/ over 3,000sf of living space! High end finishes throughout this lovely end unit! Hardwood flrs throughout 1st fl! Gorgeous kit w/ stainless steel appl, Quartz counters, recessed Lts & oversized island! Lovely din rm w/ custom built-ins & built-in bench seating! Beautiful liv rm w/ vaulted ceiling, custom built-ins, gas FP, & French drs to sunroom w/ vaulted ceiling & dr to private deck! 1st fl Primary suite w/ tray ceiling, lg walk in closet w/ custom shelving, gorgeous bth w/ Quartz dbl sink vanity & oversized tiled shower w/ glass dr! Convenient 1st
Location Location Location. Two family at Natick-Framingham Townline between two T stations. Corner lot with high visibility on route 135. Possible 3 bedroom apartment on each floor. Great opportunity for experienced Investor. 12 parking spots. House will be delivered vacant. Excellent parking lot in back for customers and parking of trucks. First floor has commercial use which can be change to residential use. Second floor is a well done 3 bedroom apartment with exterior deck and updated kitchen and bath. Each unit has separate utilities.
Bright, light filled, and spacious. Enjoy sitting on your deck this spring and summer, embrace the beautiful vistas of the vast natural surroundings. Thoughtfully designed and built with exquisite craftsmanship accented by Brendon Properties Signature Trim and Finishes including white kitchen cabinets extended to the ceiling, under cabinet lighting, Quartz countertops, pre-finished oak hardwood flooring pairs with detailed interior millwork for a polished elegance throughout the home, Marble fireplace surround highlighted with signature finishes and custom bookcase. Spacious and comfortable first floor primary suite with 2 closets; double vanity in the bathroom. Details are in abundance, an
Seize the opportunity to bring your vision of a new space that you can make your own. You will have the freedom to create with your own look. Make this home shine again. First floor has 2 bedrooms and there is a stair case up to a finished attic. There is also a detached garage with this home. This is a Homepath Property!
This 3-bedroom( one in the basement), 2.5-bathroom townhouse is exquisitely renovated. Stepping into the sized living room, recessed lighting, a sprawling picture window bathing the space in natural light, and stunning hardwood flooring underfoot. The kitchen has been completely revitalized. It is adorned with granite countertops, stainless steel appliances, and a stylish backsplash, complemented by hardwood flooring and recessed lighting. A convenient door leads to the backyard, perfect for relaxing or entertaining. An updated half bathroom with granite countertops on the first floor. Ascend to the second floor to discover two sized bedrooms adorned with hardwood flooring, overhead lightin
Exquisite, custom masterpiece of timelessly elegant architecture complemented by a large, gated estate setting sited on a hilltop in a private enclave of homes w/ spectacular views * This luxurious home blends stunning bespoke details w/ the utmost in understated elegance * Welcoming entrance Foyer sets the stage for excitement * Expansive windows allow generous sunlight in every room * Gourmet Kitchen w/ Viking appliances, custom cabinets anchored by an oversized island * Banquet-sized DR * Stone fireplaced FR w/ beamed cathedral ceiling boasts oversized windows showcasing the views west * Wood paneled Study w/ coffered ceiling & built-ins * Barrel ceiling main level Primary suite i
The One and Only Blackstone Home – Builder’s Reserve home thoughtfully designed and built with exquisite craftsmanship accented by Brendon Properties Signature trim and finishes featuring a foyer, first floor home office/den and primary suite, chef’s kitchen with Thermador appliances, Quartz countertops, pantry, and wine cooler, everyday mudroom. Extended dining room unique to this plan. Detailed interior millwork for a polished elegance throughout the home, Quartz fireplace surround highlighted with signature finishes and custom built-in.
"Readily available new construction homes!" This premier enclave features 16 new homes. Enjoy care free living. Awesome commuter location with access to all major routes, train station, supermarket, restaurants, downtown Natick and Framingham. Walking distance to commuter rail, and other area amenities. This home offers 3 levels of luxurious living space. The first floor open space floor plan, combining the family room, dining room and kitchen leaving everything with in reach. Hardwood floors throughout. Spacious master suite features hardwood floors, master bath with fully tiled shower and double vanity. Granite counter tops, modern appliances, composite decking, garage parking,
1867 Antique Cape Cod with A dormers, and rear 32x12 addition (1987) / Sets high off Central Street on . 96 acre lot just outside popular Saxonville area of Framingham overlooking the Sudbury River with spectacular unobstructed views! Front entry / 1st floor with LivingRm / Formal Dining Room / Kitchen with oak cabinets and large dining area / Family room w/ sliders to rear yard / 1st floor Main Bedroom with 3/4 Bath/ Laundry & Lavatory / 2nd Floor with 4 Bedrooms / Full bath / Full basement under main house, partially finished under addition. 3-Z FHW-gas heat. City water and sewer. Spectacular yard, including turn around for easy auto exit, and a detached LTP Barn . .. it leans for
This is a residential lot located in the Cul de sac at 29 Mayhew St Extension (assessor's database show it as both "B" and "R-1") being sold together with the abutting commercial property listed separately. It has been partially used as additional parking by the abutting business (same owner) for decades. Buyer and their agent should do their due diligence on what approvals will be needed to build on this land, if desired. There was a house built on a smaller lot at 21 Mayhew St Extension recently (sold in 2023) if you want to get a sense of what could be built there, contingent upon receiving city approvals. There are houses now located at 20, 21, 24, 25, 26, 27, 32.
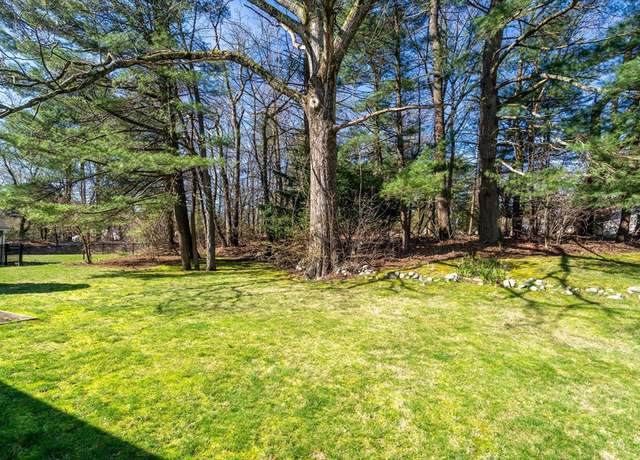
Outstanding Opportunity to build a custom home within the coveted North Framingham enclave of Brimstone Estates. Builder has released a handful of prime lots with city water and sewer on site. Enjoy nature with walking trails and scenic views of New England. This gated subdivision is one of the rare locations available to build a single family detached luxury homes. Bring your builder of choice and break ground immediately as no approvals are required, these are fully approved submission lots.
Outstanding Opportunity to build a custom home within the coveted North Framingham enclave of Brimstone Estates. Builder has released a handful of prime lots with city water and sewer on site. Enjoy nature with walking trails and scenic views of New England. This gated subdivision is one of the rare locations available to build a single family detached luxury homes. Bring your builder of choice and break ground immediately as no approvals are required, these are fully approved submission lots.
Outstanding Opportunity to build a custom home within the coveted North Framingham enclave of Brimstone Estates. Builder has released a handful of prime lots with city water and sewer on site. Enjoy nature with walking trails and scenic views of New England. This gated subdivision is one of the rare locations available to build a single family detached luxury homes. Bring your builder of choice and break ground immediately as no approvals are required, these are fully approved submission lots.
Outstanding Opportunity to build a custom home within the coveted North Framingham enclave of Brimstone Estates. Builder has released a handful of prime lots with city water and sewer on site. Enjoy nature with walking trails and scenic views of New England. This gated subdivision is one of the rare locations available to build a single family detached luxury homes. Bring your builder of choice and break ground immediately as no approvals are required, these are fully approved submission lots.
Outstanding Opportunity to build a custom home within the coveted North Framingham enclave of Brimstone Estates. Builder has released a handful of prime lots with city water and sewer on site. Enjoy nature with walking trails and scenic views of New England. This gated subdivision is one of the rare locations available to build a single family detached luxury homes. Bring your builder of choice and break ground immediately as no approvals are required, these are fully approved submission lots.
Outstanding Opportunity to build a custom home within the coveted North Framingham enclave of Brimstone Estates. Builder has released a handful of prime lots with city water and sewer on site. Enjoy nature with walking trails and scenic views of New England. This gated subdivision is one of the rare locations available to build a single family detached luxury homes. Bring your builder of choice and break ground immediately as no approvals are required, these are fully approved submission lots.
Outstanding Opportunity to build a custom home within the coveted North Framingham enclave of Brimstone Estates. Builder has released a handful of prime lots with city water and sewer on site. Enjoy nature with walking trails and scenic views of New England. This gated subdivision is one of the rare locations available to build a single family detached luxury homes. Bring your builder of choice and break ground immediately as no approvals are required, these are fully approved submission lots.
This area's enrollment policy is not based solely on geography. Please check the school district website for more information.
Elementary schools
Middle schools
High schools
GreatSchools Summary Rating
9/10
Brown Elementary School
Public, K-4
7/10
J F Kennedy Middle School
Public, 5-8
7/10
Israel Loring School
Public, K-5
5/10
King Elementary School
Public, K-5
5/10
David Mindess Elementary School
Public, 3-5
Only showing 5 of
13 elementary schools.
School data is provided by GreatSchools, a nonprofit organization. Redfin recommends buyers and renters use GreatSchools information and ratings as a first step, and conduct their own investigation to determine their desired schools or school districts, including by contacting and visiting the schools themselves.Redfin does not endorse or guarantee this information. School service boundaries are intended to be used as a reference only; they may change and are not guaranteed to be accurate. To verify school enrollment eligibility, contact the school district directly.
Framingham, Massachusetts boasts a robust transportation system, with a variety of options for residents. The town is served by the Massachusetts Bay Transportation Authority, offering public buses and commuter rail services, making commuting to Boston and other nearby cities convenient. For those who prefer to drive, traffic levels can vary, with peak hours often experiencing higher volumes. Framingham is conveniently located near major highways such as Interstate 90 (Massachusetts Turnpike) and Route 9, providing easy access for car travel.
What types of properties are available in Framingham?
Framingham, Massachusetts offers a variety of single-family home types, including ranch-style homes, split-level homes, and colonial-style homes, among others. These homes can be found throughout the city, with ranch-style homes typically built in the 1950s and 1960s, split-level homes built in the 1970s, and colonial-style homes built in the 1980s and later. To explore different property types for sale in Framingham, Massachusetts, use the 'Home type' filter located above the active listings. Customize your search by selecting options like single-family homes, condos, townhomes, and more.
What is life like in Framingham?
Framingham, Massachusetts offers a vibrant living experience with its diverse community and a range of amenities. The town boasts a mix of urban and suburban landscapes, with a variety of residential neighborhoods and commercial areas. The weather in Framingham is characterized by four distinct seasons, with warm summers and cold winters. The town provides a range of job opportunities across various industries, including healthcare, technology, and education. Residents can enjoy a wide array of recreational activities, such as exploring local parks, participating in sports leagues, and engaging in cultural events.
What are the schools and amenities like in Framingham?
Framingham, Massachusetts offers a variety of public amenities to enhance the lifestyle of its residents. The town is well-equipped with numerous restaurants, offering a diverse range of cuisines to satisfy all culinary preferences. For those who love the outdoors, Framingham boasts several parks, providing serene spots for relaxation and leisure. Residents also have access to multiple grocery stores, ensuring convenient shopping for daily essentials. In addition, Framingham provides more amenities such as libraries, gyms, and community centers, all contributing to a comfortable and convenient living environment.
In the past month, 30 homes have been sold in Framingham. In addition to houses in Framingham, there were also 14 condos, 12 townhouses, and 6 multi-family units for sale in Framingham last month. Framingham is a minimally walkable city in Middlesex County with a Walk Score of 42. Framingham is home to approximately 68,030 people. Find your dream home in Framingham using the tools above. Use filters to narrow your search by price, square feet, beds, and baths to find homes that fit your criteria. Our top-rated real estate agents in Framingham are local experts and are ready to answer your questions about properties, neighborhoods, schools, and the newest listings for sale in Framingham. Our Framingham real estate stats and trends will give you more information about home buying and selling trends in Framingham. If you're looking to sell your home in the Framingham area, our listing agents can help you get the best price. Redfin is redefining real estate and the home buying process in Framingham with industry-leading technology, full-service agents, and lower fees that provide a better value for Redfin buyers and sellers.

 REDFIN IS COMMITTED TO AND ABIDES BY THE FAIR HOUSING ACT AND EQUAL OPPORTUNITY ACT. READ REDFIN'S FAIR HOUSING POLICY AND THE NEW YORK STATE FAIR HOUSING NOTICE.
 United States
 Canada