3 Beautiful Lots on the Fox River across from Norge Ski Jump. Perfect opportunity to build your dream home on nearly 150 foot of Riverfront. Large Shed on lot, nice patio area overlooking the river. Seawall has been reinforced and lengthened. Well (2010). Rehabbed guest house is currently being rented. This property is located between both of the neighborhood lots, so you don't have neighbors on either side. Don't Miss out on this great opportunity! Make your appointment today!
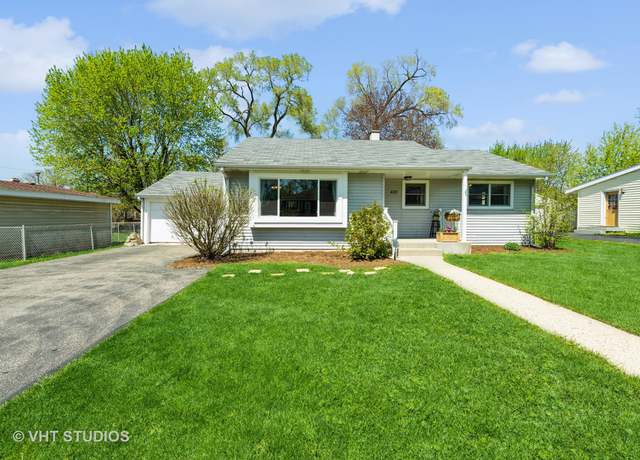
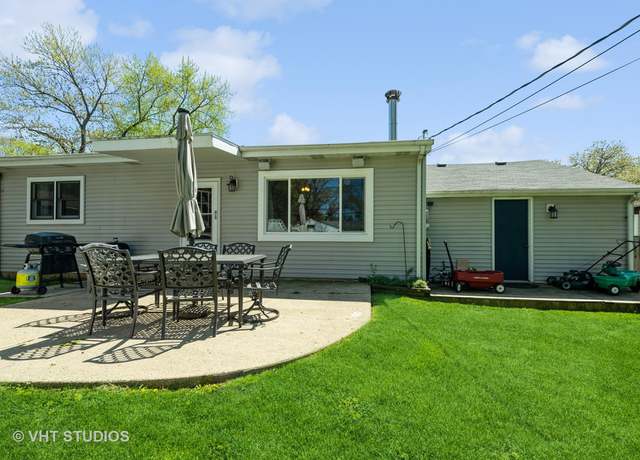
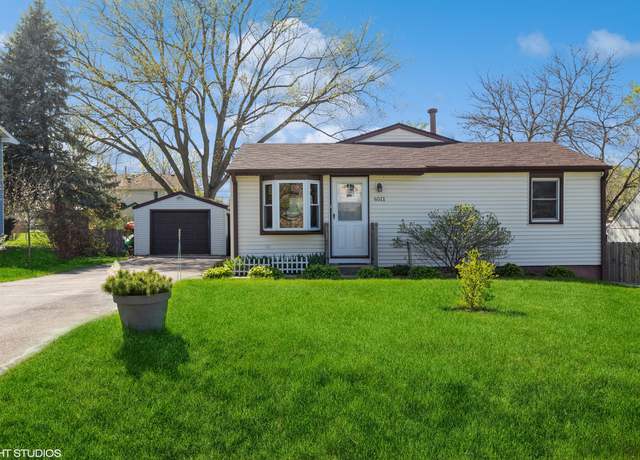
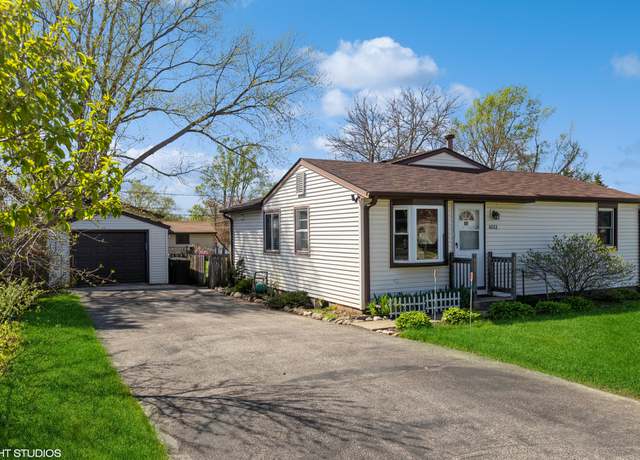
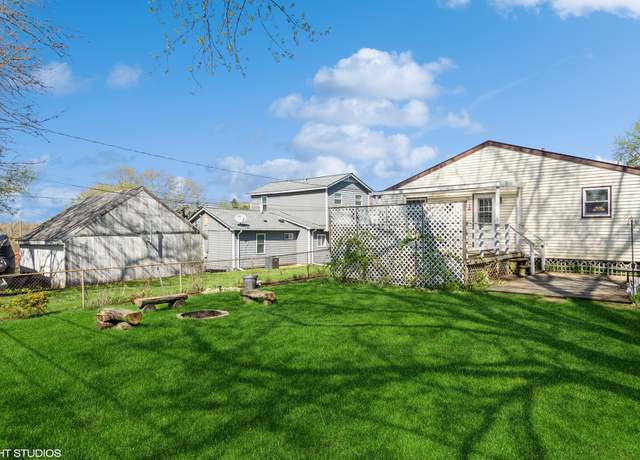
Awesome Ranch home with a sweet front porch and nice curb appeal! This property will surprise you with 1,497 square feet! The living room is warm and inviting, recently painted and tastefully decorated. The immediately adjacent dining space is ideal for hosting or game nights. Four total bedrooms include a primary and 3 secondary bedrooms. While private the primary and neighboring bedroom (current nursery) have an interesting feature and connect via pocket door. Bathrooms include one full bath and one half bath. The kitchen is efficient and includes the fridge, stove and dishwasher. The washer and dryer stay as well. A combination pantry/laundry/mudroom is very convenient and leads to the
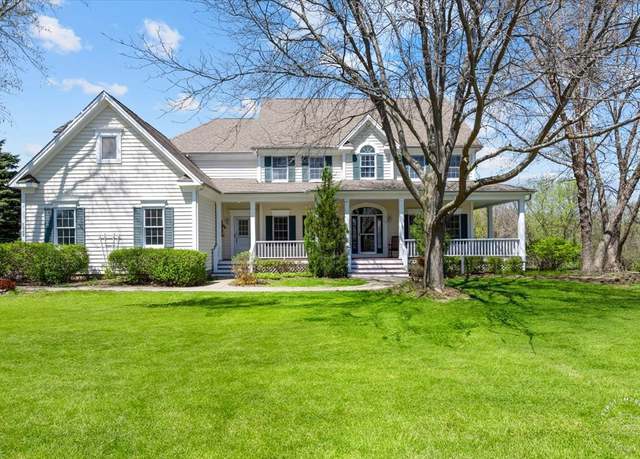
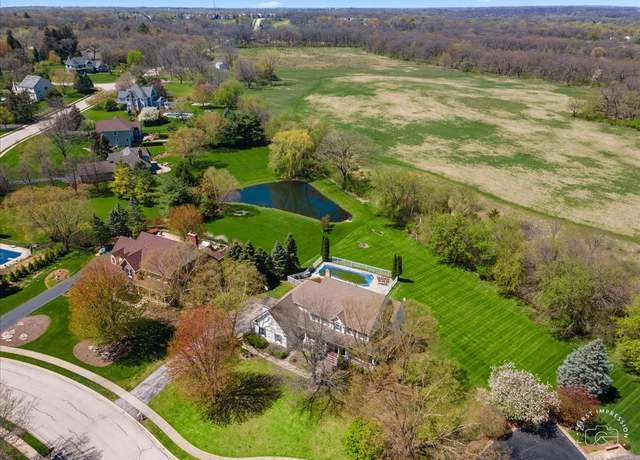
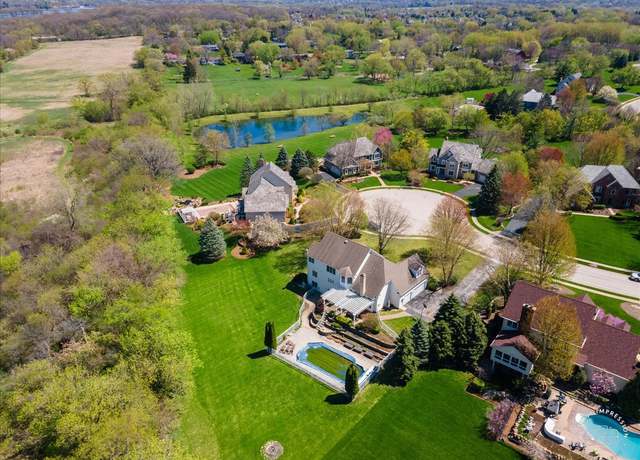
Looking for an inground pool, over 5000 square feet of living space with finished walkout basement nestled on scenic wooded 1 acre cul-de-sac lot backing to the Conservation area? This home has been UPDATED and move in ready--THIS is the home for YOU! UPDATES: new furnace, A/C April 2024 and water heater April 2024. Entire interior freshly painted March 2024.. .Hardwood floors refinished March 2024.. .New carpeting March 2024.. .some new interior light fixtures. .. Argo Windows checked & serviced windows February 2024.. . Landscape clean up. end of March. .. Roof 2011.. .Open airy floor plan is sure to delight the new owners! Spend your summer enjoying the INGROUD POOL, patio, and
Welcome home just in time for the Summer! Why rent when you can buy this cute home! This property is bigger than it looks like! Remodeled: total of 4 bedrooms, 2 baths, finished basement, deck, fenced yard, 1 car garage + long driveway to park more cars. Home updates include: kitchen cabinets, countertop, backsplash, range hood, bay window, some flooring, baseboards, added closets, mirror closet doors, regular closet doors, book shelves, whirlpool tub, attic insulation, hot water tank, custom wood walls, custom wood table, basement windows, ceramic floors, pocket/sliding/barn door, built-in wall bar cabinet, both bathrooms completely updated, laundry sink, laundry room cabinets, sump pump,
This 1 owner home has lots of room to spread out. The large foyer leads you to the formal living room, up to the bdrms & into your eat in kitchen. The kitchen connects to a sunk in family room & a formal dining room which makes the main floor perfect for entertaining friends & family or hosting parties. The fireplace in the family room is a wonderful place to cozy up on a cold winter day. The patio doors lead to a nice deck & spacious backyard great for cookouts or relaxing on a summer evening w/ your favorite beverage. The primary bedroom is large & offers a huge walk-in closet that will allow you lots of options. The patio doors lead to a private deck to enjo
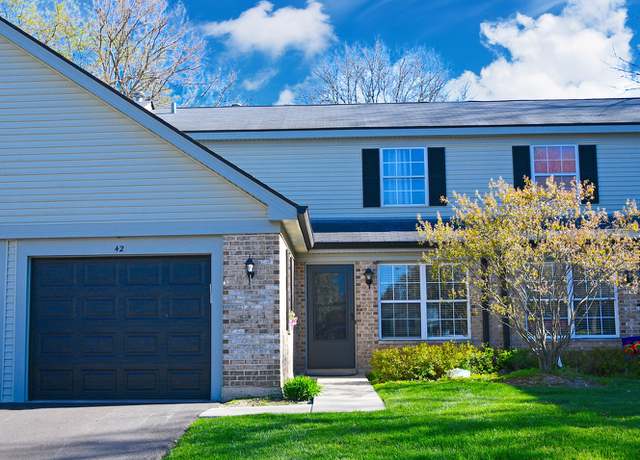
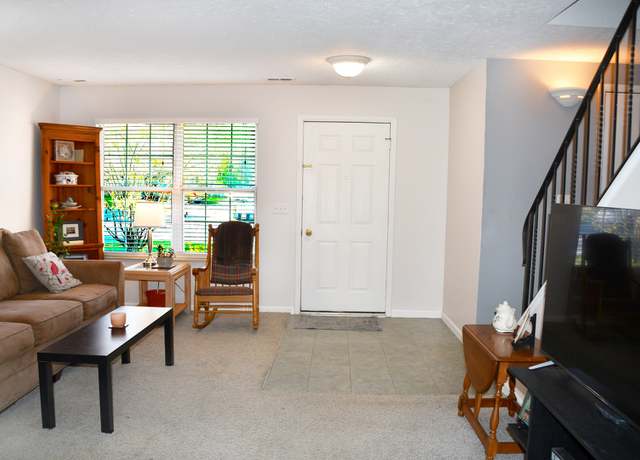
Highest and best by 4/30 by 12 pm. Townhome in Cary! Simply move in! Kitchen with Quartz countertops and all stainless-steel appliances. Popular LVT flooring, carpet and freshy painted throughout! Come see this home for yourself. Attached garage. Close to all accommodations including schools, parks, shops, restaurants and more! Not for rent or lease.
Welcome to 722 Brighton Circle! This home offers the perfect blend of comfort, style, and functionality, making it the ideal choice for you and your loved ones! Step inside and you'll be greeted by a clear layout of the home. The main level features separate kitchen, living, family, and dining rooms, offering versatility and ample space for both entertaining and everyday living. Additionally, a first-floor den serves as a flexible space, suitable for use as a guest bedroom, den, or office, accompanied by a full bathroom for added convenience. Upstairs, you'll find all four bedrooms, including a luxurious master suite with a double vanity, separate tub and shower, and a convenient laundry ch
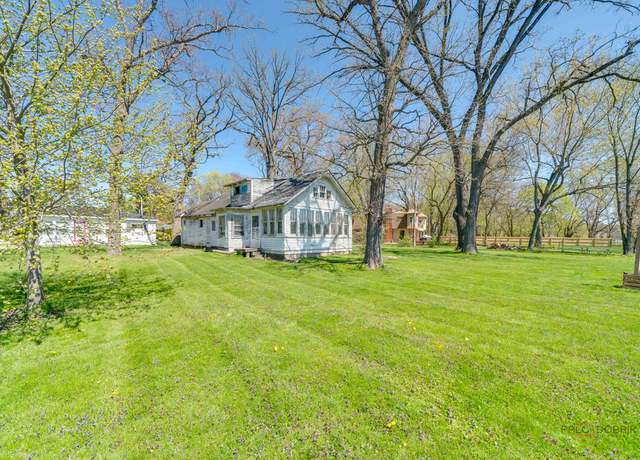
Ranch home on OVER an acre of land with 2 car attached garage & 2+ car detached garage with workshop! Backyard also features a garden pond & firepit to relax on summer days/nights!! Property sits on 7 lots. Total taxes for 2022 were 6,723.26. Home needs some TLC & is being sold "as-is. " Main level offers large Living room with hardwood floors & picture window. HUGE country Kitchen was remodeled & expanded years ago to include additional Oak cabinetry, pantry cabinet, durable counters and sleek hardwood floor. Two large bedrooms on main level with additional Den/office space. Basement features en-suite bedroom with full bath & sitting area. Lowe
Highest and best by 4/29/2024. Single Family in Cary! New carpet and popular LVT flooring. Open layout with 1st floor bedroom. 2 Car garage. This is a must see! Close to all accommodations including schools, parks shops, restaurants and more!
Welcome to your dream townhome nestled in the charming Newhaven neighborhood of Cary! This meticulously crafted 2-bedroom, 2.1-bathroom residence offers a perfect blend of comfort and updates. The open-concept layout seamlessly connects the living, dining, and kitchen areas, ideal for both entertaining guests and everyday living. The large kitchen features maple cabinet, stainless steel appliances and eating area. Off the kitchen is a great deck space, perfect for your morning coffee or evening bbq. Retreat upstairs to the spacious primary suite, complete with wood laminate flooring, a walk-in closet, and an ensuite bathroom featuring dual sinks and a luxurious soaking tub - the perfect spo
Welcome to this stunning Claridge end unit, where convenience meets luxury. Enjoy a picturesque view of the adjacent park from the comfort of your own home. This property boasts a spacious driveway with parking for four vehicles, ensuring ample space for you and your guests. Step inside to discover the elegance of hardwood floors and soaring cathedral ceilings that create an inviting atmosphere throughout. The living space is enhanced by a balcony that overlooks the serene park, providing the perfect spot for relaxation or entertaining. Downstairs, the finished basement offers endless possibilities with its generous size and brand-new carpeting. Transform this versatile space into an additi
NEW CONSTRUCTION!! Introducing an exquisite 4 bedroom, 4.1 bath new construction home where luxury meets functionality at every turn. As you step inside, a grand 2-story foyer welcomes you, setting the stage for the elegance that awaits within. This home boasts custom nine-foot ceilings throughout, accentuating the spaciousness and sophistication of each room. The centerpiece of the main level is the stunning two-story family room, complete with a cozy fireplace and beautiful hardwood flooring that flows seamlessly throughout the house. Prepare to be wowed by the gourmet kitchen, which features granite countertops, high-end Viking appliances, and a remarkable 10-foot sitting island. Flooded
Step inside & you will fall in love w/ this remodeled & updated 4BR 4 Bath home, 2 kitchens , 2 living rooms, 2 Family rooms, 2 stone Fireplaces, 2 washers and dryers, one upstairs one in the lower level. This Home is perfect for entertaining or a in-law arragement. Beautiful fenced in Backyard with patio, perfect place to relax in. Home has a open concept , with kitchen Living room dinning room and den. Materbedroom with walk in closet and master bath. Home is Ideally located Walking distance to the train, restaurants, parks and aquatic center. large Garage with extended driveway for extra parking.
Beautiful townhome in excellent "move-in" condition! All new carpeting throughout and freshly painted in neutral tones. First floor is open and light with 9' ceilings and large windows. See through gas fireplace highlights the Living room/Dining room. The Kitchen has generous cabinet and counter space, a pantry and a patio door leading to a deck. 1st floor laundry room. Separate lower level Family room. Upstairs has a loft and two Bedrooms, each with their own full bath. The Master suite has a volume ceiling and a large walk-in closet. New hot water heater, dishwasher, washer/dryer, disposal and kitchen sink. The garage is extra large and you will notice the block construction be
This rock solid Lannon Stone home needs some imagination and plenty of updates but it sits stately on a winding channel offering affordable access to the great Fox River from your own backyard, a nearby park, and private beach. The location is convenient to town, train, and a several bar and restaurant venues and only steps to the park and Cary Country Club. If these walls could talk captivating tales would be heard including being a protected Speakeasy for some of Chicago's more interesting characters including union leaders, politicians, and yes, a few mobsters. The detached shop and garage was converted into a recording studio but can be recreated easily back to a 2-plus car garage. Make
Rare chance to live your best life at this riverfront charmer in lovely Fox River Grove! Bigger than it looks with nearly 2500 sq ft of finished living space & 3 beds/1.5 baths, and several outdoor spaces with serene panoramic views of the Fox River & nature preserve across the water. Two tier deck with hot tub makes for great entertaining space, as does the stone patio out at the pier, and both are illuminated with low voltage lighting after dark. Island kitchen was tastefully remodeled in 2018 with cherry wood cabinets, stainless appliances, oak floors, and granite counters- and what views from the breakfast nook too! Beautiful bathroom remodel done in 2021. Finished basement
Welcome to your dream home at 1365 Mulberry Ln in the picturesque Cambria subdivision of Cary. The heart of this home is the open-concept design that seamlessly connects the kitchen, dining area, and living room. This open space is perfect for hosting gatherings and allows for a comfortable flow of conversation and entertainment. Dreamy backyard on a premium lot with and pond view and a gorgeous stamped concrete patio. Professionally landscaped. Newly painted with neutral paint colors. The large kitchen is great for entertaining with new SS KitchenAid appliances, granite countertops, and a large island. Sprawling entryway with large double staircase. Primary bedroom with dual walk-in closet
WOW! What a deal. Why wait for a resale when you can build new? LOT 13 features a walkout lot premium location. Introducing an exceptional opportunity to own a stunning two-story new construction home in the highly sought-after Fox Trails neighborhood of Cary! This rare gem offers the chance to customize your dream home in a desirable location. Situated on an ample lot with picturesque scenic views, this home is conveniently close to all amenities. Built by a reputable builder renowned for their timeless architectural design, quality craftsmanship, and unwavering pride in construction, this home is a testament to superior craftsmanship. Spanning 2,400 square feet of thoughtfully designed li
What a deal! Why wait for a resale when you can build new! LOT 12 features a walkout premium location. Introducing an exceptional opportunity to own a stunning two-story new construction home in the highly sought-after Fox Trails neighborhood of Cary! This rare gem offers the chance to customize your dream home in a desirable location. Situated on an ample lot with picturesque scenic views, this home is conveniently close to all amenities. Built by a reputable builder renowned for their timeless architectural design, quality craftsmanship, and unwavering pride in construction, this home is a testament to superior craftsmanship. Spanning 2,400 square feet of thoughtfully designed living sp
WOW! What a deal. Why wait for a resale when you can build new? LOT 11 features a lookout lot location. This is it! Why keep searching for listings when you can build the perfect raised ranch style home? Introducing an extraordinary opportunity to own a magnificent new construction home in the highly coveted Fox Trails neighborhood of Cary! This gem of a home allows you to customize your dream residence in a sought-after location. Nestled on a generous lot with breathtaking scenic views, this property is conveniently situated close to all the amenities you desire. Crafted by a reputable builder renowned for their timeless architectural design, quality craftsmanship, and unwavering commitm
Wow! What a deal. LOT 10 features a corner lot premium location. Why keep searching for listings when you can build the perfect raised ranch style home? Introducing an extraordinary opportunity to own a magnificent new construction home in the highly coveted Fox Trails neighborhood of Cary! This gem of a home allows you to customize your dream residence in a sought-after location. Nestled on a generous lot with breathtaking scenic views, this property is conveniently situated close to all the amenities you desire. Crafted by a reputable builder renowned for their timeless architectural design, quality craftsmanship, and unwavering commitment to excellence, this home exemplifies superior co
LOCATION. .. LOCATION. .. LOCATION!! 46 Prime acres zoned light industrial in McHenry County. Great mixed use potential in and extremely high growth corridor. Ready for development in Cary! Across the street from Stryker Corporation and just down the street from the Holiday Inn and the New Mercy Hospital. Water and sewer are located adjacent to the subject property. Currently in Cary's F. P. A. This is a wonderful opportunity! Second pin number is 1911100026 Please do not walk or drive into the property, tenants rights.
CHANCE OF A LIFETIME! This heavily wood 1.8 acre lot in unincorporated Cary is what dreams are made of! Situated off Newbold Road, the rolling hills, mature trees, and small pasture area provide endless opportunities for your future home/estate! Natural topography could possibly support a walkout basement! Plenty of room for multiple structures or your pool oasis! Highly rated Cary Schools! Just minutes to shopping, Metra and all Downtown Cary has to offer!
Waterfront land that backs up to Rotary Park! The old home was demolished. The land has been leveled, architectural plans drawn up, and permits have been approved to build a 2,370 square foot 2 story home with 3 bedrooms, an office, and 4.5 baths with one of them being in the finished basement which is another 661 square feet.
Stop searching, start building! This beautiful 0.55 acre flat lot in the heart of a quiet, established community in unincorporated Lake County is waiting for YOU. Seller has received verbal confirmation that there is room for well & septic. Variance may be needed, depending on buyer's proposed placement. Drive by today and envision your tomorrow!
Development Land At Signalized Intersection: 7.342 acre slightly irregular site at signalized intersection just west of Aldi food store. All utilities to site, offsite detention. Bank owned, engineered and graded site, now priced to sell. Ideal for banquet facility. Price reduced to $4.75 psf. Other parcels in the immediate area also available: 6.67 acres on SE corner of Three Oaks & Georgetown & 4.51 acres with frontage on Georgetown. Contact broker for pricing and information.
3 PARCELS BANK OWNED DEVELOPMENT LAND: PRICE REDUCED! Bank owned 1.97 acre commercial development land (3 separate parcels) on Route 14 next to CVS and across from former Burger King and brand new Thorntons Gas. Concept plans on file for retail and/or fast food. Dual access points to Rt 14 and East Main St with easy access to traffic light. Soil report and Phase I/II studies on file. Over 27,600 cars per day traffic count with 250 ft frontage on Rt 14 and 139 ft on E. Main St. Bank (owner) eager to help finance your project. Now $6.99 per sq ft.
Based on information submitted to the MLS GRID as of Mon Apr 29 2024. All data is obtained from various sources and may not have been verified by broker or MLS GRID. Supplied Open House Information is subject to change without notice. All information should be independently reviewed and verified for accuracy. Properties may or may not be listed by the office/agent presenting the information.
School data is provided by GreatSchools, a nonprofit organization. Redfin recommends buyers and renters use GreatSchools information and ratings as a first step, and conduct their own investigation to determine their desired schools or school districts, including by contacting and visiting the schools themselves.Redfin does not endorse or guarantee this information. School service boundaries are intended to be used as a reference only; they may change and are not guaranteed to be accurate. To verify school enrollment eligibility, contact the school district directly.
Homes for sale in Cary have a median listing price of $332K. Some of these homes are Hot Homes, meaning they're likely to sell quickly.
What are some of the most popular neighborhoods in Cary?
Popular neighborhoods include Cambria, Silver Lakes Oakwood Hills, and Fox Trails.
How often does Redfin update their new listings?
Most of our new listings in Cary are updated every 5 minutes so you can see new homes as soon as they come on the market. Learn more
What is transportation like in Cary?
Cary, Illinois offers a variety of transportation options for its residents. The town is served by Metra's Union Pacific/Northwest Line, providing public transportation to downtown Chicago and other surrounding areas. For those who prefer to drive, traffic levels are generally moderate, with peak times during morning and evening commutes. Cary also benefits from its proximity to major highways, including Route 14 and Route 31, making car travel convenient for residents. Learn more on our Cary city guide.
What types of properties are available in Cary?
Cary, Illinois offers a variety of single-family home types, including ranch-style homes, split-level homes, and two-story homes, with options available for different preferences and needs. These homes can be found throughout Cary, Illinois, with some located in established neighborhoods and others in newer developments. Most properties feature three to five bedrooms and were built in various years, providing a range of options for buyers. To explore different property types for sale in Cary, Illinois, use the 'Home type' filter located above the active listings. Customize your search by selecting options like single-family homes, condos, townhomes, and more.
What is life like in Cary?
Cary, Illinois offers a serene and picturesque environment with its rolling hills and lush greenery. The region experiences a varied climate, with warm summers and cold winters, allowing for a range of outdoor activities throughout the year. The town offers a diverse range of job opportunities across various industries, ensuring a thriving economy. Residents can engage in a plethora of recreational activities, such as hiking, biking, and exploring the numerous parks and trails. Cary, Illinois fosters a vibrant community spirit, with a wide array of events and gatherings that promote social interaction and engagement.
What are the schools and amenities like in Cary?
Cary, Illinois, offers a variety of public amenities to its residents. You can enjoy a meal at one of the many restaurants in town, catering to a wide range of culinary preferences. For outdoor enthusiasts, numerous parks are available for leisure and recreation. Grocery shopping is convenient with several grocery stores located within the town. Additional amenities include a library, a post office, and a community center, ensuring all your needs are met within Cary.
In the past month, 19 homes have been sold in Cary. In addition to houses in Cary, there was also 1 condo, 18 townhouses, and 1 multi-family unit for sale in Cary last month. Cary is a not walkable city in Illinois with a Walk Score of 24. Cary is home to approximately 17,949 people and 5,716 jobs. Find your dream home in Cary using the tools above. Use filters to narrow your search by price, square feet, beds, and baths to find homes that fit your criteria. Our top-rated real estate agents in Cary are local experts and are ready to answer your questions about properties, neighborhoods, schools, and the newest listings for sale in Cary. Our Cary real estate stats and trends will give you more information about home buying and selling trends in Cary. If you're looking to sell your home in the Cary area, our listing agents can help you get the best price. Redfin is redefining real estate and the home buying process in Cary with industry-leading technology, full-service agents, and lower fees that provide a better value for Redfin buyers and sellers.


 REDFIN IS COMMITTED TO AND ABIDES BY THE FAIR HOUSING ACT AND EQUAL OPPORTUNITY ACT. READ REDFIN'S FAIR HOUSING POLICY AND THE NEW YORK STATE FAIR HOUSING NOTICE.
 United States
 Canada